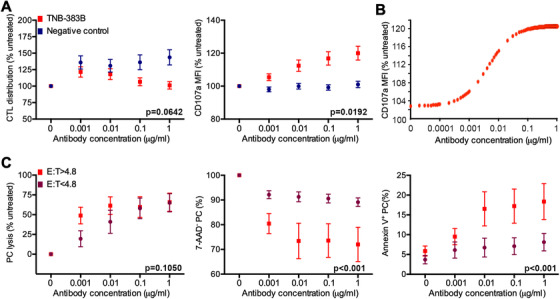
FIGURE 3.

TNB‐383B pro‐CTL function activity ex vivo. A, Interaction of treatment analysis to determine the impact of treatment (TNB‐383B vs negative control) and dose (0.001 to 1 μg) on CTL distribution and degranulation (CD107a expression). Tukey's sequential trend test was performed for each experimental treatment group, and each variable tested, utilizing ANOVA models and contrast statements to detect a linear trend in experiments involving increasing doses. B, Dose‐dependent CTL degranulation (CD107a MFI normalized to untreated) induced by TNB‐383B using Emax parametric model to estimate dose response curves, interpolating between tested doses. C, Median E:T ratio (4.8) was used as a cutoff value to test the effect PC and CTL relative distributions on TNB‐383B‐induced PC lysis, viability (7‐AAD−) and death by apoptosis (Annexin‐V+) by factorial ANOVA
