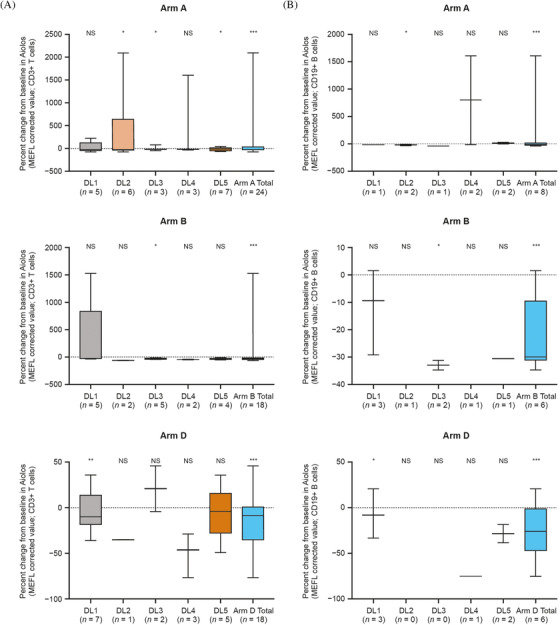
FIGURE 3.
Per cent change from baseline in Aiolos in CD3+ T cells (A) and CD19+ B cells (B) and in p4EBP1 (C) and pAKT (D) at 3 h post‐dose on day 1 of cycle 1 (biomarker‐evaluable population). The change in Aiolos expression in CD3+ T cells and CD19+ B cells was calculated within each avadomide‐ and CC‐223‐containing arm. *p ≤ 0.05 versus baseline; **p ≤ 0.01 versus baseline; ***p ≤ 0.001 versus baseline; DL, dose level; MEFL, molecules of equivalent fluorescence label; NS, not significant


