. 2022 May 30;11:e73693. doi: 10.7554/eLife.73693

Figure 3. Boundary pattern in the posterior medial cortex (PMC).

(A) PMC activation pattern similarity (Pearson correlation) between the 10 movie stimuli (M1–10), conditions (offset = boundary, middle = non-boundary), and experimental phases (encoding, recall), averaged across all subjects. The boundary pattern of a movie was defined as the mean pattern averaged across the 15 s window following the offset of the movie. The non-boundary pattern was defined as the mean pattern averaged across the 15 s window in the middle of a movie. The time windows for both boundary and non-boundary patterns were shifted forward by 4.5 s to account for the hemodynamic response delay. PMC regions of interest (ROIs) are shown as white areas on the inflated surface of a template brain. (B) Subject-specific mean activation patterns associated with between-movie boundaries during encoding (left) and recall (right). The boundary patterns were averaged across all movies and then z-scored across vertices within the PMC ROI mask, separately for each experimental phase. PMC (demarcated by black outlines) of four example subjects (S1–4) are shown on the medial surface of the right hemisphere of the fsaverage6 template brain. (C) Within-phase (recall-recall) and between-phase (encoding-recall) pattern similarity across different movies, computed separately for the boundary (offset) and non-boundary (middle) patterns in PMC. Bar graphs show the mean across subjects. Circles represent individual subjects. Error bars show SEM across subjects. ***p<.001. (D) Time-point-by-time-point PMC pattern similarity across the encoding phase and recall phase activation patterns around between-movie boundaries, averaged across all subjects. The time series of activation patterns were locked to either the onset (left) or the offset (right) of each movie. During encoding, the onset of a movie and the offset of the preceding movie were separated by a 6 s title scene. During recall, onsets and offsets of recalled movies were separated by, on average, a 9.3 s pause (boundaries concatenated across subjects, SD = 16.8 s). Dotted lines on the left and right panels indicate the mean offset times of the preceding movies and the mean onset times of the following movies, respectively. Note that in this figure zero corresponds to the true stimulus/behavior time, with no shifting for hemodynamic response delay. Areas outlined by black lines indicate correlations significantly different from zero after multiple comparisons correction (Bonferroni corrected p<0.05). Time–time correlations within each experimental phase can be found in Figure 3—figure supplement 4.

Figure 3—source data 1. Source data for Figure 3.
elife-73693-fig3-data1.xlsx (135.3KB, xlsx)

Figure 3.

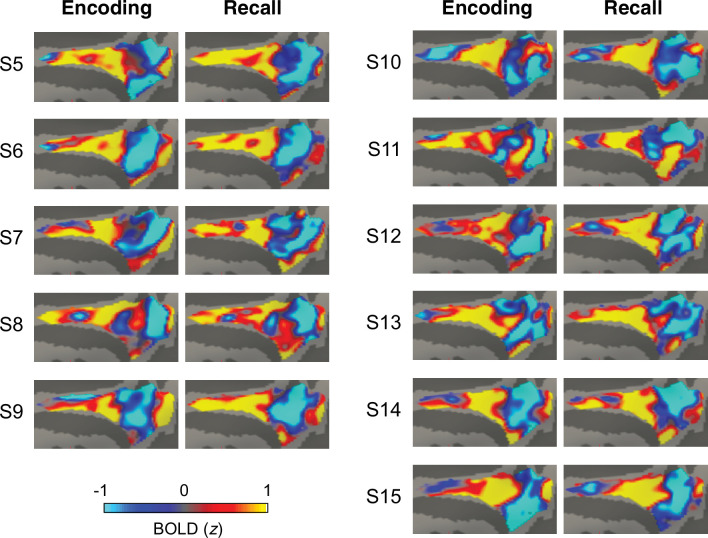
Figure 3—figure supplement 1. Subject-specific boundary patterns in the posterior medial cortex (PMC).

Figure 3—figure supplement 1.

The between-movie boundary patterns were averaged across all movies and then z-scored across vertices within the PMC region of interest (ROI) mask, separately for the encoding phase and the recall phase. PMC of 11 subjects (S5–15) are shown on the medial surface of the right hemisphere of the fsaverage6 template brain.

Figure 3—figure supplement 2. Boundary pattern in the angular gyrus (ANG).

Figure 3—figure supplement 2.

(A) ANG activation pattern similarity (Pearson correlation) between the 10 movie stimuli (M1–10), conditions (offset = boundary, middle = non-boundary), and experimental phases (encoding, recall), averaged across all subjects. The boundary pattern of a movie was defined as the mean pattern averaged across the 15 s window following the offset of the movie. The non-boundary pattern was defined as the mean pattern averaged across the 15 s window in the middle of a movie. The time windows for both boundary and non-boundary patterns were shifted forward by 4.5 s to account for the hemodynamic response delay. ANG regions of interest (ROIs) are shown as white areas on the inflated surface of a template brain. (B) Subject-specific mean activation patterns associated with between-movie boundaries during encoding (left) and recall (right). The boundary patterns were averaged across all movies and then z-scored across vertices within the ANG ROI mask, separately for each experimental phase. ANG (demarcated by black outlines) of four example subjects (S1–4) are shown on the lateral surface of the left hemisphere of the fsaverage6 template brain. (C) Within-phase (recall-recall) and between-phase (encoding-recall) pattern similarity across different movies, computed separately for the boundary (offset) and non-boundary (middle) patterns in ANG. Bar graphs show the mean across subjects. Circles represent individual subjects. Error bars show SEM across subjects. ***p<0.001. (D) Time-point-by-time-point ANG pattern similarity across the encoding phase and recall phase activation patterns around between-movie boundaries, averaged across all subjects. The time series of activation patterns were locked to either the onset (left) or the offset (right) of each movie. Dotted lines on the left and right panels indicate the mean offset times of the preceding movies and the mean onset times of the following movies, respectively. Note that in this figure zero corresponds to the true stimulus/behavior time, with no shifting for hemodynamic response delay. Areas outlined by black lines indicate correlations significantly different from zero after multiple comparisons correction (Bonferroni corrected p<0.05).
Figure 3—figure supplement 2—source data 1. Source data for Figure 3—figure supplement 2.

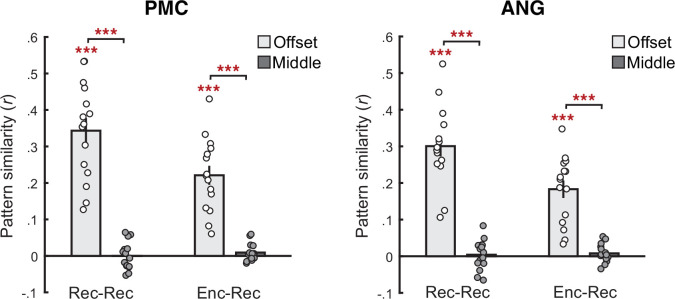
Figure 3—figure supplement 3. Boundary patterns in regions of interest measured during shorter (4.5 s) time windows.

Figure 3—figure supplement 3.

Within-phase (recall-recall) and between-phase (encoding-recall) pattern similarity across different movies, computed separately for the boundary (offset) and non-boundary (middle) patterns in the posterior medial cortex (PMC; left panel) and the angular gyrus (ANG; right panel). Boundary periods were defined as 4.5–9 s from the offset of each movie. Non-boundary periods were defined as the middle 4.5 s of each movie, shifted forward by 4.5 s to account for hemodynamic response delay. Bar graphs show the mean across subjects. Circles represent individual subjects. Error bars show SEM across subjects. ***p<0.001.
Figure 3—figure supplement 3—source data 1. Source data for Figure 3—figure supplement 3.

Figure 3—figure supplement 4. Time–time pattern similarity in the posterior medial cortex (PMC).

Figure 3—figure supplement 4.

The similarity matrices show Pearson correlations between PMC patterns across time points around between-movie boundaries during encoding (A, B) and recall (C, D), calculated within each subject and then averaged across all subjects. The time series of activation patterns were locked to either the onset (A, C) or the offset (B, D) of each movie. Dotted lines in (A) and (C) indicate the mean offset times of the preceding movies. Dotted lines in (B) and (D) indicate the mean onset times of the following movies. Note that in this figure zero corresponds to the true stimulus/behavior time, with no shifting for hemodynamic response delay. Areas outlined by black lines indicate correlations that significantly deviate from zero after multiple comparisons correction (Bonferroni corrected p<0.05). The boundary pattern emerged following the offsets but preceded the onsets of watched or recalled movies. In addition, the boundary pattern was stronger and lasted longer following encoding offsets compared to recall offsets; this may be because boundaries between movies were more salient during initial movie watching as they accompanied both external and internal mental context changes, whereas recall boundaries accompanied internal context changes only. Encoding boundaries were also more unpredictable and may require a more gradual build-up of the upcoming mental context, compared to self-generated boundaries between already stored memories during recall.
Figure 3—figure supplement 4—source data 1. Source data for Figure 3—figure supplement 4.