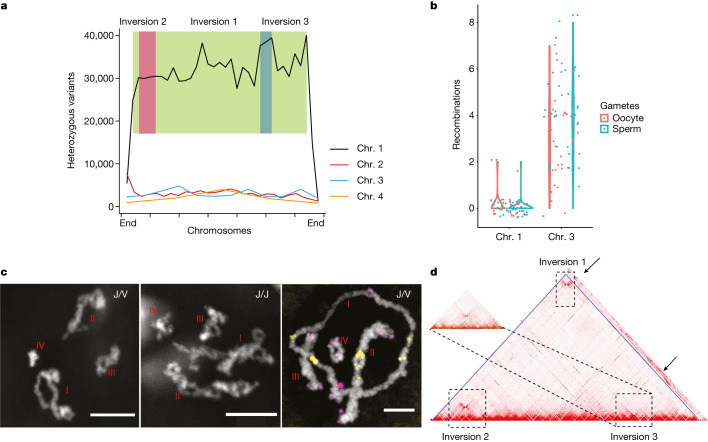
Fig. 2. Recombination suppression and inversions on chromosome 1.
a, Distribution of heterozygous variants maintained in the S2 inbreeding pedigree along the four chromosomes. The y axis shows variant counts per 10 Mb. Green, pink and blue boxes represent inversions 1, 2 and 3, respectively. b, Number of meiotic recombination events on chromosomes 1 and 3 in oocytes (red) and sperm cells (cyan). Dots represent individual gametes, summarized with violin plots. c, Chromosome 1 in late prophase I in oocytes from J/V worms (left and right panels) shows fewer crossovers than in oocytes from J/J worms (middle panel). This experiment was repeated more than 10 times independently with similar results. The right panel shows FISH42 results with probes for the telomeric repeat TTAGGG (magenta) and a repeat located near the centromere (yellow). This experiment was repeated more than three times independently with similar results. d, Chromatin contact heat map for chromosome 1. Dashed-line rectangles indicate the locations of potential inversions. Arrows indicate chromatin contact signals with inversion regions from unassigned scaffolds.

