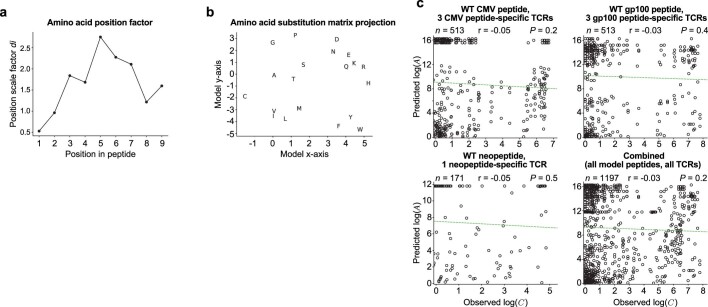
Extended Data Fig. 7. Cross-reactivity distance C model.
Amino acid position dependent factor (a) and substitution matrix (b) of cross-reactivity model based on T cell receptor (TCR) cross-reactivity to strong (CMV) and weak (gp100) s and single amino acid substituted s (Fig. 3d, e). (c) Correlation of substitution-induced differential MHC-I binding ( = ) and substitution induced differential TCR activation ( = ) for all model -TCR pairs and single amino acid substituted s. and determined through computational predictions of and binding to HLA-A*02:01 (CMV, gp100 peptides) and HLA-B*27:05 (tumour neopeptide) with Net MHC 3.4. and measured experimentally through and reactivity to TCRs. n = individual peptide-TCR measurements. P values by two-tailed Pearson correlation (c).

