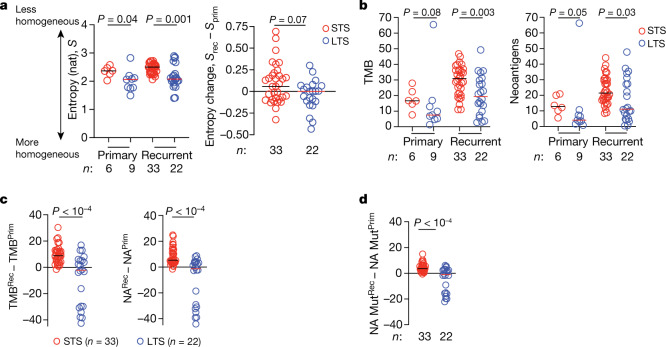
Fig. 2. LTSs of PDAC develop tumours with fewer neoantigens.
a, Shannon entropy (S, left), and the difference in Shannon entropy between recurrent (Srec) and primary (Sprim) PDACs (right). b, TMB and neoantigen number (NA) in primary and recurrent PDACs. c, d, The difference in TMB and NA (c), and the number of mutations that generate neoantigens (NA Mut) (d) between recurrent and primary PDACs. n indicates the number of individual tumours. The horizontal bars show the median values. For a–d, P values were determined using two-tailed Mann–Whitney U-tests.

