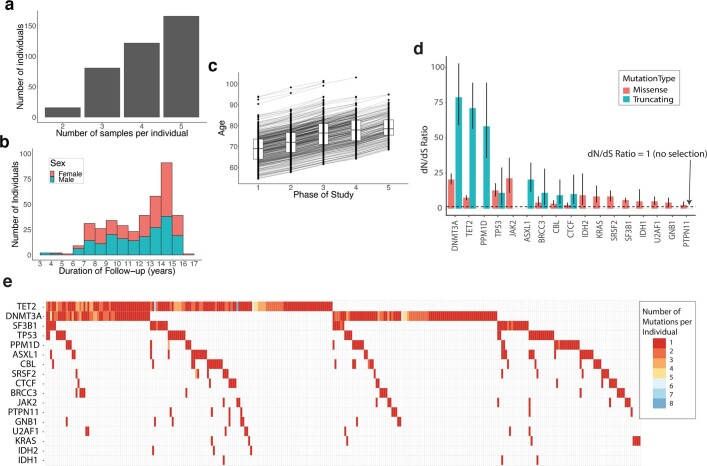
Extended Data Fig. 1. Longitudinal cohort characteristics and mutation prevalence and selection across the studied genes.
a, Distribution of the number of serial samples obtained per individual. b, Duration of follow-up per individual. c, Distribution of participants’ ages at each of the five sampling phases of the SardiNIA study. The boxes represent the 25th, 50th (median) and 75th percentiles of the data; the whiskers represent the lowest (or highest) datum within 1 interquartile range from the 25th (or 75th) percentile. d, Observed-to-expected (dN/dS) ratios for the 17 genes with missense and/or truncating mutations under positive selection (with q < 0.1). The dashed line indicates a dN/dS value of 1, which represents neutrality (no selection). Error bars depict 95% CIs. e, Waterfall plot showing the number and distribution of mutations among participants. Each column represents 1 individual, and each row 1 gene. Coloured squares indicate the presence of a mutation with the specific colour indicating the number of distinct mutations in that gene identified in that individual. For individuals with the same mutation identified at multiple serial time-points, the serially-observed mutation is counted only once.

