

Abstract
Tumorigenesis is associated with elevated glucose and glutamine consumption, but how cancer cells can sense their levels to activate lipid synthesis is unknown. Here, we reveal that ammonia, released from glutamine, promotes lipogenesis via activation of sterol regulatory element-binding proteins (SREBPs), endoplasmic reticulum (ER)-bound transcription factors that play a central role in lipid metabolism. Ammonia activates the dissociation of glucose-regulated, N-glycosylated SREBP cleavage-activating protein (SCAP) from Insig, an ER-retention protein, leading to SREBP translocation and lipogenic gene expression. Interestingly, 25-hydroxycholesterol blocks ammonia to access its binding site on SCAP. Mutating aspartate D428 to alanine prevents ammonia binding to SCAP, abolishes SREBP-1 activation, and suppresses tumor growth. Our study characterizes the unknown role, opposite to sterols, of ammonia as a key activator that stimulates SCAP/Insig dissociation and SREBP-1 activation to promote tumor growth, and demonstrates that SCAP is a critical sensor of glutamine, glucose and sterol levels to precisely control lipid synthesis.
Keywords: Ammonia, glutamine, glutaminase (GLS), glucose, N-glycosylation, SCAP, SREBP-1, lipogenesis, sterols, cholesterol, lung cancer, glioblastoma
Introduction
Lipids form the basic structure of the plasma membrane and of all cellular organelle membranes, which makes gaining sufficient lipids a precondition for cell growth and proliferation1–4. Under physiological conditions, lipid levels are mainly regulated by sterol regulatory element-binding proteins (SREBPs), a family of transcription factors that include three isoforms, SREBP-1a, -1c and -25–7. SREBP-1c mainly regulates the expression of genes controlling fatty acid synthesis, whereas SREBP-2 regulates cholesterol synthesis and uptake, and SREBP-1a, which has the highest transcriptional activity, regulates all processes2,8–10. Recently, a series of studies from our group and others have demonstrated that SREBP-1 is highly activated in malignancies, e.g., glioblastoma (GBM), liver, breast, and colorectal cancers1,11–17. Nevertheless, the regulation mechanisms of SREBP-1 activation and lipid metabolism in cancer cells remain elusive.
SREBPs are synthesized as inactive precursors (∼125 kD) that are retained in the endoplasmic reticulum (ER) membrane, and are activated through a tightly controlled ER-Golgi-nucleus translocation process6,9. SREBPs first bind to SREBP-cleavage activating protein (SCAP), which further binds to COPII-coated vesicles that transport the SCAP/SREBP complex from the ER to the Golgi9,18. In the Golgi, SREBPs are sequentially cleaved by site-1 and -2 proteases, which release their N-terminal forms (∼65 kD) that then enter into the nucleus to activate lipogenic gene expression19–23. However, the trafficking of the SCAP/SREBP complex is suppressed by the ER-retention protein, insulin-inducible gene protein (Insig), which includes two isoforms, Insig-1 and -224,25. Insig binds to SCAP to retain the SCAP/SREBP complex in the ER6,18. Previous studies have revealed that cholesterol or 25-hydroxycholesterol (25-HC) can bind to SCAP or Insig to enhance their association, which mediates a negative feedback loop to modulate SREBP activation24,26,27. However, the key step activating the dissociation of SCAP from Insig for subsequent translocation remains unclear.
Our recent study demonstrated that glucose stimulates SREBP activation and lipogenesis by promoting SCAP N-glycosylation and stability28–31. In this study, we unexpectedly found that when glutamine is lacking, glucose alone is unable to activate SREBPs and lipogenesis despite low cholesterol levels and stable SCAP N-glycosylation. We unveiled that N-glycosylated SCAP requires the stimulation of ammonia released from glutamine to undergo sequential conformational changes in order to dissociate from Insig and promote SREBP translocation and lipogenesis. We identified the binding site of ammonia in the central location of SCAP transmembrane domain, including D428 and serine S326/S330 residues, and demonstrated that the function of ammonia is prevented by 25-HC, which blocks access to its binding site on SCAP, thereby suppressing SCAP/Insig dissociation and SREBP activation. Our study further suggests that targeting the key molecular link between glutamine, glucose and lipid metabolism is a promising strategy for treating malignancies and metabolic syndromes.
Results
Glutamine is necessary for SREBP activation and lipogenesis
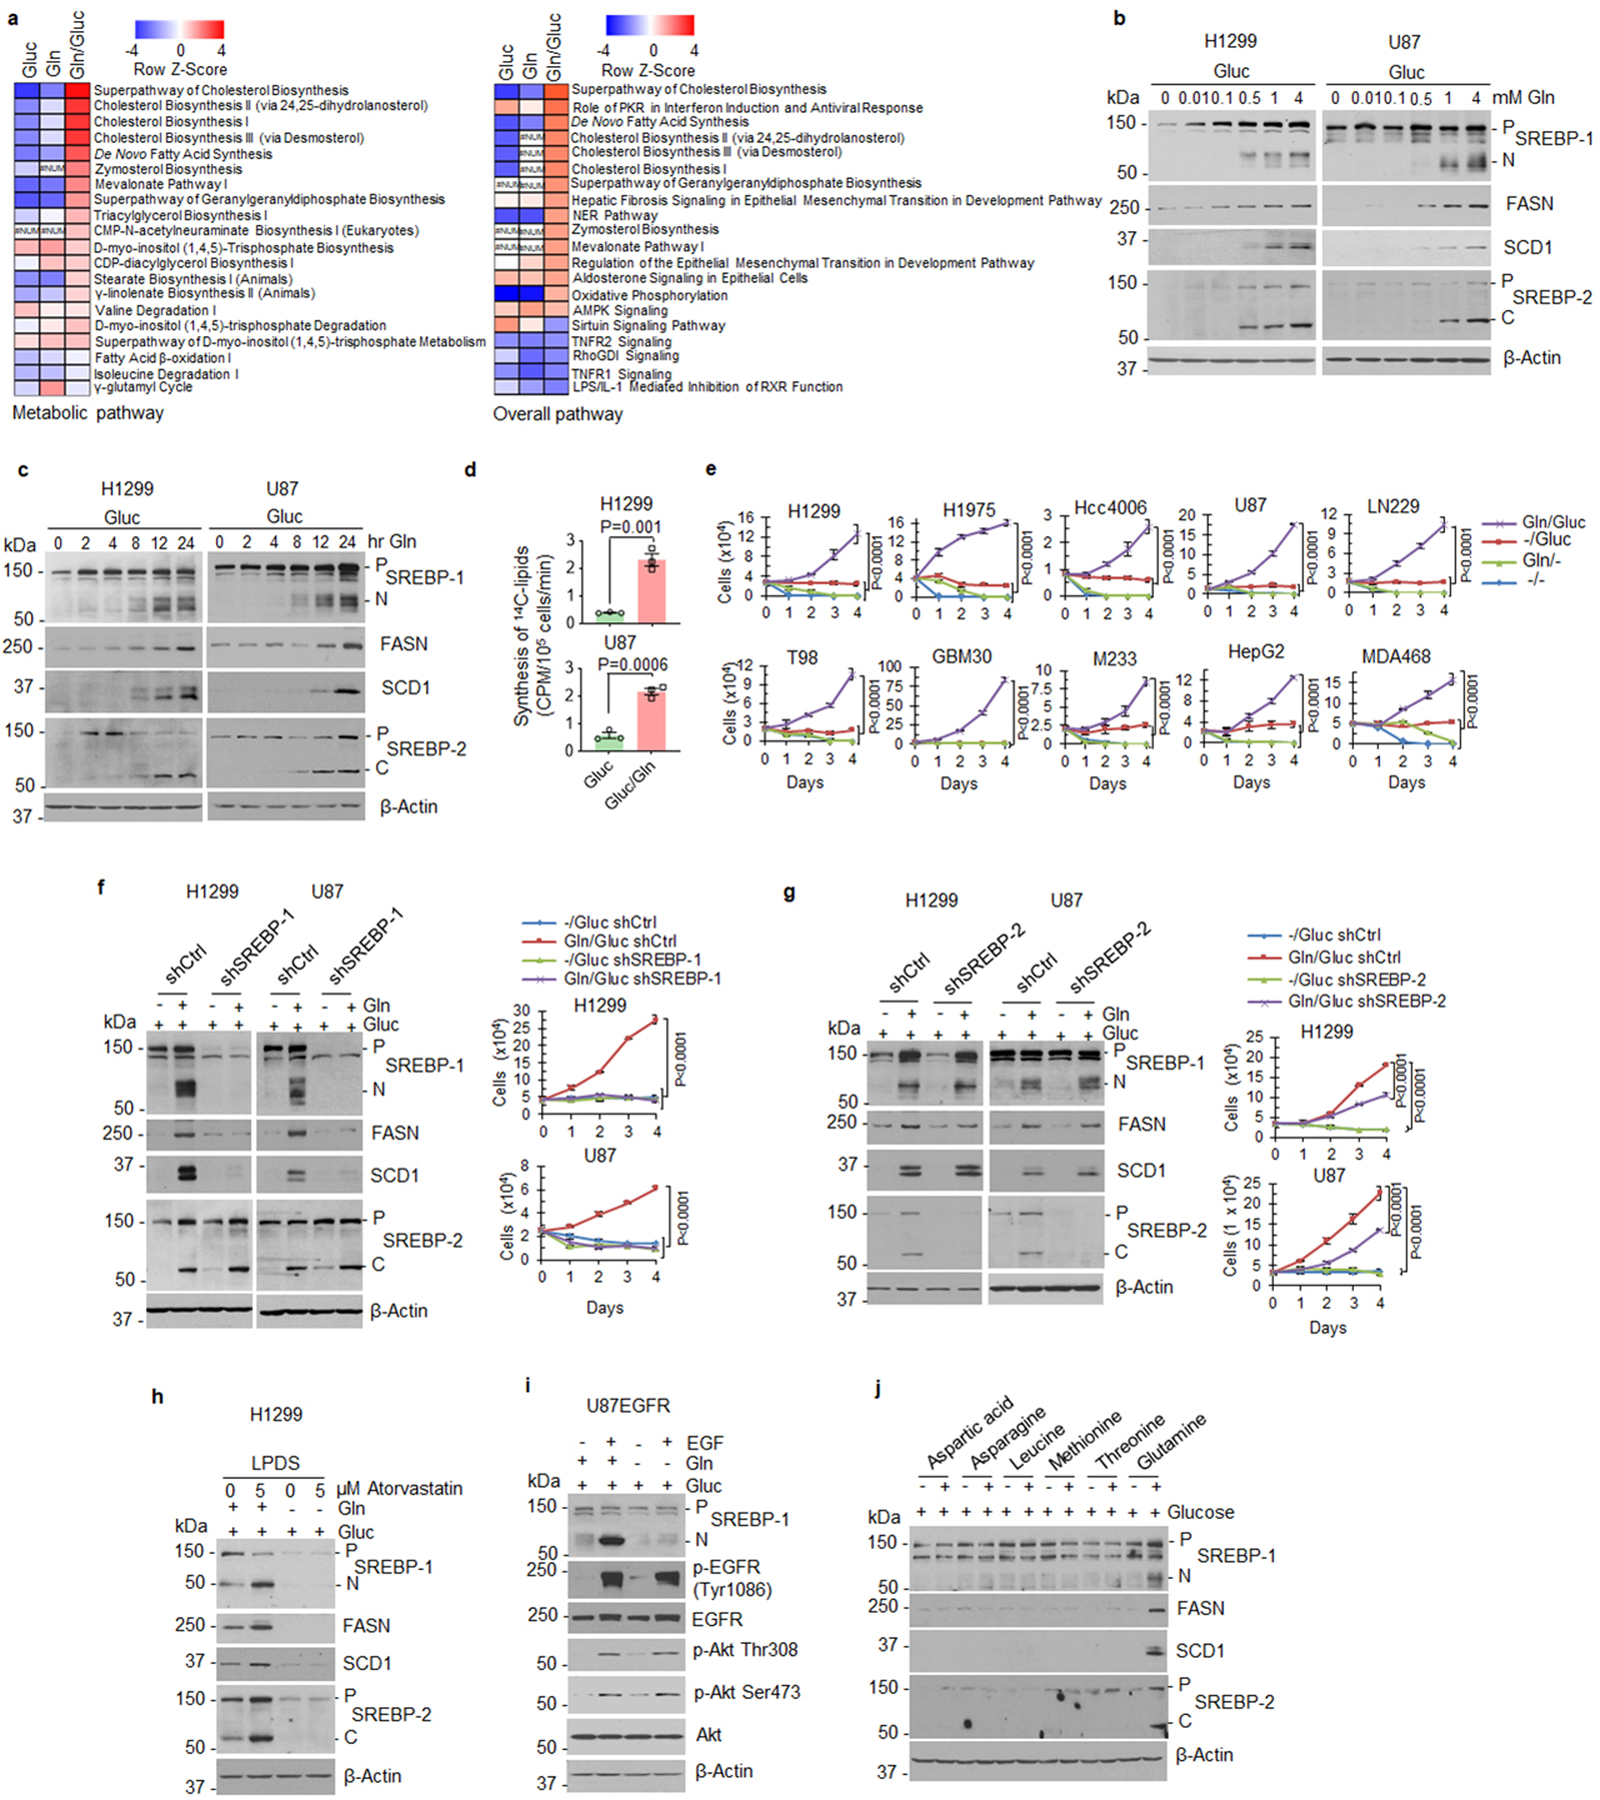
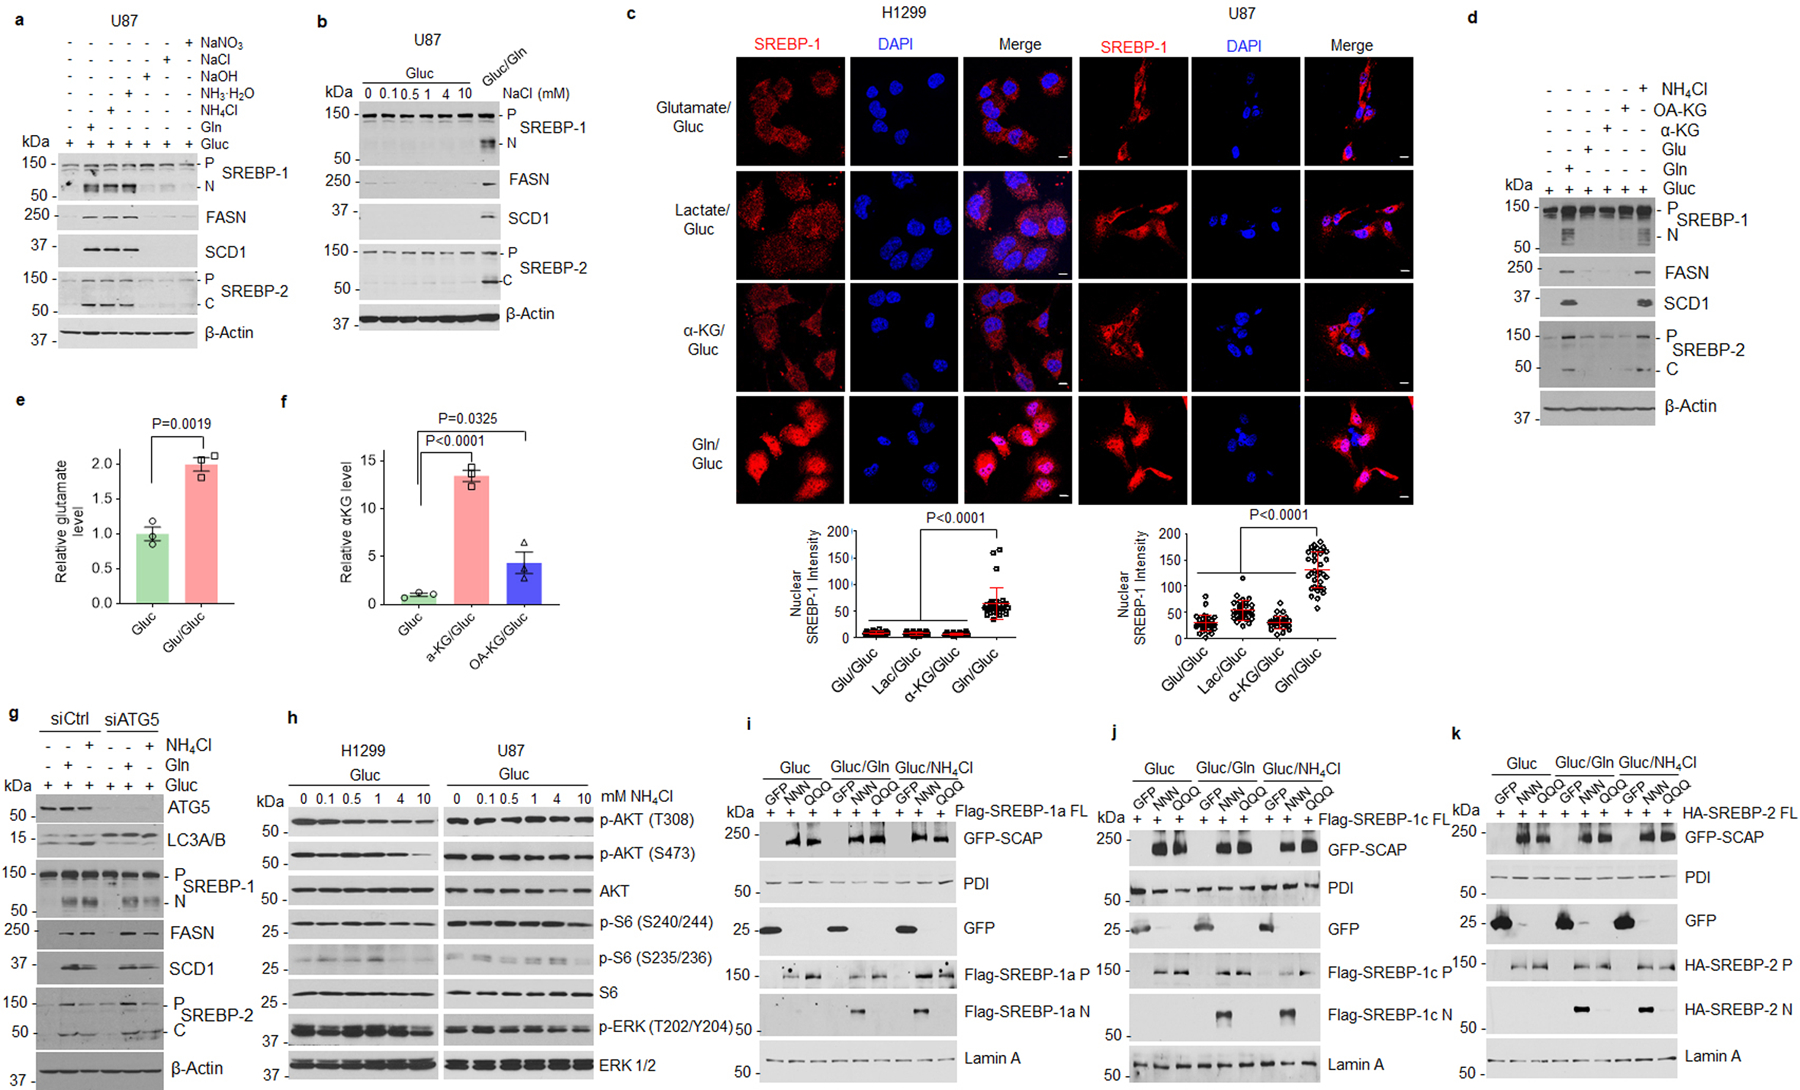
In addition to glucose, cancer cells also consume large amounts of glutamine, the most abundant amino acid in human blood, and require dramatically elevated lipogenesis to promote tumor growth32–38. Whether there is an intrinsic molecular connection between glutamine, glucose and lipid synthesis is unknown. To test this, we first conducted a transcriptome analysis using RNA sequencing in lung cancer H1299 cells to determine the response of lipogenic genes to absence vs. presence of glutamine (Gln) or glucose (Gluc). Unexpectedly, neither glutamine nor glucose alone was able to activate the expression of genes regulating fatty acid and cholesterol synthesis, and uptake, including SREBF1, SREBF2, ACLY, ACACA, FASN, SCD1, HMGCR and LDLR, as compared to absence of both (Fig. 1a, Extended Data Fig. 1a). Notably, activation of lipogenic genes required the presence of both glutamine and glucose, but SCAP gene expression was not affected by either glutamine or glucose (Fig. 1a). These results were validated by real-time PCR (Fig. 1b).
Fig. 1. Glutamine is necessary for SREBP activation and lipogenesis.
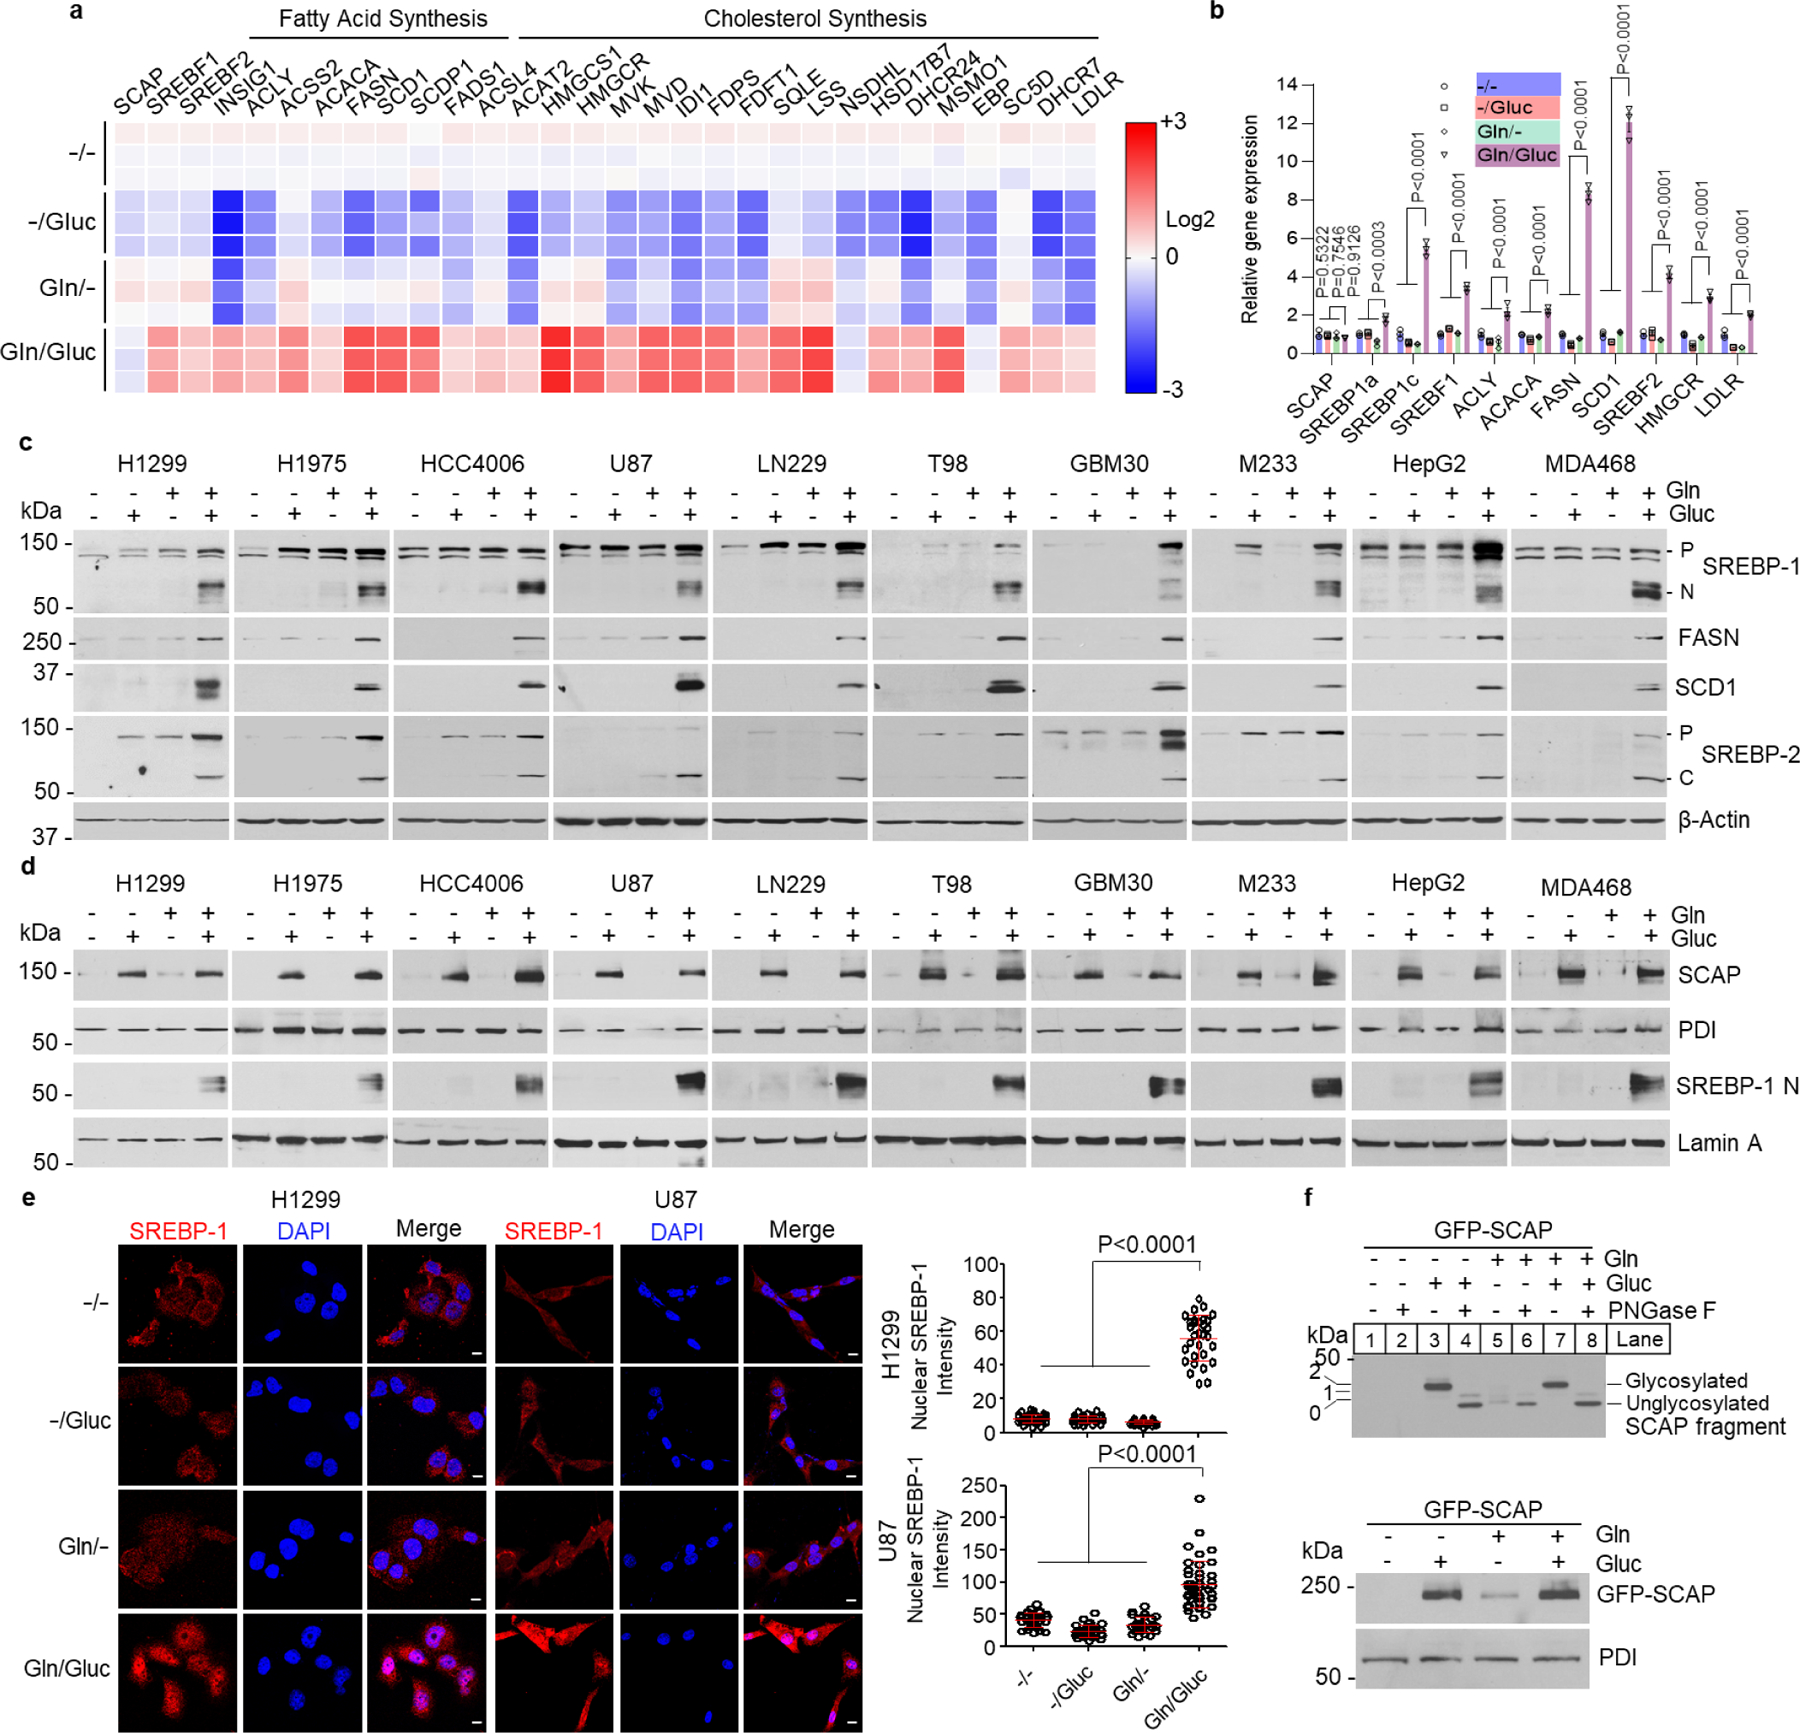
a, Heatmap of gene expression analyzed by RNA-seq in H1299 cells. H1299 cells were cultured in full RPMI 1640 medium supplemented with 5% FBS for 24 hr. Cells were then washed with PBS once and placed in fresh serum-free medium with or without glutamine (4 mM) or glucose (5 mM) for 12 hr before analysis.
b, Real-time PCR analysis of gene expression in H1299 cells under the same culture condition shown above. The results are shown as mean ± SEM (n = 3). SREBF1, the gene name of SREBP-1; ACLY, ATP citrate lyase; ACACA, acetyl-CoA carboxylase alpha; FASN, fatty acid synthase; SCD1, stearoyl-CoA desaturase 1; SREBF2, the gene name of SREBP-2; LDLR, low-density lipoprotein receptor; HMGCR, 3-hydroxy-3-methylglutaryl-CoA reductase.
c, Western blot analysis of whole lysates from different cancer cells under the same culture conditions as in (a). U87, LN229, T98, M233, GBM30, HepG2, and MDA468 were cultured in DMEM medium, and H1299, H1975, and HCC4006 in RPMI 1640 medium. P, precursor of SREBP; N, N-terminus of SREBP-1. C, C-terminus of SREBP-2.
d, Western blot analysis of membrane (for SCAP) and nuclear extracts (for N-terminal SREBP-1) from different cancer cells under the same culture conditions as in (a, c). Protein disulfide-isomerase (PDI), an ER-resident protein.
e, Representative immunofluorescence (IF) images of anti-SREBP-1 staining (red) in H1299 and U87 cells under the same culture conditions as in (a, c). Nuclei were stained with DAPI (blue). Scale bars, 10 μm. The nuclear intensity of SREBP-1 was quantified over 30 cells by ImageJ (mean ± SEM, n≥ 30) (right panel).
f, Western blot analysis of SCAP N-glycosylation (upper panel) and total GFP-SCAP (lower panel) in cell membrane fractions from HEK293T cells placed in serum-free DMEM medium with/without the presence of glutamine (4 mM) or glucose (5 mM) for 12 hr. The numbers on the left side of the blot indicate the number of N-glycosylated residues on the SCAP protein (upper panel). PNGase F, 1 Unit.
Two-way (b) or one-way ANOVA (e) with Dunnett’s multiple comparisons were performed.
We next examined whether glutamine is required for SREBP activation using multiple cancer cell lines. Western blot analysis showed that glucose alone failed to activate the cleavage of SREBP-1 and SREBP-2 (Fig. 1c). The expression of fatty acid synthase (FASN) and stearoyl-CoA desaturase-1 (SCD1), two key downstream targets of SREBP-1, was also not activated by glucose alone (Fig. 1c). Only the combination of glutamine and glucose was able to strongly induce cleavage of SREBP-1 and -2, as demonstrated by the dramatic increase of their N- or C-terminal products, and the upregulation of FASN and SCD1 expression (Fig. 1c). Furthermore, western blot analysis showed that glutamine in the presence of glucose activated SREBP-1 and -2 cleavage and FASN and SCD1 expression in a dose- and time-dependent manner (Extended Data Fig. 1b, c). Radioisotope assays showed that glutamine significantly increased lipid synthesis derived from glucose (Extended Data Fig. 1d). Moreover, SREBP activation by glutamine and glucose closely correlated with the high proliferation rate of all tested cancer cells, as compared to lack of cell proliferation under glucose or glutamine alone conditions (Extended Data Fig. 1e). Cell proliferation under these conditions was completely abolished by genetic inhibition of SREBP-1 via shRNA, while it was only slightly reduced by SREBP-2 knockdown (Extended Data Fig. 1f, g), demonstrating that SREBP-1 activation plays a major role in the cell proliferation.
As cholesterol has been demonstrated to be a critical negative regulator of SREBP activation6, we examined whether cholesterol reduction is sufficient to activate SREBPs. Surprisingly, severely reducing cholesterol levels by inhibiting its biosynthesis via atorvastatin in cholesterol-deficient medium failed to activate SREBP-1 and -2 cleavage in the absence of glutamine (Extended Data Fig. 1h). We previously demonstrated that EGFR/PI3K/Akt signaling promotes SREBP-1 activation by increasing glucose uptake and SCAP N-glycosylation28. In the absence of glutamine, activating EGFR/PI3K/Akt signaling by EGF did not result in SREBP-1 activation, even glucose was present (Extended Data Fig. 1i). We also examined whether other amino acids could play a critical role in SREBP-1 activation. The RPMI 1640 cell culture medium contains all 20 common amino acids. When removing only glutamine, with all other 19 amino acids and glucose remaining in the medium for lung cancer cell culture (H1299, H1975 and HCC4006), western blotting showed that SREBP cleavage and expression of FASN and SCD1 failed to be activated (Fig. 1c). We selected 5 amino acids, i.e., aspartate, asparagine, leucine, methionine, and threonine, for confirmation. When lacking glutamine, none of these amino acids in combination with glucose was able to activate SREBP cleavage and FASN/SCD1 expression (Extended Data Fig. 1j). These data confirmed that glutamine is the key amino acid controlling lipogenesis activation.
We next examined whether the lack of glutamine would affect SCAP protein stability, thereby leading to the inactivation of SREBPs. Consistent with our previous study28, western blot analysis showed that absence of glucose resulted in SCAP degradation and inactivation of SREBP-1 cleavage, as reflected by the lack of N-terminal SREBP-1 in the nuclear extracts (Fig. 1d, lane 1 and 3). In contrast, when glucose was present, removing glutamine had no influence on SCAP protein levels as compared to its levels when combining glutamine and glucose (Fig. 1d, lane 2 and 4); however, these data were puzzling as we could not detect any active N-terminal SREBP-1 in nuclear extracts in the absence of glutamine (Fig. 1d, lane 2 vs. lane 4). Immunofluorescence staining confirmed that SREBP-1 was unable to move to the nucleus, unless glutamine and glucose were both present (Fig. 1e). We also examined SCAP N-glycosylation under the same culture conditions in HEK293T cells expressing GFP-SCAP, as we previously published28,31. The data showed that in the presence of glucose, removing glutamine had no influence on SCAP N-glycosylation (Fig. 1f, lane 3–4 vs. lane 7–8, upper panel), and GFP-SCAP protein levels (Fig. 1f, lane 2 vs. lane 4, lower panel).
Together, these data demonstrate that glucose-mediated SCAP N-glycosylation is necessary for SCAP stability but is not sufficient for activation of SREBPs and lipogenesis that require the presence of glutamine, suggesting the existence of an important intrinsic molecular link connecting glutamine and glucose to lipid metabolism.
Glutamine-released ammonia activates SREBPs and lipogenesis
Glutaminolysis is known to be highly activated in many cancers32–34,39–43. In this process, glutamine is first deaminated by glutaminase (GLS) to release ammonia (NH3), and produce glutamate44. Glutamate is further converted to α-ketoglutarate (α-KG) that incorporates into the tricarboxylic acid (TCA) cycle for energy production39,45. By using the Bioprofile 100 Plus Analyzer, we detected NH3, which is converted to NH4+ in aqueous solution, and glutamate, in the media from H1299 and U87 cells cultured in the presence of glutamine without glucose (12 hr) (Fig. 2a, middle panels). NH3 and NH4+ are thereafter referred as ammonia. In contrast, when cells were cultured in the presence of glucose but without glutamine, lactate and glutamate were detected (Fig. 2a, top panels). When combining glutamine and glucose, all three metabolites, i.e., NH4+/glutamate/lactate, were detected (Fig. 2a, bottom panels).
Fig. 2. Glutamine-released ammonia activates SREBPs and lipogenesis.
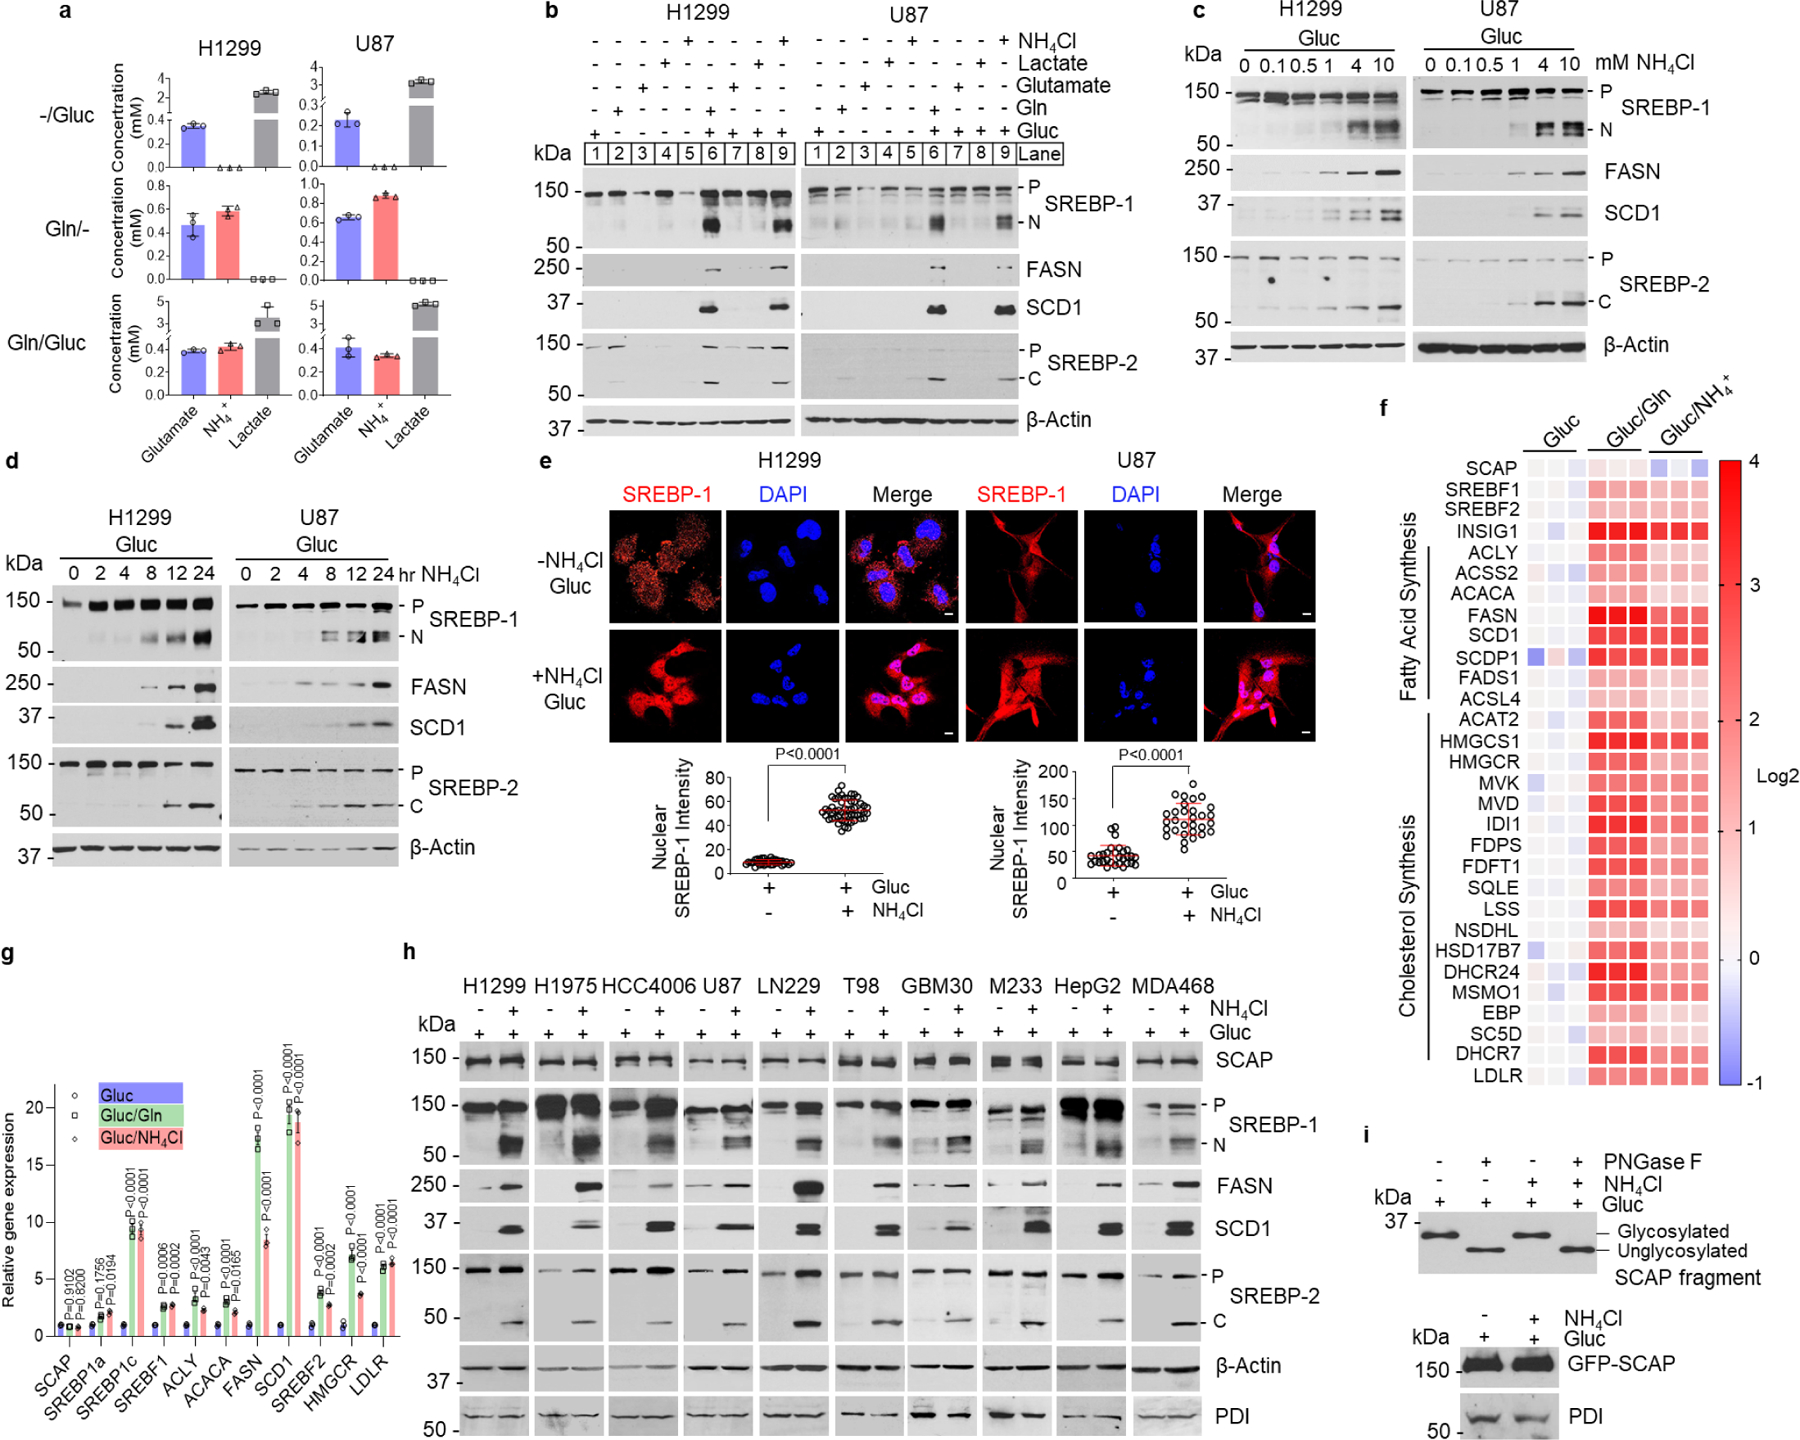
a, Metabolite levels in culture media measured with the Bioprofile 100 Plus Analyzer (mean ± SD; n = 3). H1299 or U87 cells were cultured in RPMI 1640 or DMEM medium with 5% FBS for 24 hr, and then washed with PBS once and placed in fresh serum-free medium with or without glutamine (4 mM) or glucose (5 mM) for 12 hr before measurement.
b, Western blot analysis of whole lysates of cells cultured in serum-free medium with or without the presence of glucose (5 mM), glutamine (4 mM), glutamate (4 mM), lactate (10 mM) or NH4Cl (4 mM) for 12 hr.
c-d, Western blot analysis of whole lysates from cells after NH4Cl stimulation at the indicated doses for 12 hr (c) or over time after 4 mM NH4Cl stimulation (d).
e, Representative IF images of anti-SREBP-1 staining (red) in cells with or without NH4Cl (4 mM) stimulation for 12 hr. Scale bars, 10 μm. The nuclear intensity of SREBP-1 was quantified over 30 cells by ImageJ (mean ± SEM, n≥30) and shown below. Significance was determined by unpaired and two-tailed Student’s t test.
f, Heatmap of gene expression analyzed by RNA-seq in H1299 cells after glutamine (4 mM) or NH4Cl (4 mM) stimulation for 12 hr.
g, Real-time PCR analysis of gene expression in H1299 cells under the same culture conditions as in (f). The results are shown as mean ± SEM (n = 3). Significance was determined by two-way ANOVA with Dunnett’s multiple comparison adjustment.
h, Western blot analysis of membrane extracts (for SCAP) and whole cell lysates from different cancer cells stimulated with or without NH4Cl (4 mM) for 12 hr.
i, Western blot analysis of SCAP N-glycosylation (upper panel) and total GFP-SCAP (lower panel) in cell membrane fractions from HEK293T cells transfected with GFP-SCAP for 24 hr and then stimulated with/without NH4Cl (4 mM) for an additional 12 hr. PNGase F, 1 Unit. All cells in panels (c-i) are placed in serum-free medium containing 5 mM glucose upon the stimulation.
We then examined which of the metabolites was involved in SREBP activation. Western blot analysis showed that neither glutamate, ammonia (derived from added NH4Cl) or lactate alone, nor the combination of glucose with glutamate or lactate were able to activate SREBP-1 or -2 cleavage and promote FASN and SCD1 expression (Fig. 2b). In contrast, in the presence of glucose, ammonia induced SREBP-1 and -2 cleavage, and FASN and SCD1 expression to a similar extent as the combination of glutamine and glucose did (Fig. 2b, lane 9 vs. lane 6, and Extended Data Fig. 2a). The effects of ammonia were dose- and time-dependent (Fig. 2c, d). NaCl supplementation had no effect on SREBP cleavage and FASN/SCD1 expression (Extended Data Fig. 2a, b). Immunofluorescence imaging further showed that in the presence of glucose, ammonia markedly stimulated SREBP-1 translocation into the nucleus without the presence of glutamine (Fig. 2e), while glutamate, lactate or α-KG stimulation failed to do so (Extended Data Fig. 2c). We also confirmed that the glutamate and α-KG added to the medium were taken up by tumor cells, while their addition in combination with glucose had no effects on SREBP cleavage and downstream FASN/SCD1 expression (Extended Data Fig. 2d–f). Ammonia has previously been reported to upregulate autophagy46. Western blot analysis showed that knockdown of ATG5 to block autophagy was unable to abolish glutamine- and ammonia-stimulated SREBP cleavage and FASN/SCD1 expression (Extended Data Fig. 2g), excluding the involvement of autophagy in ammonia-mediated SREBP activation.
We next examined whether ammonia activated ERK or Akt/mTOR signaling. Western blot analysis showed that ammonia, from 0.1 mM to 10 mM, did not increase the levels of p-ERK, p-Akt and p-S6, an mTOR downstream target in the presence of glucose (Extended Data Fig. 2h), which excluded the involvement of ERK or Akt/mTOR in the ammonia-promoted SREBP activation. RNA sequencing analysis in H1299 cells confirmed that ammonia, similarly to glutamine, significantly activated the expression of genes controlling the fatty acid and cholesterol synthesis pathways as compared to glucose alone (Fig. 2f), which was further confirmed by real-time PCR (Fig. 2g).
We further examined whether ammonia affected glucose-regulated SCAP stability and N-glycosylation. Western blot analysis showed that in the presence of glucose, ammonia had no effect on both SCAP protein and N-glycosylation levels as compared to glucose alone (Fig. 2h, i), while it dramatically activated SREBP-1 and -2 cleavage and increased FASN and SCD1 expression (Fig. 2h). We further examined whether SCAP N-glycosylation remained necessary for glutamine- and ammonia-induced activation of SREBPs. We used our previously established GFP-labeled SCAP mutant construct where all three asparagine residues (N) 263, 590 and 641 (NNN), the sites for N-glycosylation, were replaced with glutamine (QQQ)28, which was co-transfected with full-length SREBP plasmids in HEK293T cells. Either glutamine or ammonia in the presence of glucose strongly activated the cleavage of SREBP-1a, -1c and -2 isoforms in wild-type SCAP (NNN) transfected cells (Extended Data Fig. 2i–k), while the activation was lost in cells transfected with the SCAP mutant (QQQ) (Extended Data Fig. 2i–k), demonstrating that SCAP N-glycosylation is required for glutamine or ammonia to activate SREBPs.
Together, these data demonstrate that ammonia, released by glutamine, is a key activator of SREBP activation and lipogenesis, while which requires the presence of glucose to maintain SCAP stability via its N-glycosylation.
Inhibiting glutaminolysis abolishes SREBP activation
We next validated the role of ammonia released from glutamine in the stimulation of SREBP activation and lipogenesis. We suppressed glutamine uptake with γ-glutamyl-p-nitroanilide (GPNA), an inhibitor of SLC1A5 (also named ASCT2) that is the major glutamine transporter47, and blocked glutaminolysis with CB-839, a GLS inhibitor. Metabolite analysis showed that both GPNA and CB-839 treatment dramatically reduced the levels of glutamate, ammonia and α-KG in cells and in cell culture media (Fig. 3a, Extended Data Fig. 3a), which was associated with a significant reduction of glutamine consumption (Extended Data Fig. 3b). Both inhibitors dramatically suppressed glutamine-stimulated SREBP activation and FASN and SCD1 expression (Fig. 3b, Extended Data Fig. 3c, d). We then supplemented cells with ammonia (by adding NH4Cl), glutamate or α-KG to determine which metabolite was able to restore SREBP activation inhibited by CB-839. Western blot analysis showed that only ammonia strongly restored SREBP activation and FASN/SCD1 expression (Fig. 3c, Extended Data Fig. 3e). Immunofluorescence imaging showed that CB-839 blocked SREBP-1 nucleus translocation, which was successfully restored by adding ammonia, but not glutamate (Fig. 3d). We further examined the effects of inhibition of GLS by CB-839 on SREBP-1 activation in an H1299-derived xenograft mouse model. Consistent with the reduction of ammonia levels in tumor tissues (Extended Data Fig. 3f, left panel), immunohistochemistry (IHC) staining showed that SREBP-1 levels were significantly reduced in tumors from mice treated with CB-839 as compared to the vehicle treatment group (Extended Data Fig. 3f, right panel).
Fig. 3. Inhibiting glutaminolysis abolishes SREBP activation.
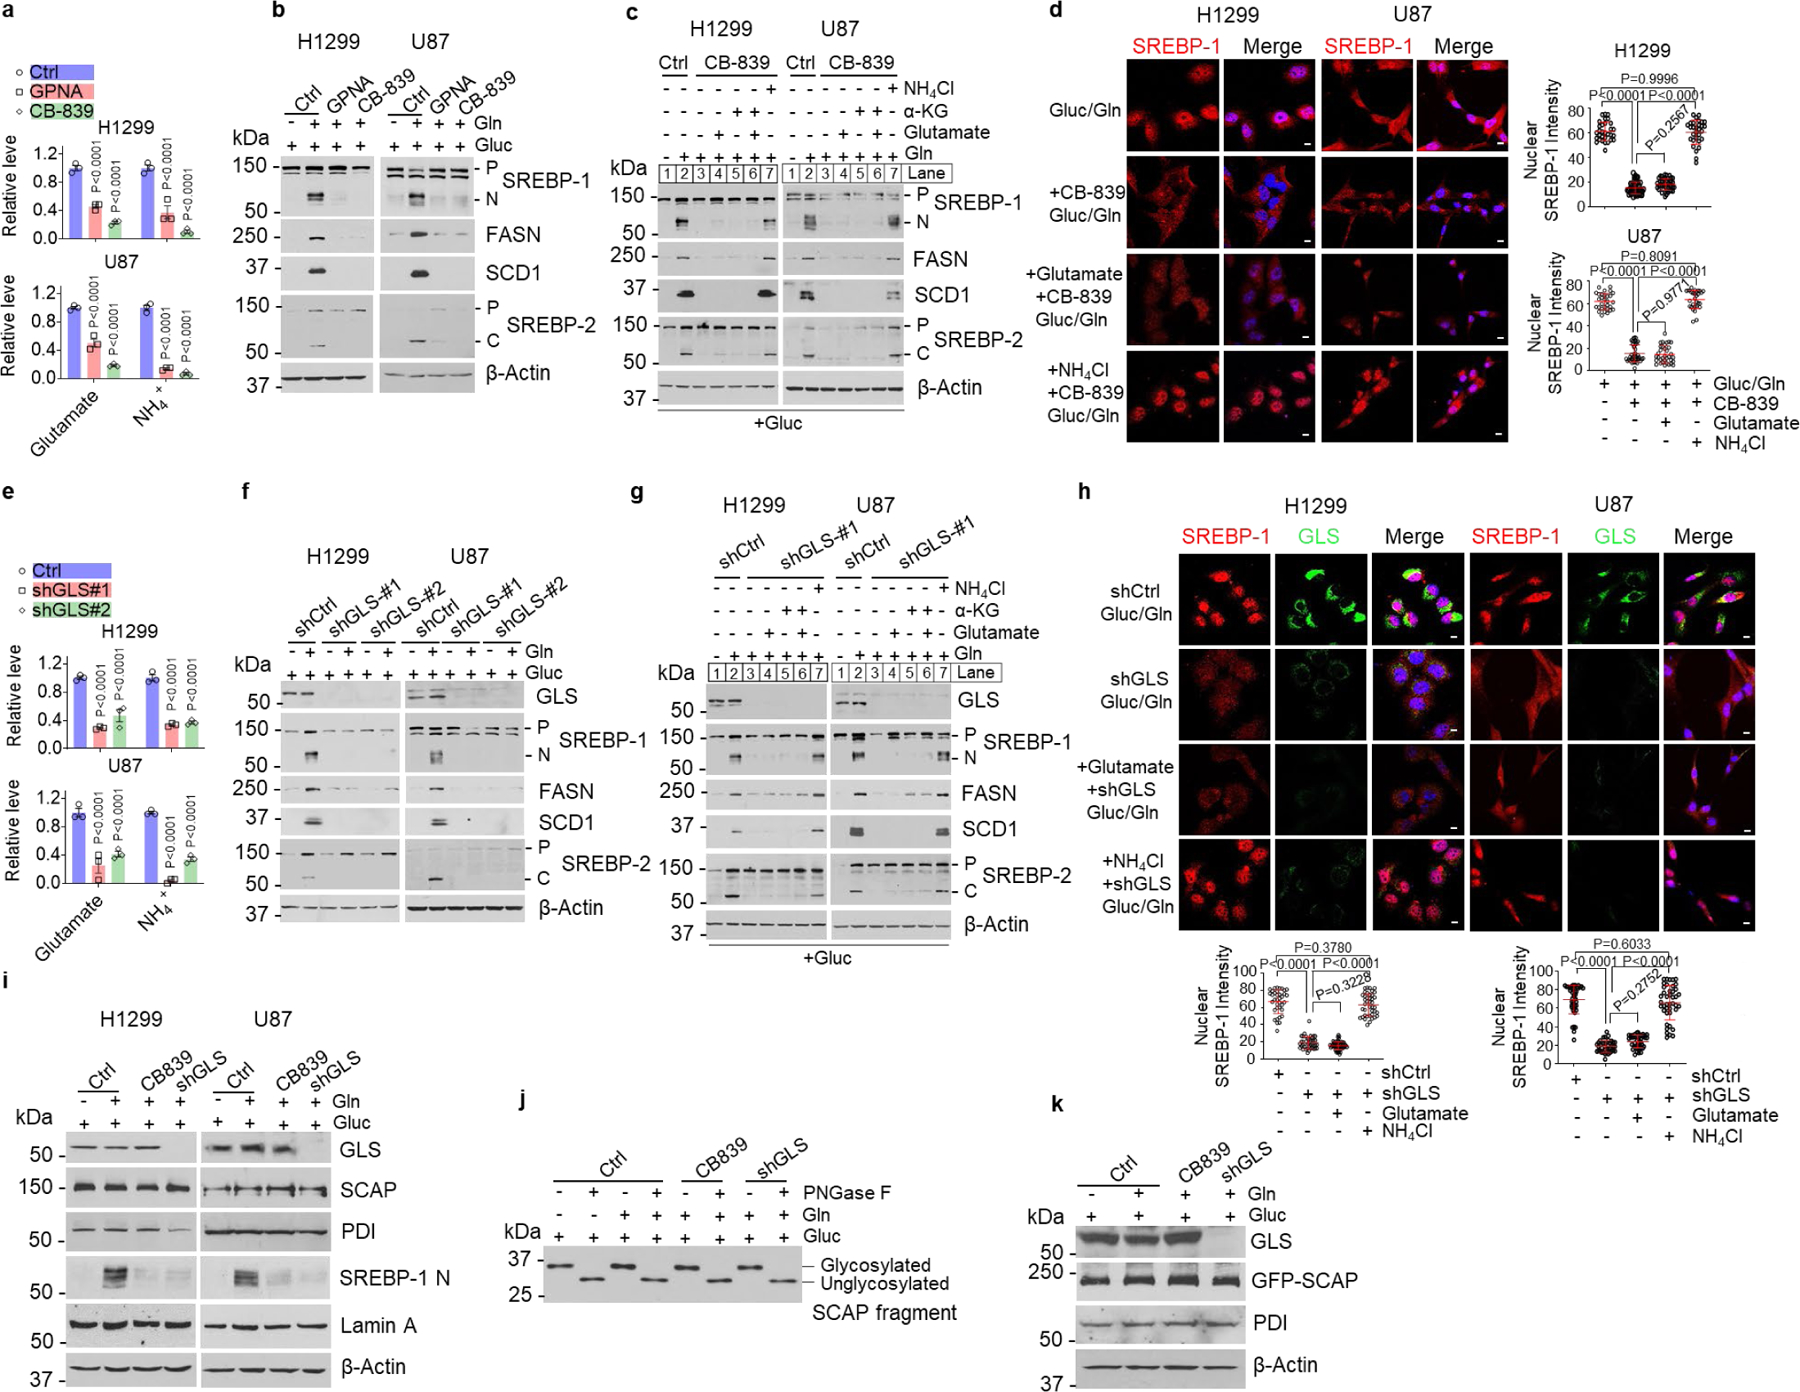
a, Relative glutamate and ammonia levels in media of cells after treatment with GPNA (5 mM) or CB-839 (100 nM) (12 hr) under serum-free medium containing 5 mM glucose and 4 mM glutamine. In following panels, all cells were placed in serum-free medium containing 5 mM glucose with/without glutamine (4 mM) prior to treatment. The results are presented as mean ± SEM (n = 3).
b, Western blot analysis of cells after treatment as in (a).
c, Western blot analysis of cells treated with CB-839 (100 nM) for 12 hr in the absence or presence of indicated metabolites (all at 4 mM).
d, Representative IF images of cells after treatment with CB-839 (100 nM) for 12 hr with/without NH4Cl (4 mM) or glutamate (4 mM). DAPI (blue). Scale bars, 10 μm. The nuclear intensity of SREBP-1 was quantified over 30 cells (mean ± SEM, n≥ 30).
e, Relative glutamate and ammonia levels in medium of cells under serum-free medium for 12 hr after shRNA knockdown of GLS (48 hr). The results are presented as mean ± SEM (n = 3).
f-g, Western blot analysis of cells cultured in serum-free medium with/without glutamine (f) or other indicated nutrients (all 4 mM) for 12 hr (g) after shRNA knockdown of GLS (48 hr) under 5% FBS condition.
h, Representative IF imaging of cells after shRNA knockdown of GLS for 48 hr and then stimulated with NH4Cl (4 mM) or glutamate (4 mM) for 12 hr under fresh serum-free medium. Scale bars, 10 μm. The nuclear intensity of SREBP-1 was quantified over 30 cells (mean ± SEM, n≥ 30).
i, Western blot analysis of cells after shRNA knockdown of GLS for 48 hr and then treated with CB-839 (100 nM) for 12 hr.
j-k, Western blot analysis of SCAP N-glycosylation (j) or GFP-SCAP (k) from HEK293T cells transfected with GFP-SCAP (24 hr) and then infected with shRNA-expressing lentivirus (24 hr), followed by CB-839 (100 nM) treatment (12 hr).
Significance was determined by two-way ANOVA with Dunnett’s (a, e) or one-way ANOVA with Turkey (d, h) multiple comparisons adjustment.
We also genetically inhibited GLS using lentivirus-mediated shRNA to suppress the release of ammonia from glutamine. GLS knockdown significantly reduced glutamine consumption and inhibited glutamate, ammonia and α-KG production (Fig. 3e, Extended Data Fig. 3g, h), and strongly suppressed SREBP activation and FASN/SCD1 expression (Fig. 3f). Supplementing ammonia, but not glutamate or α-KG, dramatically restored SREBP activation and FANS/SCD1 expression (Fig. 3g, Extended Data Fig. 3i, j), which was confirmed by immunofluorescence imaging of SREBP-1 nucleus translocation (Fig. 3h). Pharmacological and genetic inhibition of GLS also dramatically reduced the appearance of the N-terminal form of SREBP-1 in nuclear extracts (Fig. 3i), while they did not alter SCAP protein and N-glycosylation levels (Fig. 3i–k). In contrast, genetically knocking down glutamate dehydrogenase (GDH), asparaginase (ASPG) or serine deaminase (SDS) had no effects on SREBP-1 cleavage and FASN/SCD1 expression (Extended Data Fig. 3k, l).
Together, these data confirm that ammonia is released from glutamine to activate SREBPs and lipogenesis, unveiling a glutamine-GLS-ammonia-SREBP activation axis that links glutaminolysis and lipogenesis.
GLS and SREBP-1 are highly correlated in human tumors
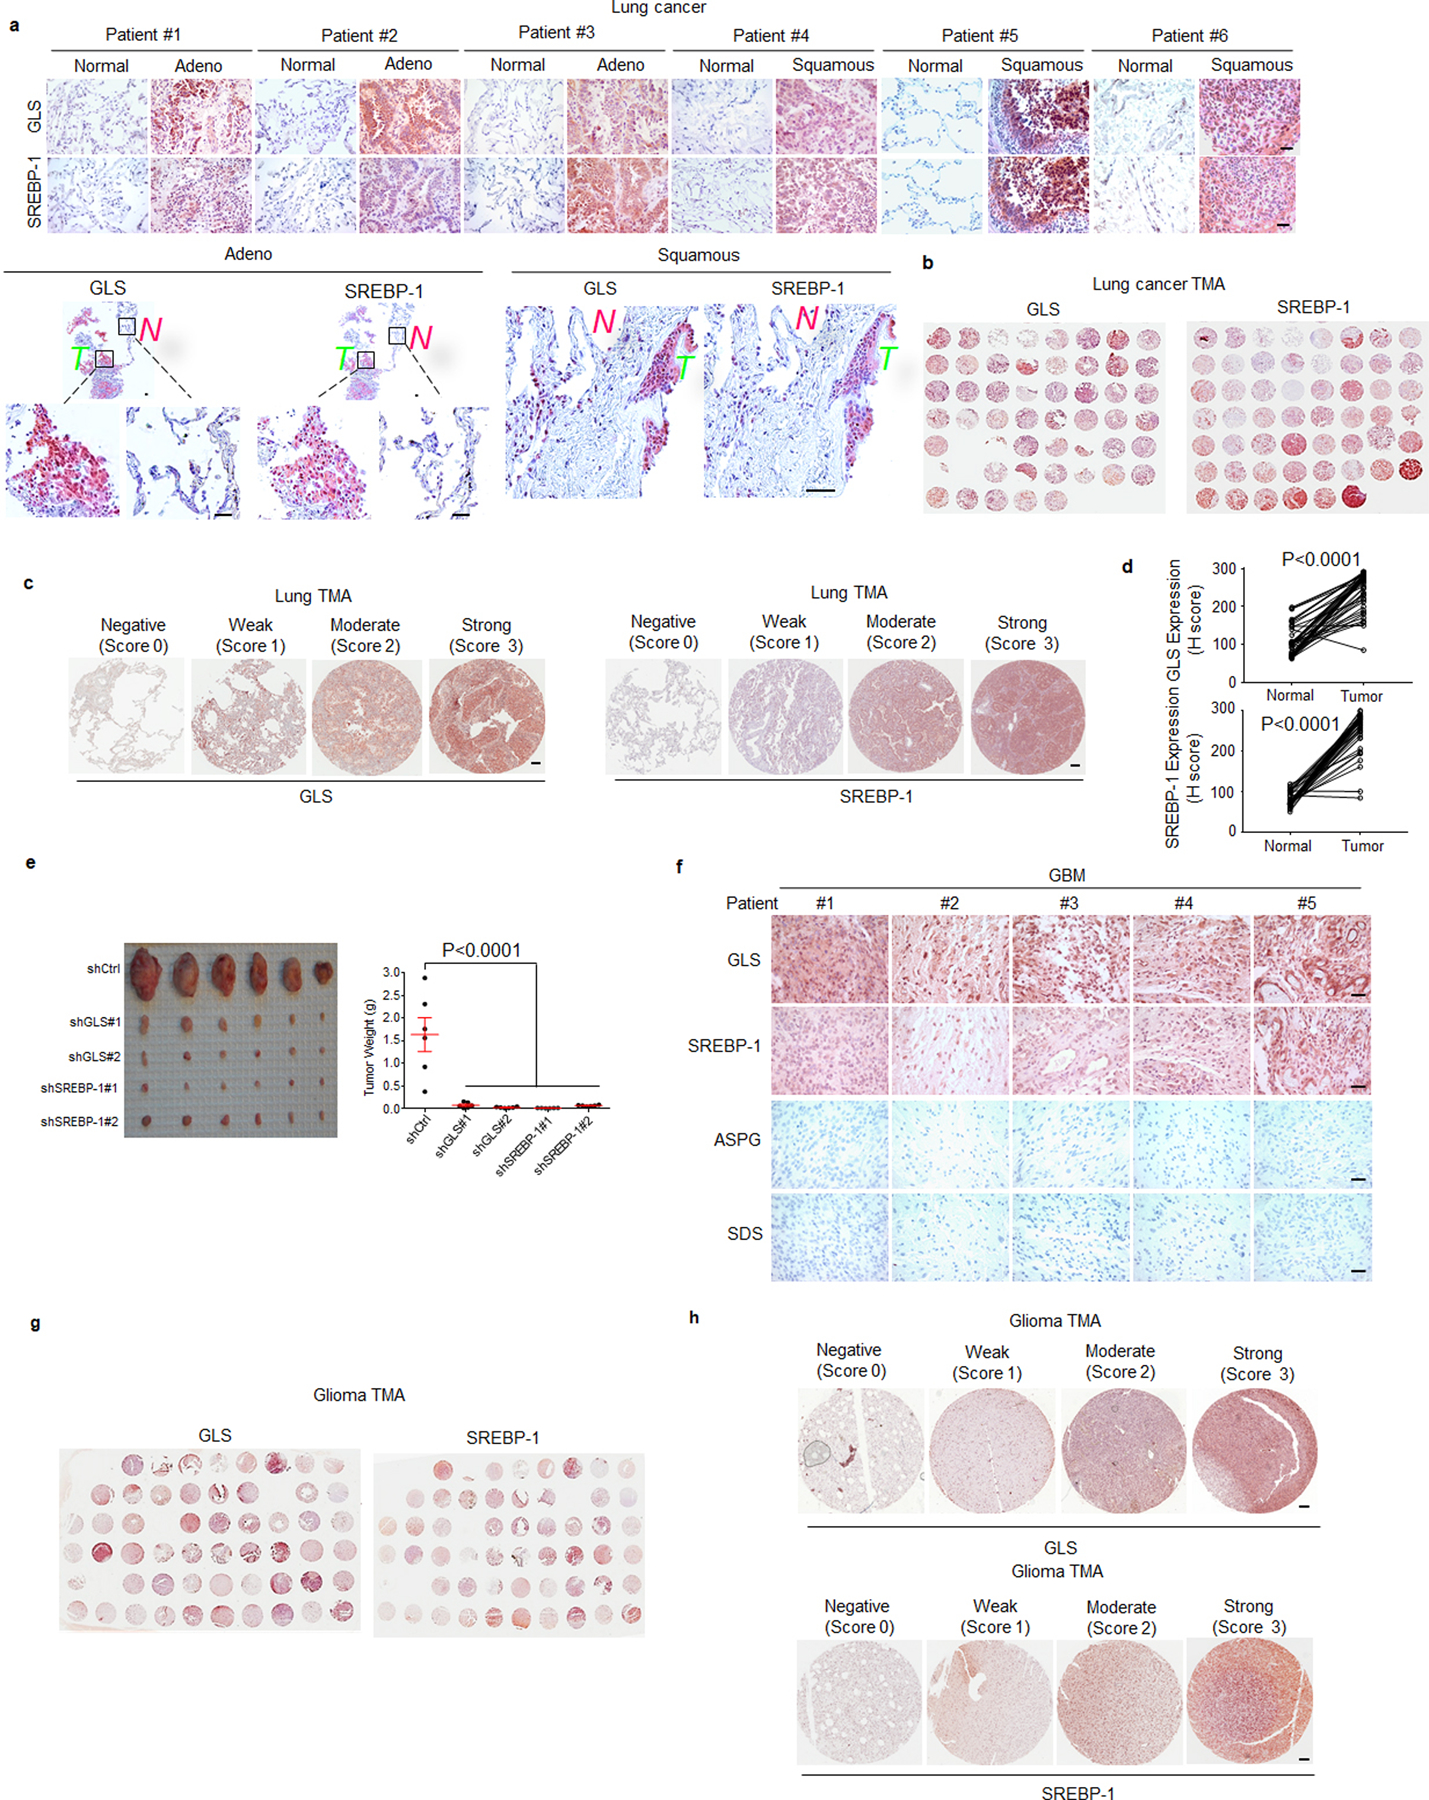
We next examined whether the connection between glutaminolysis and lipogenesis could be validated in human tissues. We first analyzed 7 paired tumors vs. adjacent normal human lung tissues, from individuals with adenocarcinoma (Adeno), squamous, and large cell lung cancer by western blot. The data showed that all 7 tumor tissues contained high levels of GLS, and strong SREBP-1 expression and cleavage, together with dramatically increased FASN protein in comparison with adjacent normal lung tissues (Fig. 4a). We then examined multiple paraffin-embedded tumor vs. adjacent normal lung tissues. IHC staining showed that GLS expression, and cytoplasmic and nuclear SREBP-1 staining were highly elevated in tumor tissues (T), while both were low in adjacent normal tissues (N) (Fig. 4b, Extended Data Fig. 4a). We then measured the ammonia levels in 10 paired lung tissues using an ammonia assay kit. Consistent with the elevation of GLS expression and SREBP-1 activation (Fig. 4a, b, Extended Data Fig. 4a), the data showed that ammonia levels were significantly higher in tumors than in paired normal tissues (Fig. 4c). We next examined a tissue microarray (TMA) containing 99 tumors and 50 matched adjacent normal lung tissues from individuals with different types of lung cancer. IHC staining showed that over 90% of lung tumor tissues contained high level of GLS and strong SREBP-1 staining as compared to adjacent normal lung tissues (Fig. 4d, e, Extended Data Fig. 4b–d). Pearson correlation analysis showed that GLS expression was strongly correlated with SREBP-1 staining (Fig. f). Genetic knockdown of GLS in a xenograft model gave the same result as SREBP-1 knockdown, dramatically suppressing tumor growth in H1299 cells-derived xenograft mouse model (Extended Data Fig. 4e).
Fig. 4. GLS and SREBP-1 are highly correlated in human tumors.
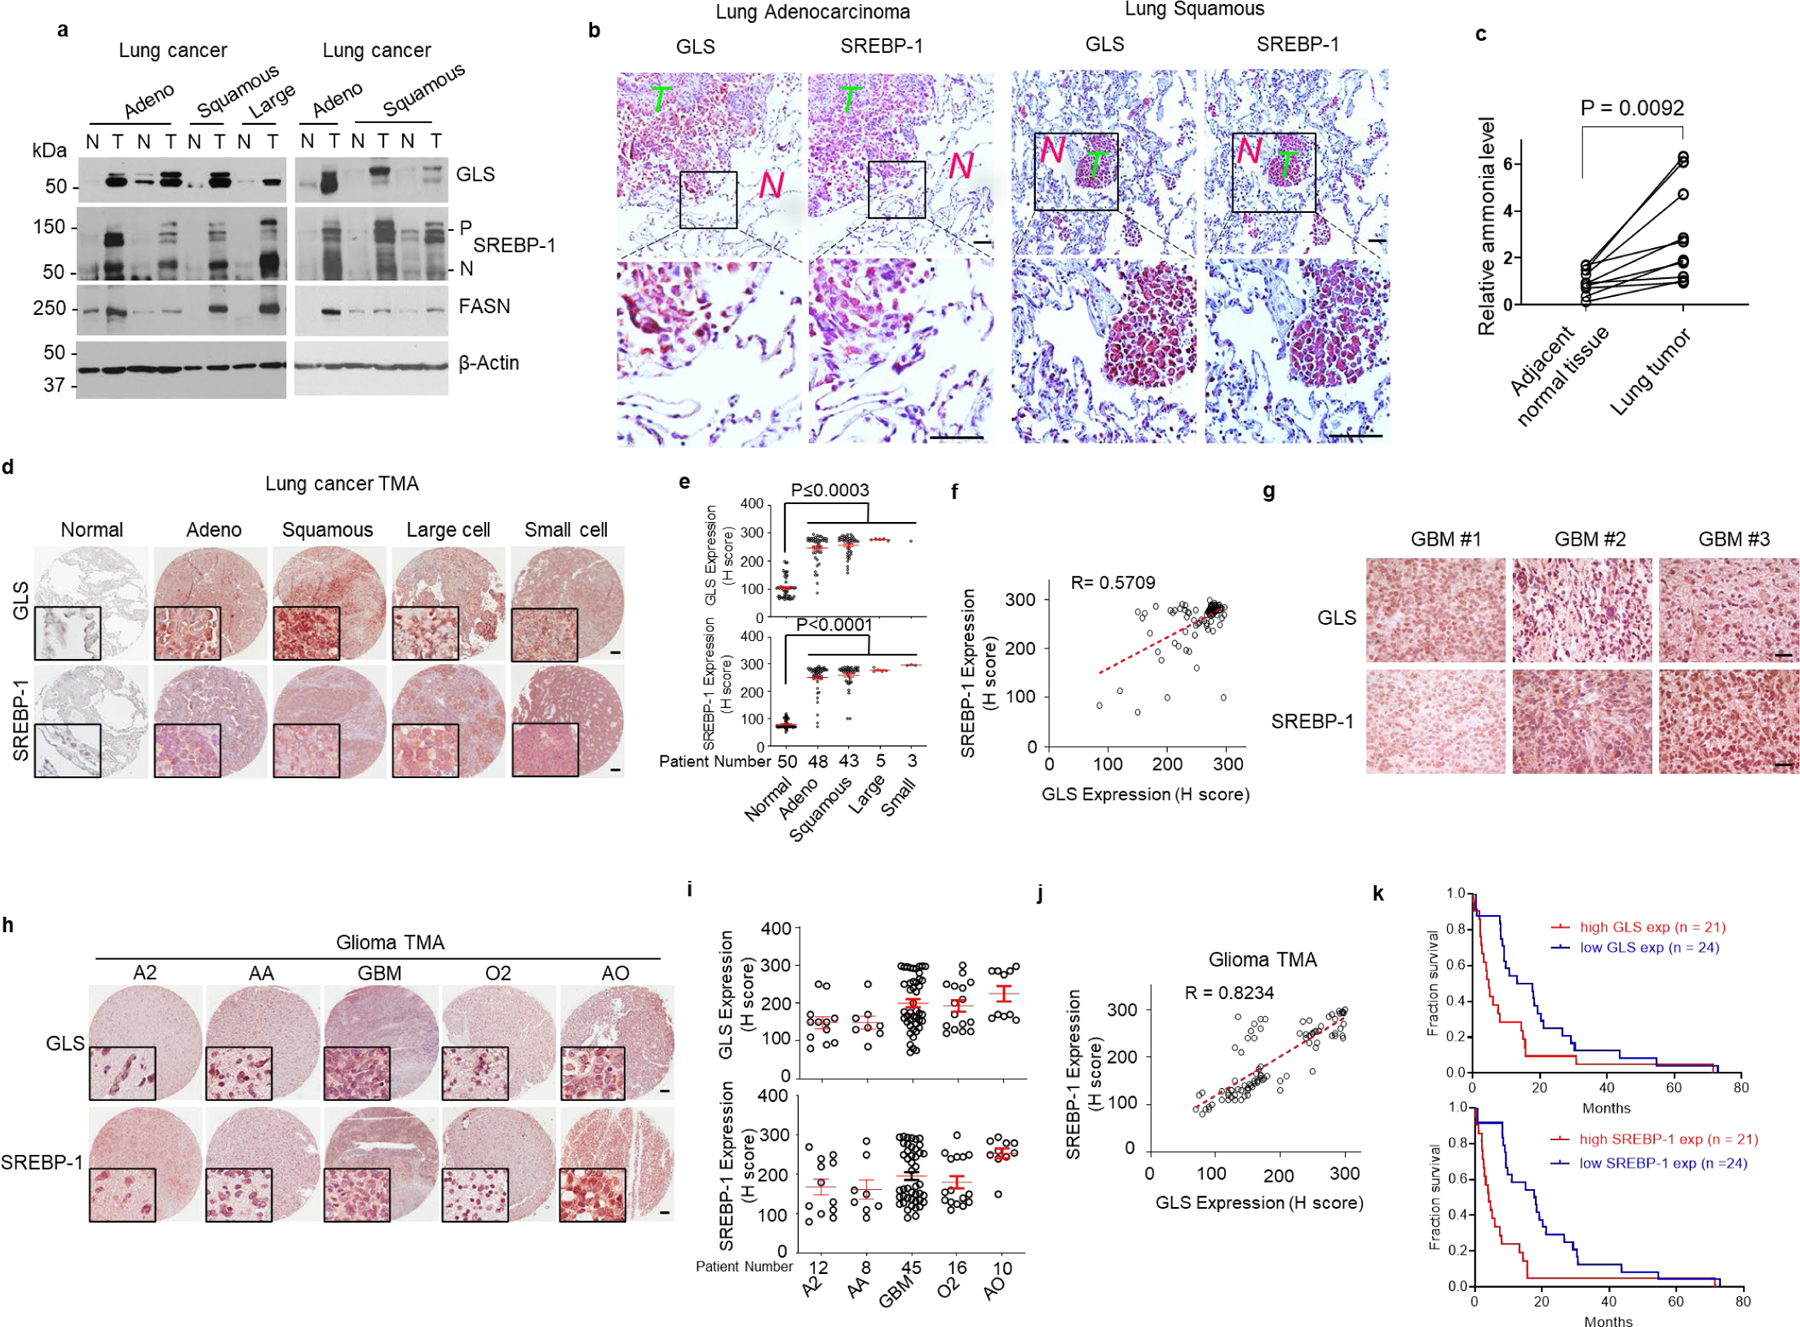
a, Western blot analysis of paired tumor (T) vs. adjacent normal (N) lung tissues from individuals with adenocarcinoma (Adeno), squamous cell carcinoma (Squamous) and large cell carcinoma (Large) lung cancer.
b, Representative immunohistochemistry (IHC) images of human tumor vs. adjacent normal lung tissues. Scale bars, 50 μm.
c, Ammonia levels in paired human lung tumors vs. adjacent normal lung tissues. Significance was determined by unpaired and two-tailed Student’s t test.
d, e, Representative IHC images of anti-GLS and -SREBP-1 staining from a lung cancer tissue microarray (TMA, n = 99) that contains 50 paired adjacent normal lung tissues (d). Scale bars, 100 μm. The levels of GLS and SREBP-1 staining were quantified by ImageJ and shown by H score (e). Red lines in the graphs show mean ± SEM. Data were analyzed by using one-way ANOVA followed by comparisons with normal control with Dunnett’s multiple comparisons adjustment.
f, Correlation between GLS and SREBP-1 levels in tissues from lung cancer TMA shown in (c). Correlation coefficient (R) and significance were determined by a two-sided Pearson correlation test. P < 0.0001.
g-i, Representative IHC images of human GBM tissues (g) or different types of glioma in a glioma TMA (n = 91) (h). Scale bars, 100 μm. GLS expression and SREBP-1 staining in TMA were quantified by ImageJ and H score (i). Red lines in the graphs show mean ± SEM (i). A2, astrocytoma grade II; AA, anaplastic astrocytoma, grade III. GBM, glioblastoma, grade IV; O2, oligodendroglioma, grade II and AO anaplastic oligodendroglioma, grade III.
j, Correlation between GLS and SREBP-1 staining in glioma TMA tissues shown in (h-i). The correlation co-efficiency and significance were determined by a two-sided Pearson’s correlation test. P < 0.0001.
k, Kaplan-Meier curves of the overall survival of individuals with GBM (n = 45) from the TMA (h), separated based on the quantification of GLS expression (mean = 199.78) or SREBP-1 levels (mean = 200.02) (i). Significance was determined by the Log-rank test. P = 0.0042 for GLS and P = 0.0001 for SREBP-1 comparison.
We also examined multiple GBM tissues and a TMA with 91 glioma samples. IHC staining showed that high GLS expression and strong SREBP-1 staining were associated in tumor tissues across low to high grade gliomas (Fig. 4g–j, Extended Data Fig. 4f–h). Kaplan-Meier plot analysis further showed that higher GLS expression and stronger SREBP-1 staining were associated with poorer survival in individuals with GBM (Fig. 4k). We also determined the presence of other amino acid deaminases, specifically ASPG and SDS by IHC. Staining showed that neither enzyme was detected in GBM tumor samples (Extended Data Fig. 4f), confirming the specific positive correlation between GLS and SREBP-1 in patient tissues.
Together, these large clinical sample analyses demonstrate that GLS expression is significantly correlated with SREBP-1 activation in human cancers, providing strong evidence in support of the molecular connection between glutaminolysis and lipogenesis under physiological conditions.
Ammonia binds SCAP to activate its dissociation from Insig
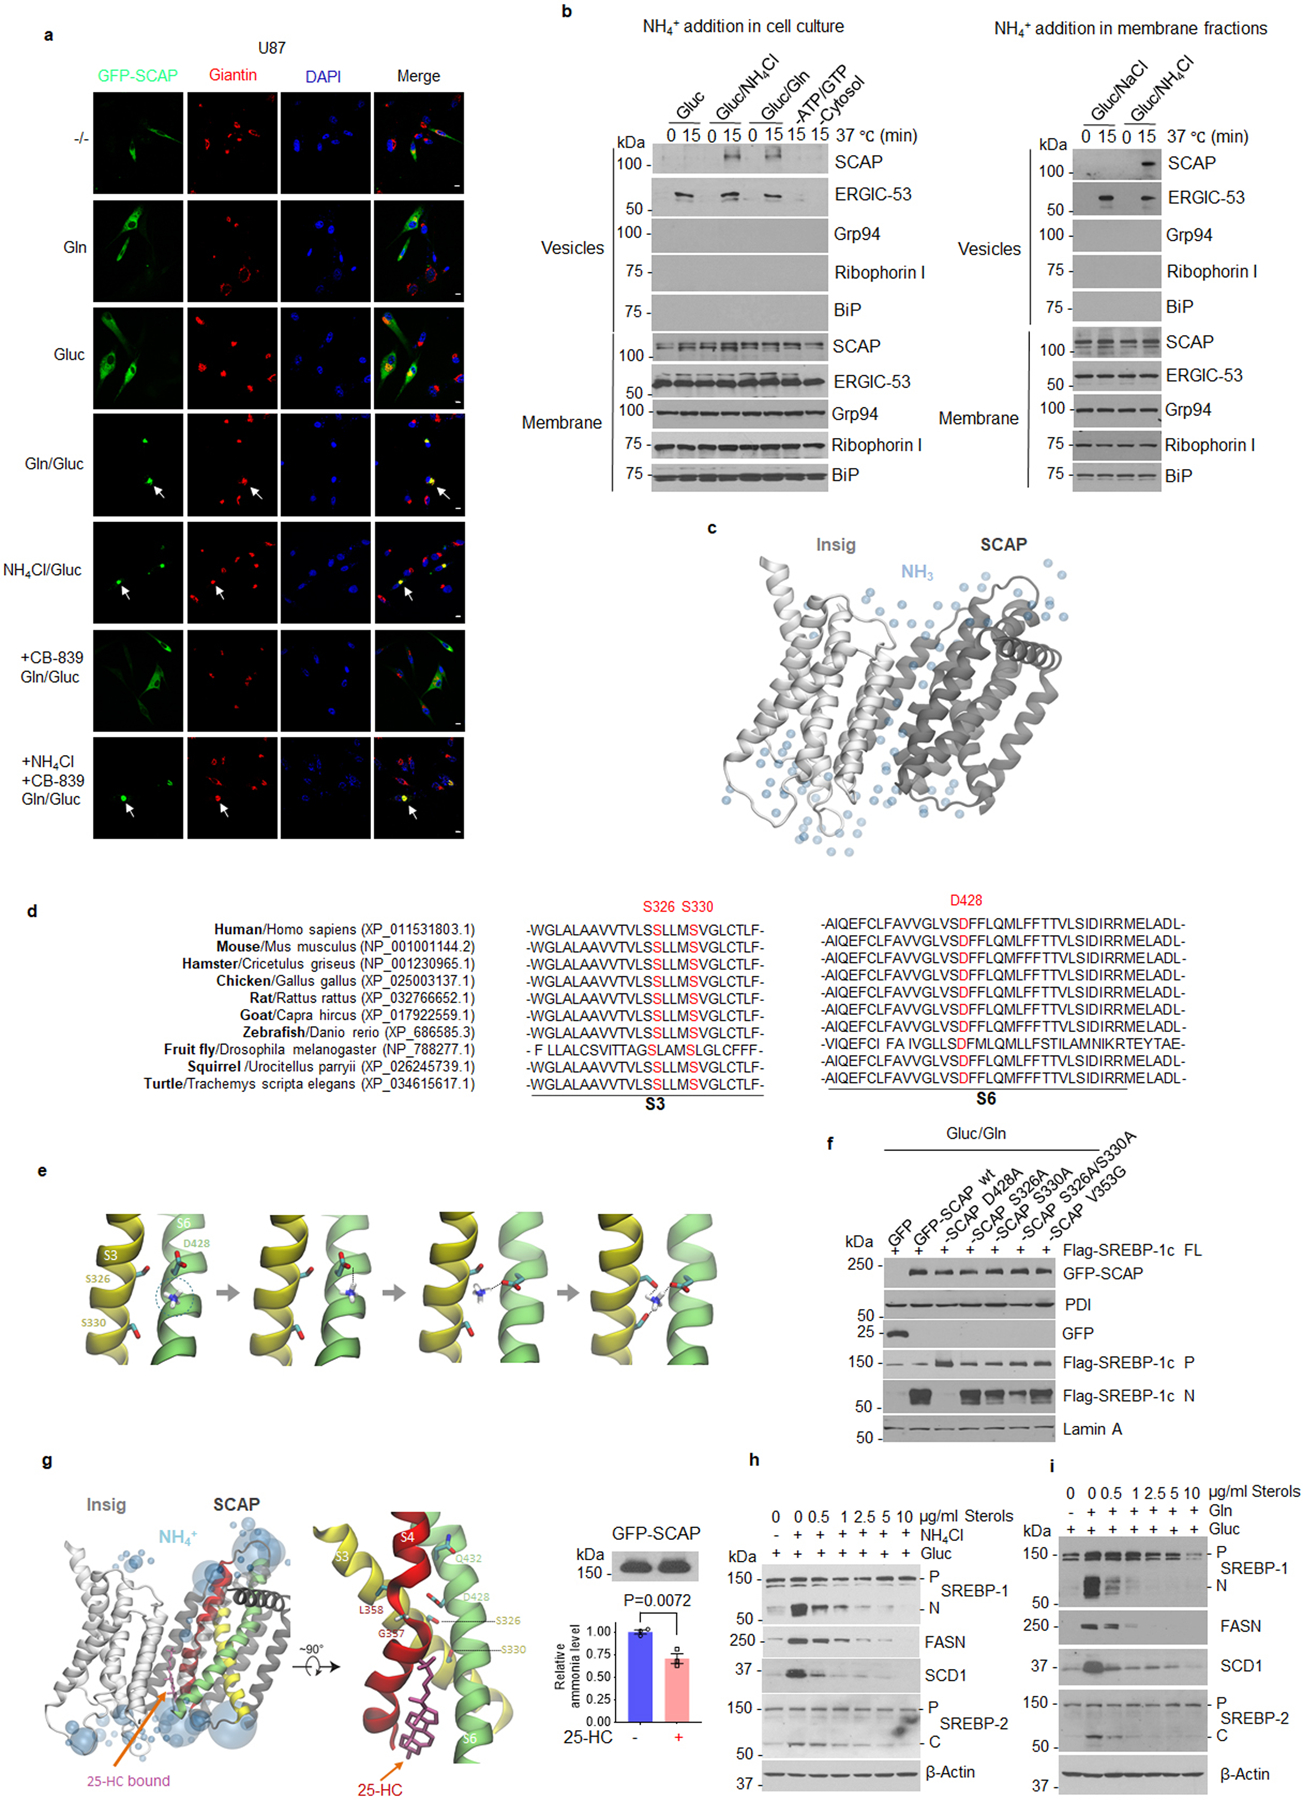
As neither glutamine nor ammonia affected SCAP stability and N-glycosylation (please see Fig. 1d, f and Fig. 2h, i), we wondered whether they activated SCAP/Insig dissociation to promote SREBP activation (Fig. 5a). We co-transfected GFP-SCAP and Myc tag-labeled Insig-1 (Myc-Insig-1) in HEK293T cells and then incubated these cells with glutamine or ammonia (NH4Cl) in the presence of glucose. Co-immunoprecipitation (co-IP) assay and western blot analysis showed that glutamine or ammonia dramatically reduced the association of SCAP and Insig-1 as compared with glucose alone (Fig. 5b). Confocal microscopy imaging showed that glutamine or ammonia stimulated GFP-SCAP trafficking to the Golgi, as demonstrated by the co-localization of GFP-SCAP with Giantin (red), a specific Golgi protein marker (please, see arrows) (Fig. 5c, Extended Data Fig. 5a). In contrast, GLS inhibition with CB-839 completely restored the binding of SCAP to Insig-1, as shown by co-IP (Fig. 5d). Confocal microscopy imaging further showed that GLS inhibition abolished glutamine-promoted GFP-SCAP trafficking to the Golgi, while the trafficking was fully restored by adding ammonia (Fig. 5e, Extended Data Fig. 5a), demonstrating that glutamine-released ammonia stimulates SCAP dissociation from Insig to trigger its trafficking.
Fig. 5. Ammonia binds SCAP to activate its dissociation from Insig.
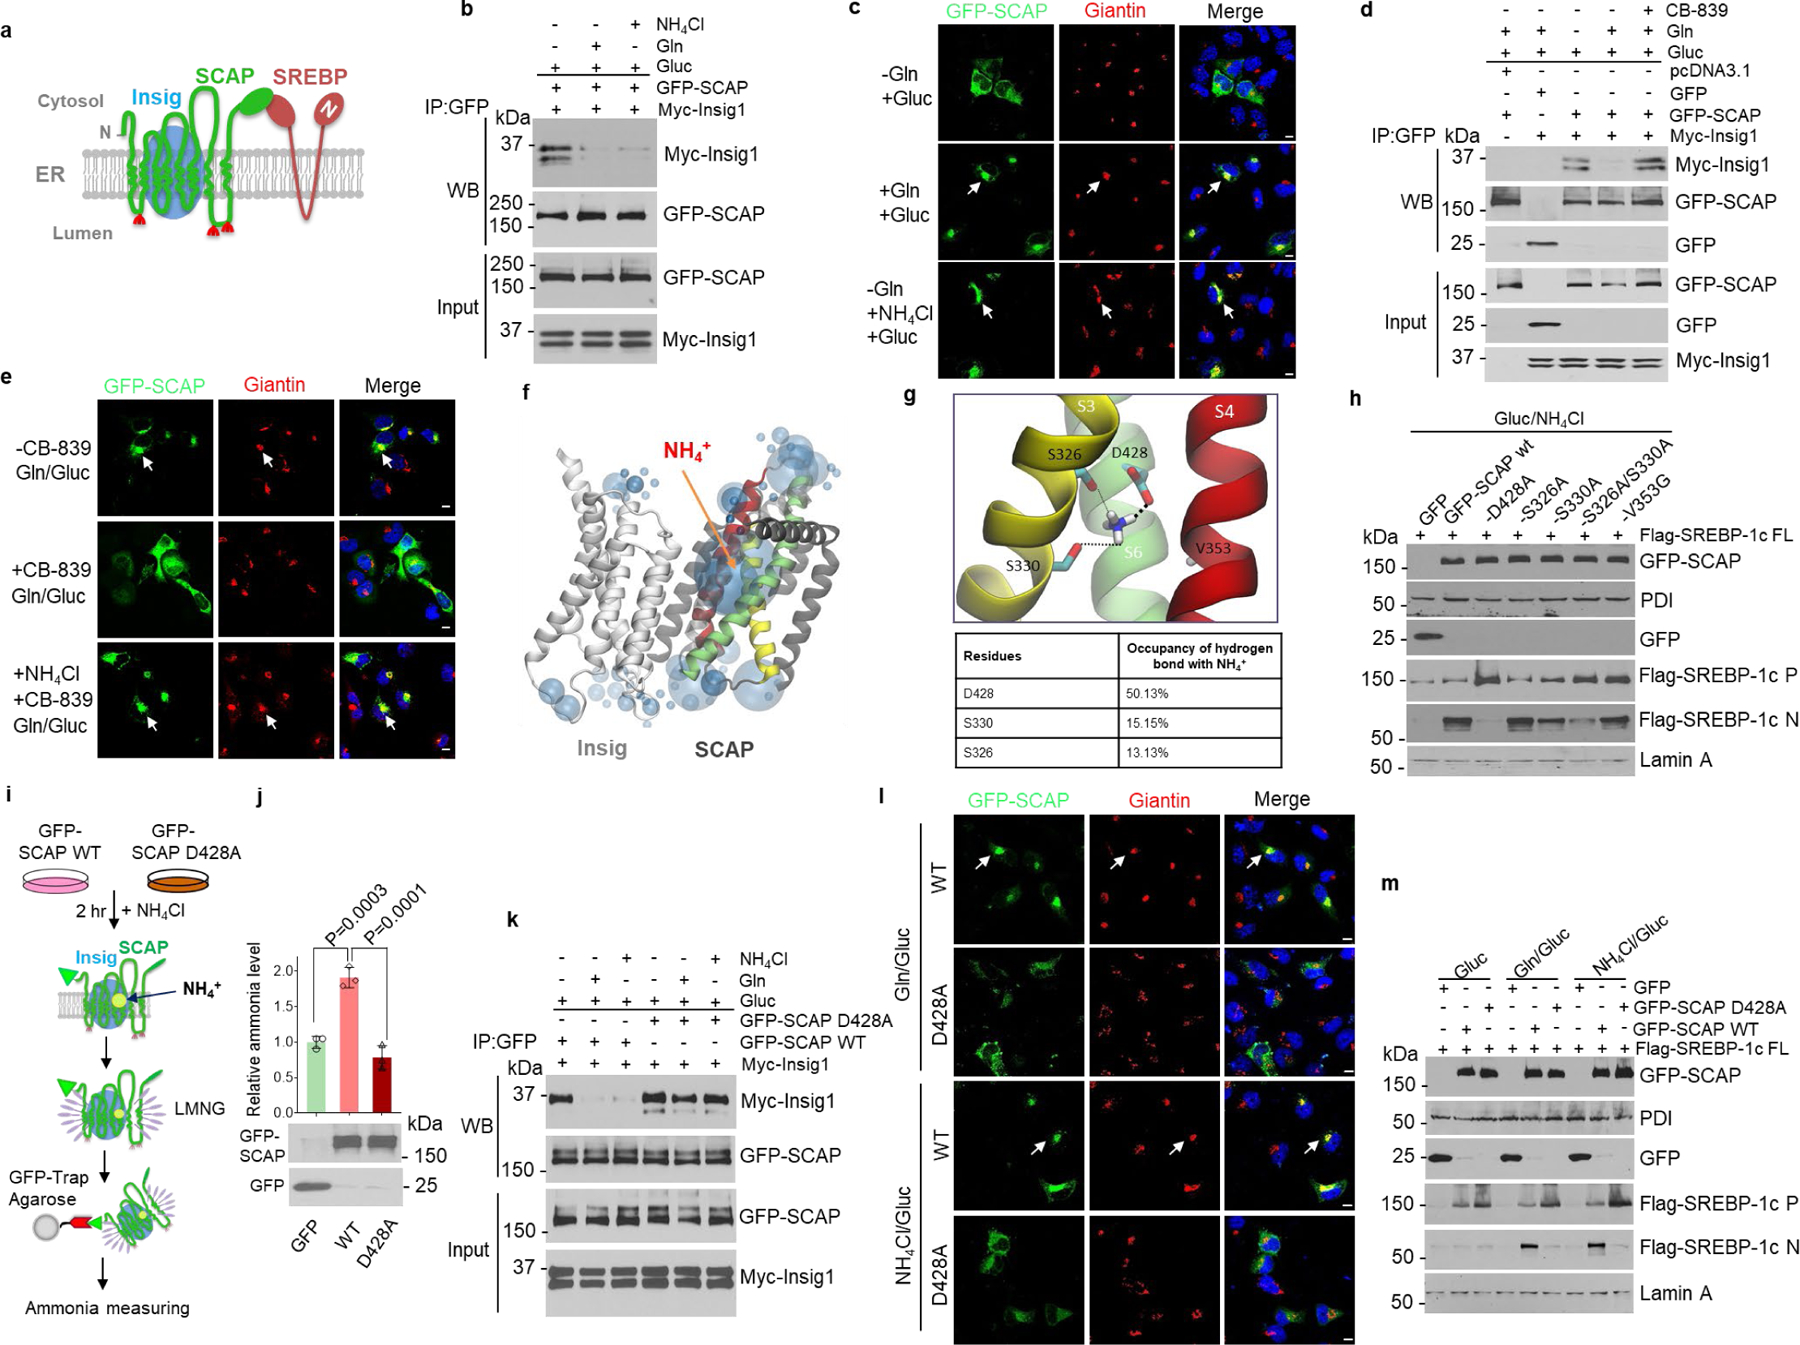
a, Scheme of Insig/SCAP/SREBP complex in the ER.
b, Co-immunoprecipitation and western blot analysis of cell lysates from HEK293T cells transfected with GFP-SCAP and Myc-Insig-1 after culturing in serum-free medium (5 mM glucose) with/without glutamine (4 mM) or NH4Cl (4 mM) for 12 hr.
c, Representative confocal images of GFP-SCAP and the IF staining of Golgi marker Giantin in H1299 cells in response to glutamine or NH4Cl (all at 4 mM) stimulation (12 hr) under serum-free medium containing 5 mM glucose. Scale bars, 10 μm.
d, Co-immunoprecipitation and western blot analysis of cell lysates from HEK293T cells transfected with GFP-SCAP and Myc-Insig-1 (24 hr) and then stimulated with/without glutamine (4 mM) and CB-839 (100 nM) for 12 hr under serum-free medium containing 5 mM glucose.
e, Representative confocal images of GFP-SCAP and Giantin in H1299 cells in response to glutamine (4 mM)/glucose (5 mM) or NH4Cl (4 mM) stimulation and CB-839 (100 nM) for 12 hr under serum-free medium. Scale bars, 10 μm.
f, g, Computational structural analysis of the ammonia-binding site on SCAP based on SCAP-Insig cryo-EM structure.
h, Western blot analysis of the effects of the predicted SCAP-NH4+ binding site (g) mutation on SREBP-1 activation in HEK293T cells stimulated with NH4Cl (4 mM) in serum-free medium (5 mM glucose) for 12 hr. P, precursor; N, N-terminal form.
i, j, Purification scheme of GFP-SCAP complex (i) from HEK293T cells for ammonia measurement with an ammonia assay kit (mean ± SEM, n = 3) (j). Western blot (bottom) shows equal proteins were purified. Significance was determined by one-way ANOVA with Dunnett’s multiple comparisons adjustment.
k, Co-immunoprecipitation and western blot analysis of the association of wild-type (WT) or mutant GFP-SCAP (D428A) with Myc-Insig-1 as in (b).
l, Representative confocal images of wild-type or mutant (D428A) GFP-SCAP in H1299 cells in response to glutamine or NH4Cl stimulation as in (k). Scale bars, 10 μm.
m, Western blot analysis of HEK293T cells transfected with indicated plasmids (24 hr),, and stimulated with glutamine or NH4Cl as in (k). FL, full-length.
To confirm the effects of ammonia on SCAP trafficking, we conducted an in vitro SCAP ER-budding assay48 where ammonia was added to cell culture or directly to purified ER membrane extracts. Western blot analysis of isolated membranes from H1299 cells and subsequent ER-budding vesicles showed that when glutamine or ammonia was absent, SCAP was unable to bud from the ER membrane into vesicles, while ammonia (NH4Cl) or glutamine strongly stimulated SCAP budding from the ER membrane (Extended Data Fig. 5b). In contrast, the budding of ER-Golgi recycling protein ERGIC-53 from the ER membrane did not require ammonia or glutamine stimulation (Extended Data Fig. 5b). Western blot analysis further showed that ammonia or glutamine stimulation did not stimulate the budding of ER-resident proteins Grp94, Ribophorin I and BiP (Extended Data Fig. 5b). Together, these data strongly demonstrate that ammonia specifically stimulates SCAP exit from the ER for subsequent translocation.
To elucidate how ammonia interacts with SCAP, we employed co-solvent molecular dynamics (MD) simulations49 to map out the potential ammonia binding sites in SCAP using the recently published cryo-EM structure of the SCAP/Insig transmembrane domain50. Interestingly, when 25-HC was absent, NH4+, not NH3, was found to occupy a large sphere in the transmembrane region next to the S6 helix of SCAP (Fig. 5f, Extended Data Fig. 5c). We closely inspected this site and found that it is formed by 3 key residues: aspartate D428 from the S6 helix, and serine S326 and S330 from the S3 helix (Fig. 5g, upper panel). Notably, D428 and S326/S330 are evolutionary highly conserved residues in SCAP (Extended Data Fig. 5d). NH4+ formed stable hydrogen bonds with the side chains of D428, S326 and S330 throughout the simulations, with the following affinities, D428 >> S330 > S326 (Fig. 5g, lower panel, Extended Data Fig. 5e). Western blot analysis confirmed these binding predictions, showing that changing the negatively charged aspartate to neutral alanine (D428A) completely abolished NH4+ or glutamine stimulation on SREBP-1 activation. The S330A mutant modestly reduced SREBP-1 activation, while the double S326A/S330A mutant strongly reduced it (Fig. 5h). In contrast, there was no effect on SREBP-1 activation when mutating valine 353 (from S4 helix) to glycine (V353G) (Fig. 5g, h, Extended data Fig. 5f). Strikingly, when 25-HC was present, computational analysis showed that the binding of NH4+ to SCAP was completely blocked (Extended Data Fig. 5g, left panel). This competition was validated by western blot, which showed that 25-HC dose-dependently reduced NH4+- and glutamine-stimulated SREBP-1 activation (Extended Data Fig. 5h, i).
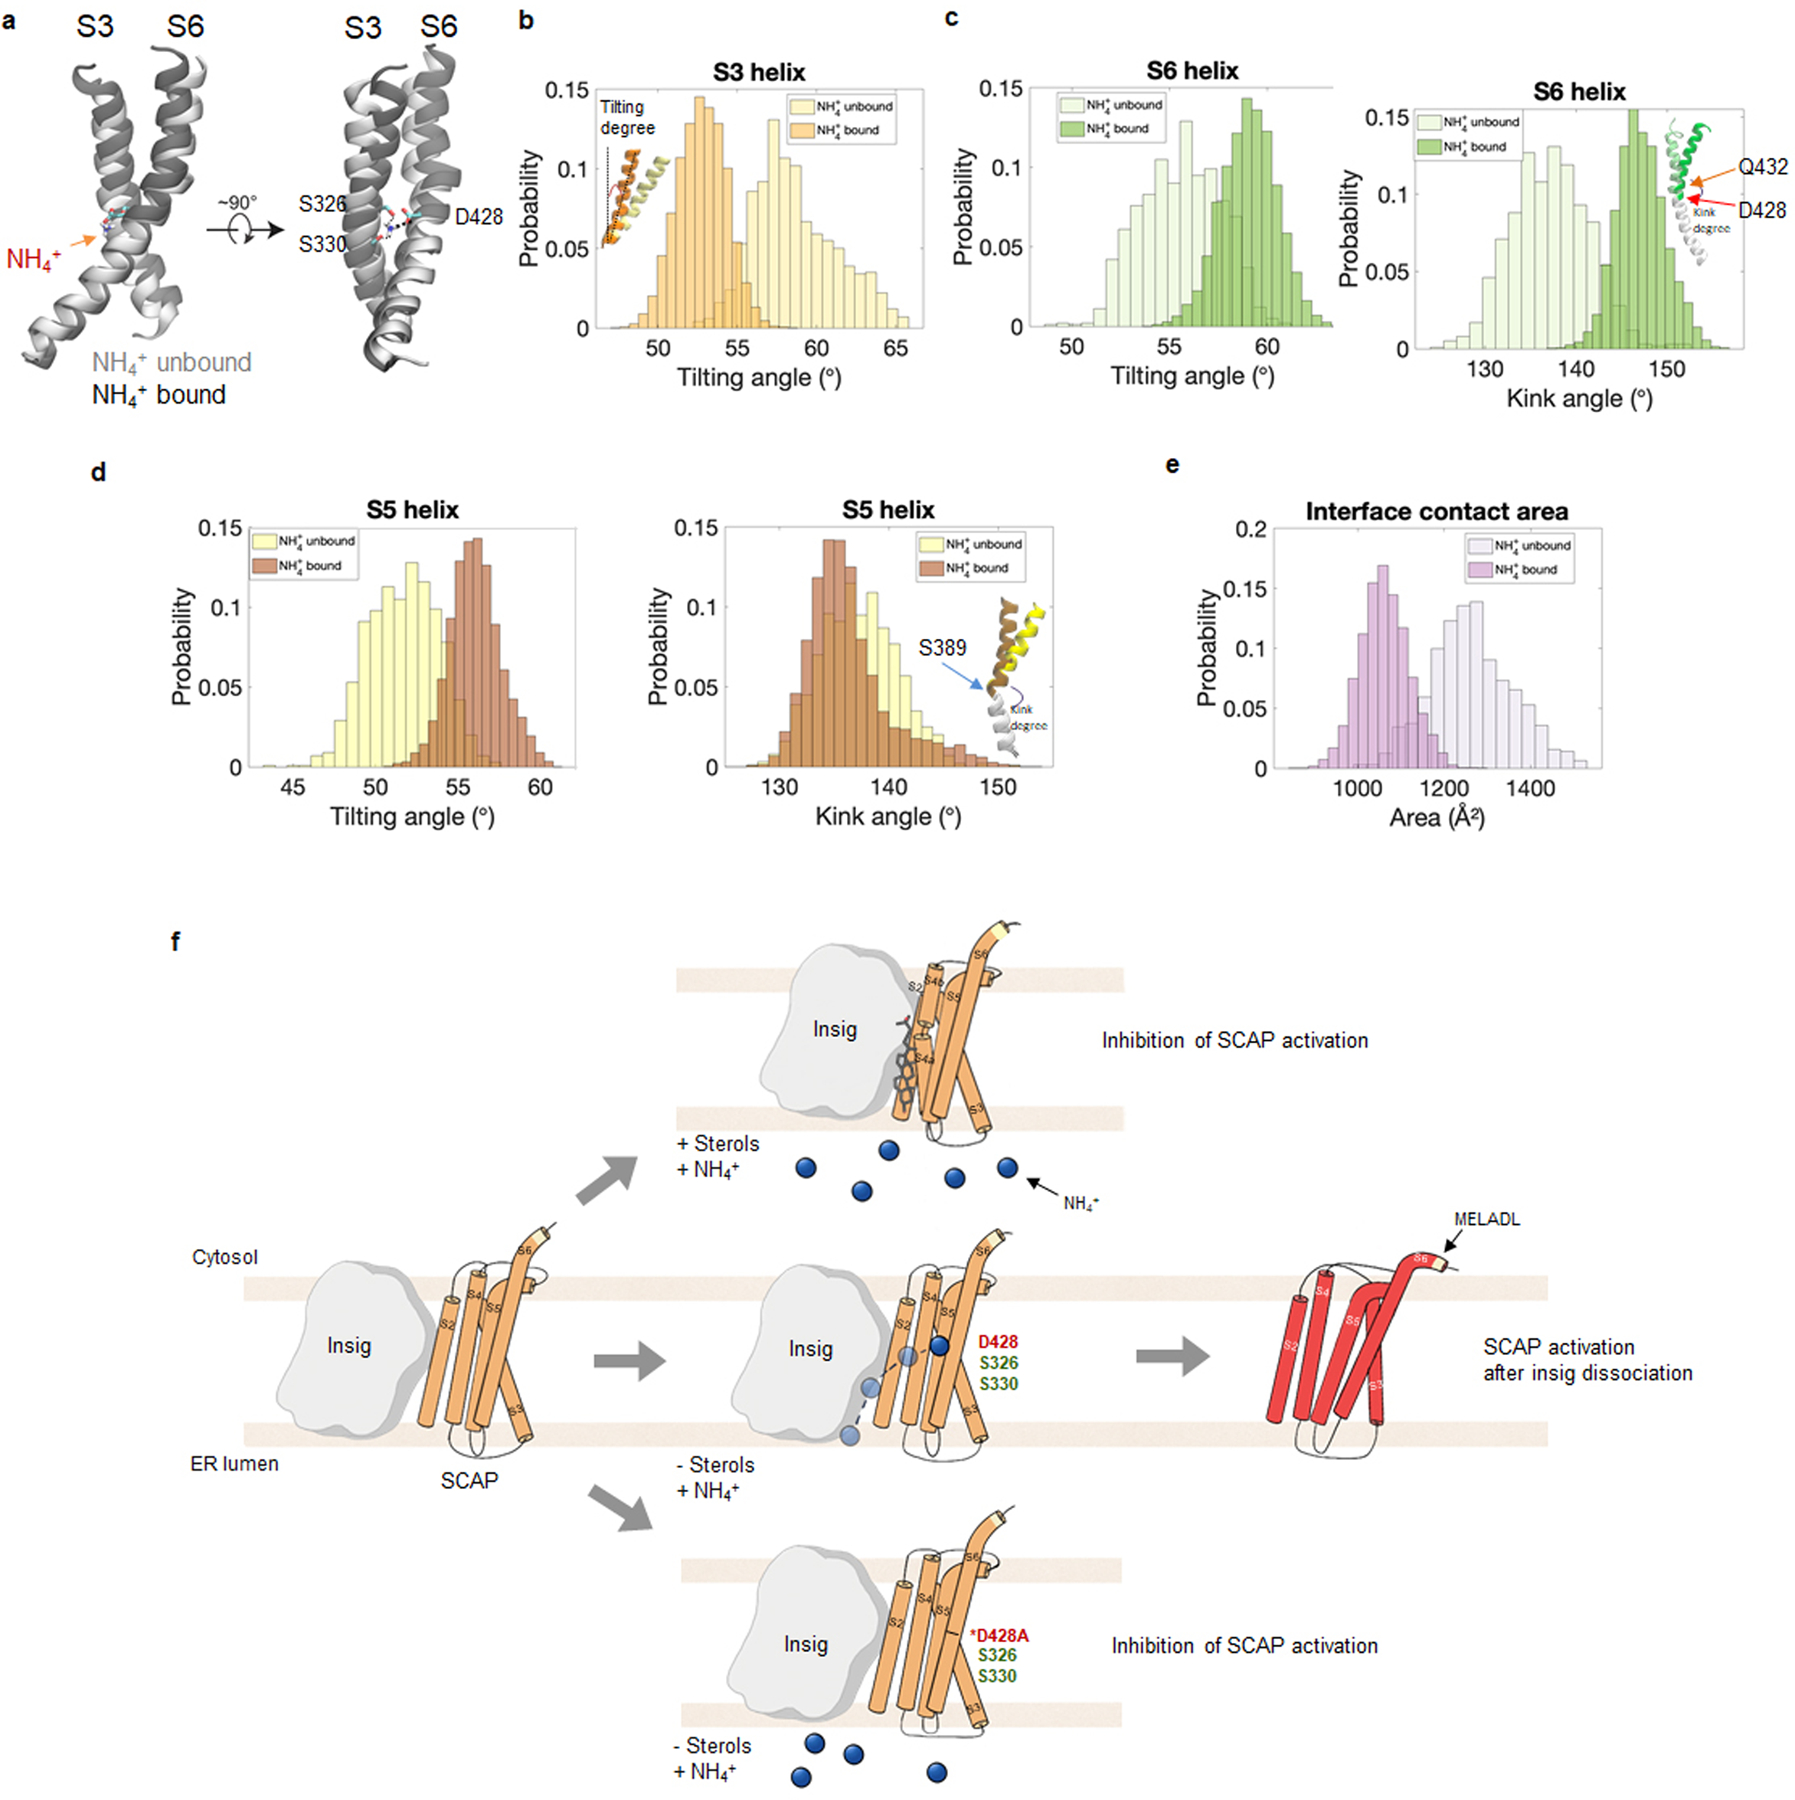
We next investigated whether NH4+ binding affects the structure and dynamics of the SCAP/Insig complex51. We clearly observed stronger coupling between the S3 and S6 helices in the NH4+ bound vs. NH4+ unbound simulations (Extended Data Fig. 6a–c). Larger tilting was also observed in the S5 transmembrane helix (Extended Data Fig. 6d). Together, these conformational rearrangements triggered by NH4+ binding resulted in a marked decrease in the interface contact area between SCAP and Insig (Extended Data Fig. 6e, f). Furthermore, in the presence of NH4+, the S6 helix was found to be more kinked at glutamine (Q) 432 (Extended Data Fig. 6c, right panel). The orientational and conformational alterations of S6 induced by NH4+ binding led to a change in the relative position of the MELADL, the critical COPII protein binding motif containing 6 amino acids in SCAP52, towards the membrane (Extended Data Fig. 6f), which might facilitate the binding of SCAP to COPII proteins and translocation of SCAP from the ER to the Golgi (Detailed computational analyses please see Supplementary Information, Result section).
To validate our computational analysis results, we compared ammonia binding to GFP-SCAP wild-type (wt) and to its D428A mutant after purifying these proteins from cell membranes (please, see Fig. 5i, j). The results showed that the level of ammonia bound to GFP-SCAP wt was ∼2 fold higher than that to the control GFP protein, while the D428A mutation abolished the binding and returned the ammonia level to that seen with the control GFP (Fig. 5j). 25-HC addition significantly reduced the binding of ammonia to GFP-SCAP wt (Extended Data Fig. 5g, right panel), demonstrating that the presence of 25-HC blocks the binding of ammonia to SCAP (Extended Data Fig. 5g, left panel).
We next examined whether D428A mutation could abolish glutamine- and ammonia-triggered dissociation of SCAP from Insig. Co-IP data showed that the D428A mutation abolished the glutamine- and ammonia-mediated activation of SCAP dissociation from Insig-1 (Fig. 5k). Accordingly, GFP-SCAP trafficking to the Golgi stimulated by glutamine or ammonia was also abolished by the D428A mutation (Fig. 5l, Extended Data Fig. 7a). Moreover, the D428A mutation blocked glutamine- and ammonia-promoted SREBP-1a, -1c and -2 activation as compared with wild-type SCAP transfection (Fig. 5m, Extended Data Fig. 7b, d, e). In addition, changing the D428 residue to glutamate (D428E), asparagine (D428N) or lysine (D428K) led to the same inhibitory effects (Extended Data Fig. 7c), highlighting the importance of D428 to ammonia stimulation.
Together, our experimental data plus the computational structural analyses reveal that ammonia stimulates SCAP dissociation from Insig by inducing conformational changes in the SCAP transmembrane domain via its interaction with the D428, S326 and S330 residues, eventually leading to SCAP/SREBP translocation and activation. D428A mutation abolishes ammonia binding to SCAP, thereby retaining association with Insig even under low sterol conditions. 25-HC blocks ammonia to reach its binding site, thereby suppressing SCAP/Insig dissociation and SREBP activation (Extended Data Fig. 6f).
Disrupting ammonia-SCAP interaction suppresses tumor growth
We next examined whether disrupting ammonia-SCAP interaction by changing D428 to alanine (D428A) in SCAP could affect tumor growth. GFP, GFP-SCAP wild-type or D428A mutant were transfected into H1299 lung cancer cells that stably express luciferase. Western blot analysis showed that wild-type SCAP dramatically increased SREBP-1 and -2 cleavage, which was abolished by the D428A mutation (Fig. 6a). These stably transfected cells were implanted into mice, and bioluminescence imaging showed at day 50 post-implantation via tail vein injection that wild-type SCAP dramatically increased tumor growth in the lung area as compared to the control GFP group, while the D428A mutation abolished this increase (Fig. 6b, c). Gross lung images showed higher numbers of tumor lesions on the lung surfaces in the wild-type SCAP group than GFP and D428A mutant groups (Fig. 6d, left panels, Extended Data Fig. 8a). Hematoxylin and eosin (H&E) staining confirmed the dramatically increased number of tumor lesions in the lungs of wild-type SCAP group (Fig. 6d, e, Extended Data Fig. 8b). IHC staining showed that SREBP-1 was significantly elevated in lung tumor tissues in the wild-type SCAP group as compared with the GFP group, while this increase was abolished by the D428A mutation (Fig. 6d, e).
Fig. 6. Disrupting ammonia-SCAP interaction suppresses tumor growth.
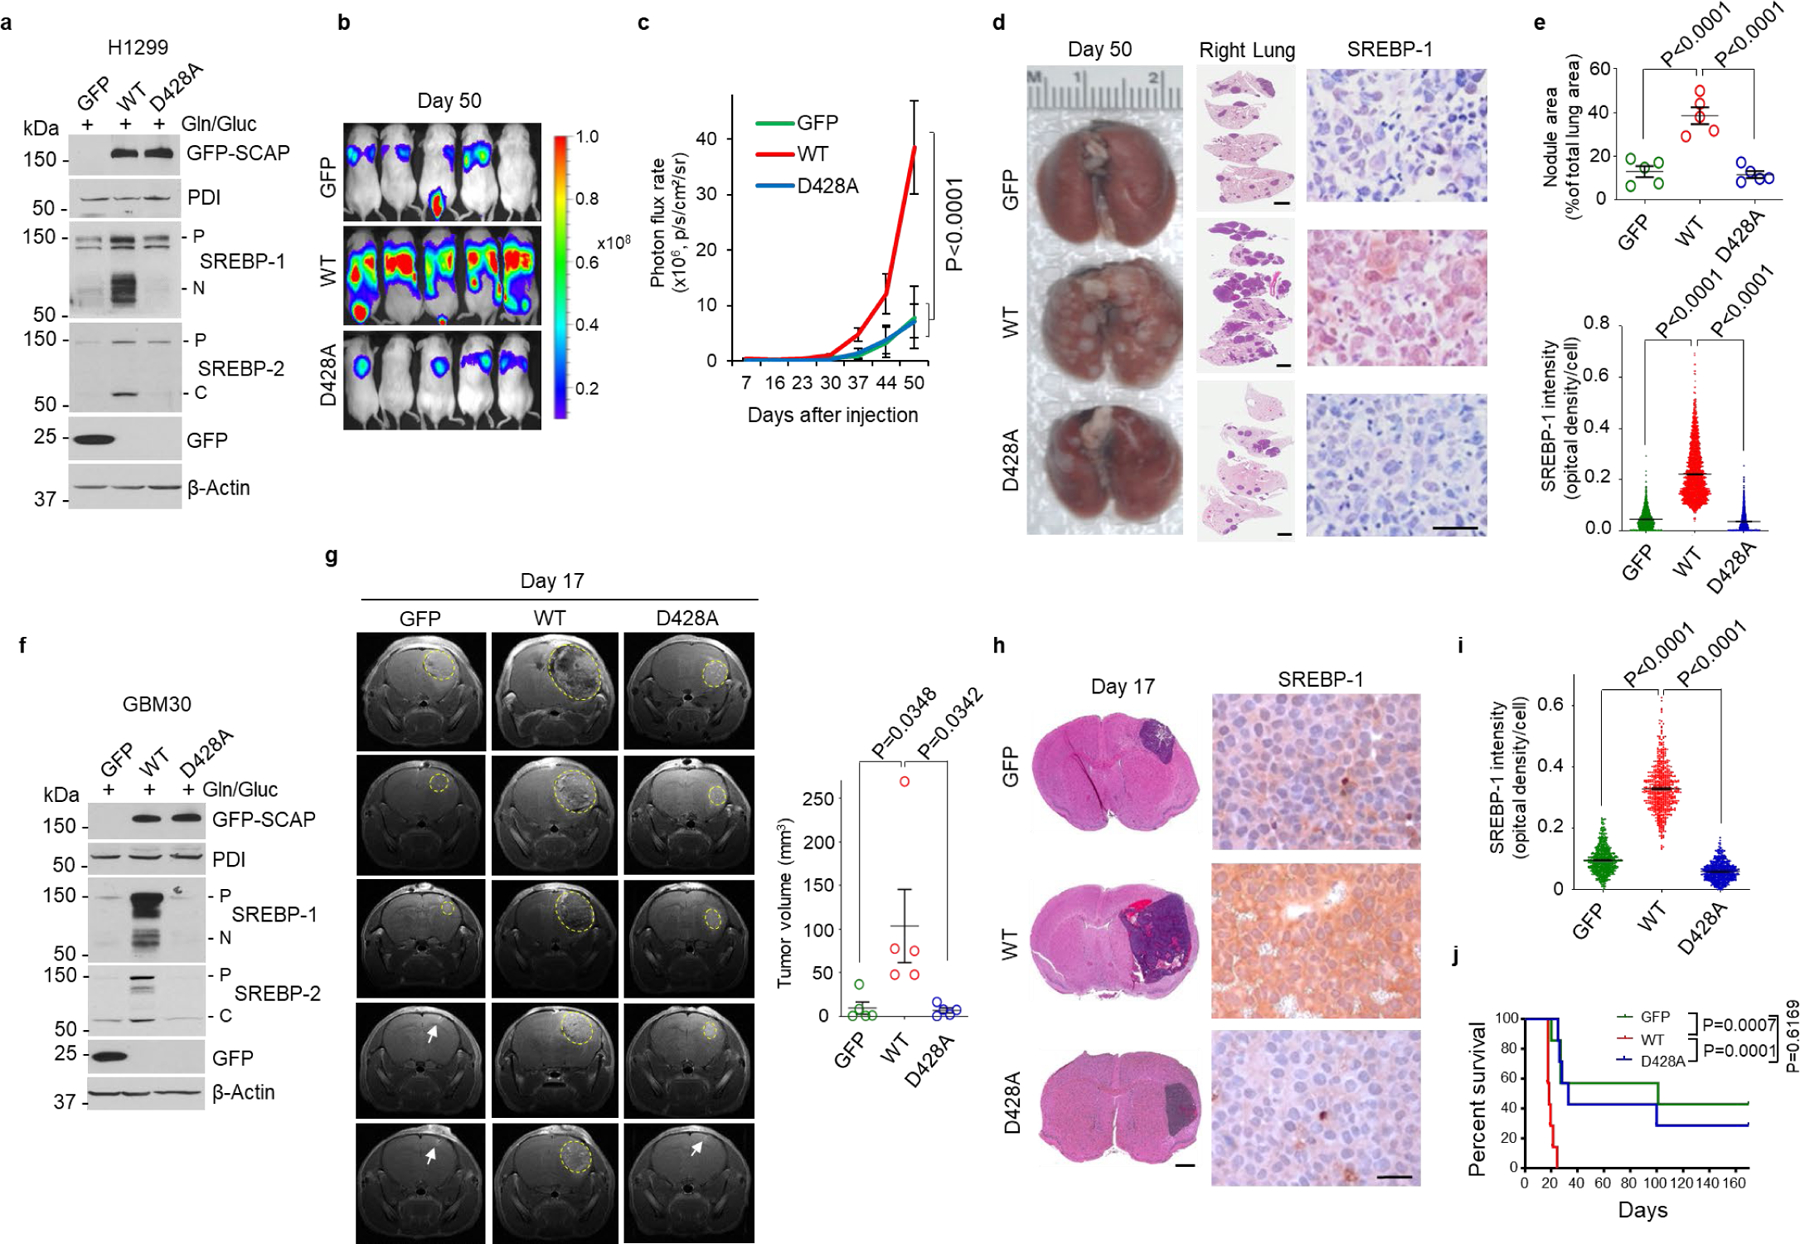
a-c, The effects of GFP-SCAP wild-type or mutant D428A compared to GFP control on SREBP-1 and -2 cleavage in H1299 cells as analyzed by western blot (a), and on lung tumor growth as analyzed in mice (1 × 10⁶ cells/mouse) by bioluminescence imaging at day 50 after implantation via tail vein injection (b). Tumor growth rate from day 7 to 50 was quantified by bioluminescence imaging (mean ± SD, n = 5) (c).
d, e, Representative gross images (left panels) and lung sections (right panels) of mouse lungs after hematoxylin and eosin (H&E) staining (middle panels; Scale bars, 2 mm), and of IHC staining of SREBP-1 in tumor tissues (right panels; scale bars, 50 μm) from the different groups shown in (b) at day 50 after implantation. The percentage of tumor nodules occupied per total lung area (upper panel) (mean ± SEM, n = 5 mice) and the intensity of SREBP-1 staining in tumor cells (lower panel) were quantified by ImageJ (mean ± SEM, n > 2000 cells) (e).
f-j, The effects of GFP-SCAP wild-type or mutant D428A compared to GFP control on SREBP-1 and -2 cleavage in primary GBM30 cells analyzed by western blot (f), and on intracranial tumor growth as analyzed in mice (3.5 × 10³ cells/mouse) by magnetic resonance imaging (MRI) (yellow circles). The white arrows indicate the injection sites (g). Brain sections were stained with H&E (left panels; scale bars, 1 mm), and IHC for SREBP-1 (right panels, scale bars, 50 μm) (h). Nuclear SREBP-1 staining in tumor tissues was quantified by ImageJ (i). Mouse survival was assessed by Kaplan-Meier plot (n = 7/group) (j).
Tumor volume (g) are presented as mean ± SEM (n = 5). Significance was determined by one-way ANOVA (e, g, and i) or two-way ANOVA (c) with Dunnett’s multiple comparisons adjustment. Significance in (j) was determined by Log-rank test.
We repeated those experiments with primary GBM30 cells (Fig. 6f)53–55. The stably transfected GBM cells were implanted into mice brains and tumor growth was examined by magnetic resonance imaging (MRI). The imaging showed that the tumor volume in the wild-type SCAP group was dramatically greater than in the control GFP and D428A mutation groups (Fig. 6g, Extended Data Fig. 8c). H&E staining confirmed that the tumor sizes in the different groups on Day 17 were consistent with those detected by MRI imaging (Fig. 6h, left panels, Extended Data Fig. 8d). IHC staining showed much stronger SREBP-1 staining in the wild-type SCAP group than in the other two groups (Fig. 6h, i). Moreover, the mice implanted with wild-type SCAP expressing cells had significantly shorter survival time than other two groups (Fig. 6j).
Together, these data demonstrate that disrupting the ammonia-SCAP interaction by mutating the D428 residue significantly suppresses SREBP-1 activation and tumor growth.
Discussion
SREBPs are spatially restricted to the ER membrane after synthesis6,8. The mechanisms triggering the exit of SREBPs from the ER have so far remained unclear. In this study, we uncovered an unprecedented role of ammonia released from glutamine, which acts as a key activator to trigger N-glycosylated SCAP dissociation from Insig by inducing dramatic conformational changes in the SCAP transmembrane domain through interaction with the D428, S326 and S330 residues, leading to SREBP activation and lipid synthesis (Fig. 5g, Extended Data Fig. 6f, Fig. 7). We also provided physiological evidence for the connection between glutaminolysis and lipogenesis by showing the molecular link between GLS expression and SREBP-1 activation in human lung cancer and glioma tissues. Moreover, our study demonstrated that the activation of SREBPs and lipogenesis by glutamine/ammonia also occurs in melanoma, liver and breast cancer cells in addition to lung cancer and GBM, suggesting that this is a common mechanism at play in a wide range of cancer types. We further unveiled the competitive role of 25-HC that blocks ammonia binding to SCAP, thereby retaining SCAP/Insig association and suppressing SREBP activation. Altogether, our study revealed an unanticipated role for ammonia in the regulation of SCAP/Insig dissociation, SREBP activation and lipid metabolism, and identified SCAP as the critical sensor connecting glutamine, glucose and lipid metabolism to promote tumor growth.
Fig. 7. Model of ammonia activating SCAP/SREBP and lipogenesis.
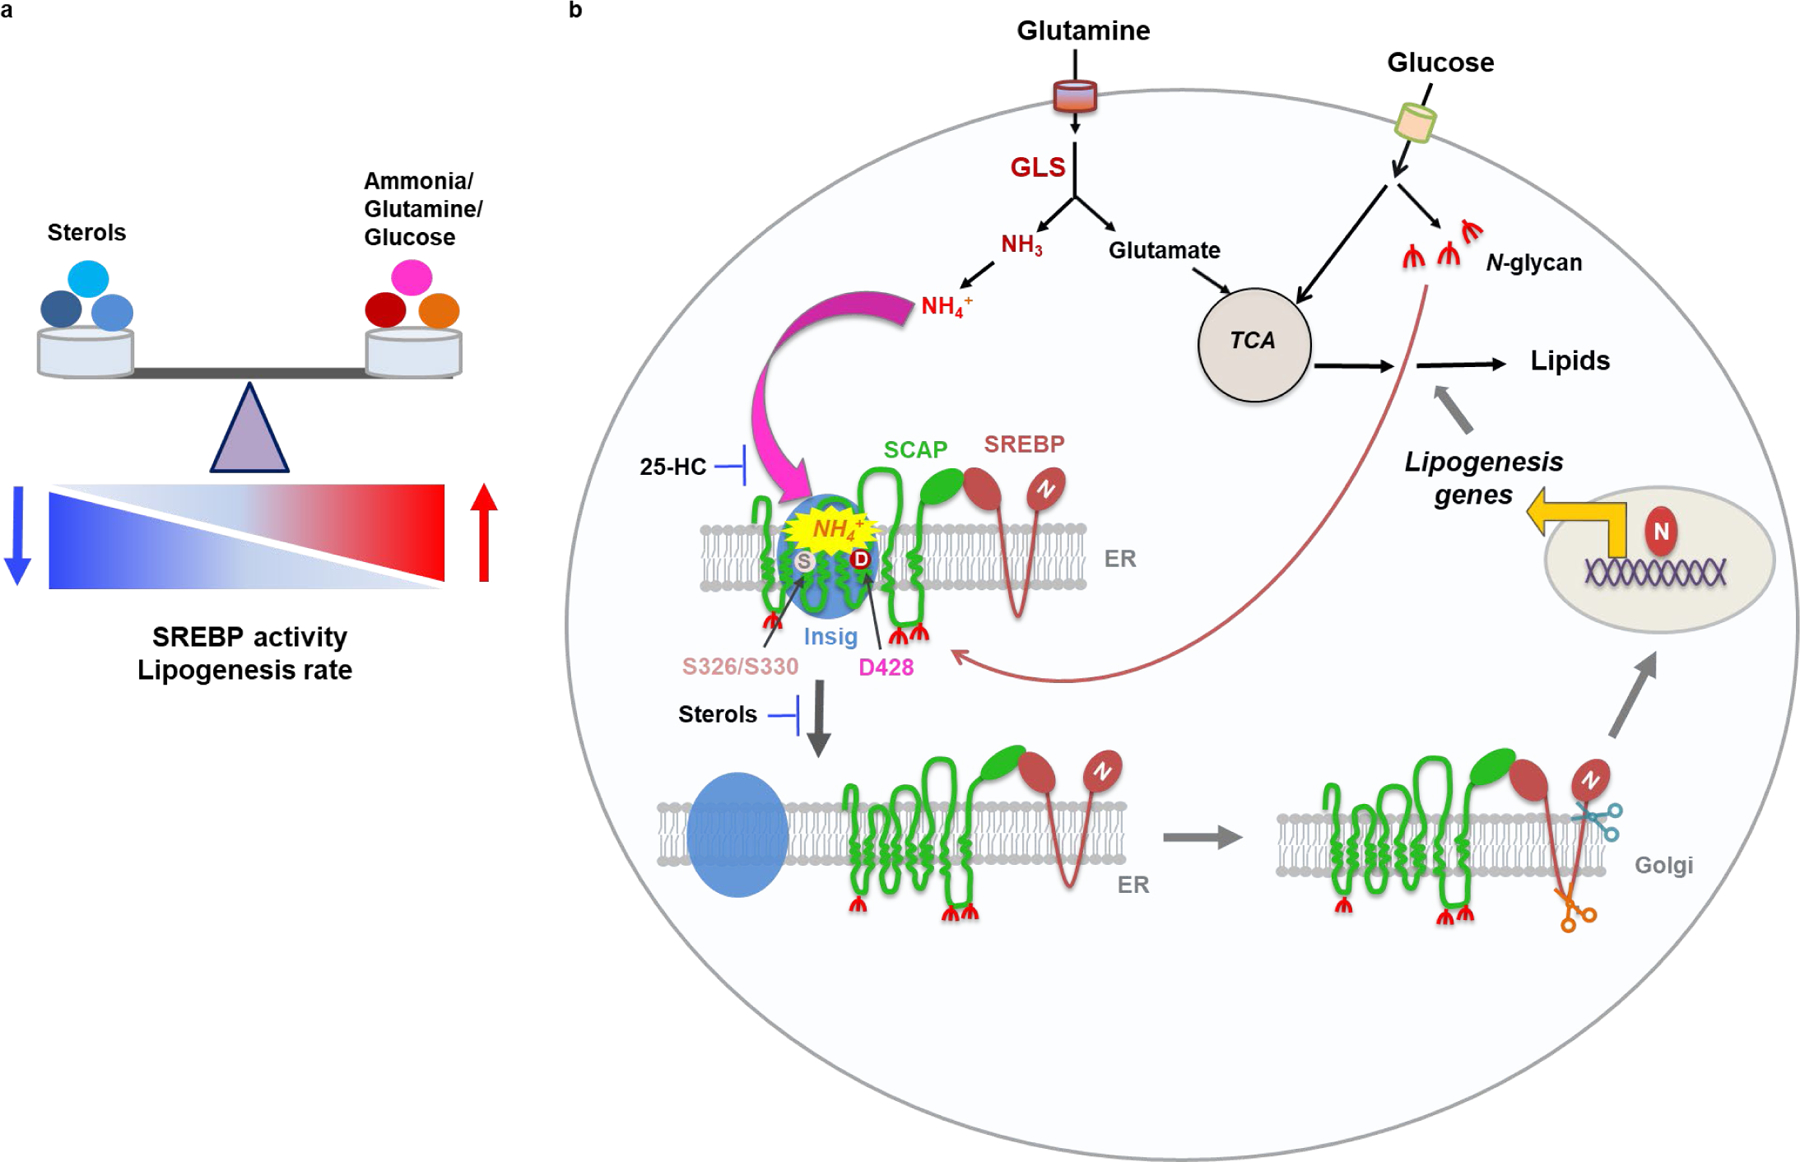
a, The balance between the positive signal from ammonia/glutamine/glucose and negative signal from sterols, including cholesterol and hydroxycholesterols, controls SREBP activity and lipogenesis rate.
b, Schematic diagram illustrating that ammonia released from glutamine catalyzed by GLS acts as a key activator stimulating N-glycosylated SCAP dissociation from Insig that leads to SREBP activation and lipogenesis. Ammonia activates SCAP/Insig dissociation via its binding to SCAP aspartate 428 (D428) and serine S326/S330 residues, which triggers sequential conformational changes of SCAP, eventually leading to SCAP/SREBP complex translocation, SREBP activation and lipogenesis to promote tumor growth. Sterols (25-hydroxcycholesterol, 25-HC) prevents ammonia to access its binding site on SCAP, thereby blocking binding to SCAP and suppressing SCAP/Insig dissociation and SREBP activation.
Ammonia released from amino acid deamination has long been considered as a toxic waste product56,57. A recent study showed that ammonia released from glutaminolysis can be utilized for pyrimidine synthesis in lung cancer cells58. Another recent study reported that ammonia could be recycled in breast cancer cells to synthesize different amino acids, e.g., glutamate, aspartate and proline59. In contrast, our study uncovers that ammonia is a critical signaling molecule of lipid metabolism.
Our computational simulation analyses showed that NH4+ enters the SCAP transmembrane domain to first bind to the D428 negatively charged side chain from the S6 helix, and then engages with the side chains of S326 and S330 from the S3 helix to form a very stable NH4+ binding. Notably, S3 and S6 helices intersect, forming the core of the SCAP transmembrane domain, and the NH4+-binding site comprising D428 and S326/S330 residues is located next to the intersection between the two helices (Fig. 5f, g). Thus, NH4+ binds in the center of the SCAP transmembrane domain, which enables the triggering of a propagating signal to induce large SCAP conformational changes, consequently the disruption of the interface between SCAP and Insig, finally leading to their dissociation (Fig. 7b, Extended Data Fig. 6f). Our data provide a molecular explanation for the effects of the D428A mutation on the stable association between SCAP and Insig under low sterol conditions60 as NH4+ is unable to bind to SCAP to induce the necessary conformational changes for its dissociation from Insig (Extended Data Fig. 6f). Our data also unveiled the competitive role of 25-HC, which serves as a roadblock to prevent the binding of NH4+ to SCAP D428 and S326/S326 residues (Extended Data Fig. 6f). When the level of 25-HC decreases, the path to NH4+ binding becomes open and NH4+ can reach the binding site to exert its function (Fig. 5f, g, Extended Data Fig. 6f). Notably, SCAP was discovered 25 years ago, but the concept and understanding of its activation triggering dissociation from Insig have remained centered on the sterol-mediated negative feedback loop regulation model9. Our present study greatly extends beyond this model and show that ammonia stimulation is indispensable for SCAP dissociation from Insig, suggesting a paradigm-shift that significantly advances our understanding of the key regulation steps in SCAP/SREBP activation and lipid metabolism (Fig. 7, Extended Data Fig. 6f) (Additional discussion please see Supplementary Information).
Limitation of the study
Our current study offers multiple lines of strong computational and biochemical evidence for the binding of ammonia to SCAP to activate SREBPs, while we have not observed the direct biophysical binding between ammonia and SCAP D428 and S326/330 residues. To visualize the molecular details of ammonia-SCAP binding, resolving the cryo-EM structure of the Insig-SCAP-NH4+ complex would be necessary, which is expected to provide the ultimate structural proof for the intriguing regulation of the Insig-SCAP complex by ammonia. In addition, our studies also raise the question of whether ammonia stays bound to SCAP upon SCAP dissociation from Insig and trafficking to the Golgi. These intriguing questions will require further intensive research.
Methods
The animal study was approved by The Institutional Animal Care and Use Committee (IACUC) at The Ohio State University (2011A00000064-R3-AM1). Human tissue analyses were approved by The Ohio State University Institutional Review Board (IRB #2015C0067). There are additional methods included in Supplementary Information.
Cell Lines
U87 (HTB-14), T98 (CRL-1690), LN229 (CRL-2611), HepG2 (HB-8065), HEK293T (acs-4500), H1299 (CRL-5803), H1975 (CRL-5908), HCC4006 (CRL-2871), and MDA468 (HTB-132) cells were purchased from ATCC. M233 (CVCL_D750) was purchased from RRID. U87/EGFR is a kind gift from Dr. Paul Mischel (Stanford University) and human GBM primary cell: GBM30 originally generated in Dr. Ichiro Nakano’s lab at OSU. H1299-luc cell line were generated in our lab.
Clinical Samples
Individual lung tumor and adjacent normal tissues, lung tumor tissue microarray (TMA) containing 50 paired (tumors and matched adjacent normal lung tissues) and 49 unpaired lung tumor tissues, and individual GBM tumor tissues were from the Department of Pathology at The Ohio State University. All human tissues were collected from Ohio State University Hospitals under Institutional Review Board- (IRB) and HIPPA-approved protocols, and histologically confirmed. Glioma TMA with 91 tumors was from the University of Kentucky and IRB approval was obtained at UK prior to study initiation. All samples had tested negative for HIV and hepatitis B. TMA slides were stained using SREBP-1 (BD Pharmingen, 557036, 1:20) or GLS (Abcam, #ab93434, 1:50) antibodies and then using biotinylated horse anti-mouse IgG (Vector labs, Cat#BA-2000, 1:500) or biotinylated horse anti-rabbit IgG (Vector labs, Cat#BA-1100, 1:500) antibodies. The slides were scanned using ScanScope and analyzed using ImageScope v11 software (Aperio Technologies, Vista, CA, USA). The staining intensity of tissues was graded as 0, 1+, 2+, or 3+. H-score was calculated using the following formula: H score = [1 x (%cells with 1+) + 2 x (%cells with 2+) + 3 x (%cells with 3+)] x 100.
Plasmids
pCMV-Myc-Insig-1, pcDNA3.1–2 x Flag-SREBP-1a (full length) and -1c (full length), pcDNA3.0-HA-SREBP-2 (full length), and pcDNA3.0-GFP-SCAP (QQQ) plasmids were obtained or cloned as previously described28. pcDNA3.0-GFP-SCAP wild-type plasmid was a gift from Dr. Peter Espenshades from Johns Hopkins University. The pcDNA3.0-GFP-SCAP (D428A) was constructed by PCR from the pcDNA3.1-SCAP D428A plasmid provided by Drs. Brown and Goldstein from the University of Texas Southwestern Medical Center60. The other point-mutants, including pcDNA3.0-GFP-SCAP-(D428E), -(D428N), -(D428K), -(S326A), -(S330A), -(S326A/S330A) and -(V353G) were constructed using site-directed mutagenesis (Q5 Site-Directed Mutagenesis Kit, #E0554S, NEB).
Cell Culture and Transfection
U87, U87EGFR, LN229, T98 (GBM cell lines), M233 (melanoma), HepG2 (liver cancer), HEK293T, and MDA468 (breast cancer) were maintained in DMEM (#15–013-CV, Cellgro). H1299, H1975, HCC4006, and H1299-luc lung cancer cell lines were cultured in RPMI-1640 medium (#15040CV, Cellgro). All media were supplemented with 5% HyClone fetal bovine serum (FBS, #SH30071.03, GE Healthcare) and 4 mM Glutamine (#25030–081, Life Technologies). GBM30, primary GBM patient-derived cells were maintained in DMEM/F12 (#MT90090PB, Fisher) containing B-27 serum-free supplements (1 x), heparin (2 mg/ml), EGF (50 ng/ml), glutamine (2 mM) and fibroblast growth factor (FGF, 50 ng/ml). All cell lines were cultured in a humidified atmosphere of 5% CO2 at 37°C. Transfection of plasmids was performed using X-tremeGENE HP DNA Transfection Reagent (#06366236001, Roche) following the manufacturer’s instructions.
Western Blot
Cells were lysed with RIPA buffer containing a protease inhibitor cocktail and phosphatase inhibitors. The proteins were separated on 12% SDS-PAGE, and transferred onto an ECL nitrocellulose membrane (#1620112, Bio-Rad). After blocking for 1.5 hr in 5% non-fat dried milk diluted by Tris-buffered saline containing 0.1% Tween 20, the membranes were incubated with SCAP (9D5) (Santa Cruz, #sc-69836, 1:1000, for examining GFP-SCAP N-glycosylation), PDI (H-17) (Santa Cruz, #sc-30932, 1:1000), Lamin A (H-102) (Santa Cruz, #sc-20680, 1:1000), SCAP antibody (Bethyl Laboratories, #A303–554A, 1:1000, for detecting the endogenous SCAP protein), SREBP-2 (BD Pharmingen, #557037, 1:500), and SREBP-1 (IgG-2A4) (BD Pharmingen, 557036, 1:1000), GLS (Abcam, #ab93434, 1:1000), GFP (Roche, #11814460001, 1:1000), Flag-tag (Sigma, #F3165, 1:1000), p-EGFR Y1086 (Invitrogen, #369700, 1:5000), EGFR (Millipore, #05–1047, 1:1000), FASN (Cell Signaling, #3180S, 1;1000), SCD1 (M38) (Cell Signaling, #2438S, 1:500), HA-tag (C29F4) (Cell Signaling, #3724S, 1:1000), p-Akt Thr308 (Cell Signaling, #9275S, 1:1000), Ser473 (587F11) (Cell Signaling, #4051S, 1:1000), Akt (pan) (C67E7) (Cell Signaling, #4691S, 1:1000), RIBOPHORIN I (Fisher, PIPA527562, 1:1000), ERGIC-53/P58 (Sigma, E1031, 1:1000), Bip (C50B12) (Cell Signaling, 3177s, 1:1000), Grp94 (Cell Signaling, 20292S, 1:1000) antibodies, followed by anti-mouse IgG (Cell Signaling, Cat#7076, 1:1,000 – 5,000), anti-rabbit IgG (Cell Signaling, Cat#7074, 1:1,000 – 5,000), or rabbit anti-Goat IgG (H+L) (Invitrogen, Cat#81–1620, 1;2000) antibodies conjugated to horseradish peroxidase. Immunoreactivity was revealed using an ECL kit (#RPN2106, GE Healthcare).
Quantitative Real-time PCR
Total RNA was isolated with TRIzol according to the manufacturer’s protocol, and cDNA was synthesized with the iScript cDNA Synthesis Kit. Quantitative real-time PCR was performed with iQ SYBR Green Supermix using the Applied Biosystems (ABI) 7900HT Real-Time PCR System. The expression was normalized to the 36B4 housekeeping gene and calculated with the comparative method (2−∆∆Ct). The primers used were listed in Supplemental Table 1.
Production and Infection of Lentivirus-shRNA
MISSION pLKO.1-puro lentivirus vectors containing shRNA for SREBP-1 (#1: TRCN0000414192; #2: TRCN0000421299), shSREBP-2 (TRCN0000020665), shGLS (#1: TRCN0000051135; #2: TRCN0000051137) and non-mammalian shRNA control (#SHC002) were purchased from Sigma. The 293FT cells were transfected with shRNA vector and packing plasmids psPAX2 (#12260, Addgene) and the envelope plasmid pMD2.G (#12259, Addgene) using polyethyleneimine (#23966; Polysciences). Supernatants were harvested after 48 hr and 72 hr and concentrated using the Lenti-X Concentrator (#631232; Clontech) according to the protocol. The virus titer was quantified by real-time PCR using the qPCR Lentivirus Titration Kit. Lentiviral transduction was performed according to the Sigma MISSION protocol with polybrene (8 μg/ml). Cells were infected with the same multiplicity of infection (MOI) of shRNA.
Co-immunoprecipitation
Briefly, HEK293T cells were transiently transfected with pcDNA3.0-GFP, pcDNA3.0-GFP-SCAP wild-type or pcDNA3.0-GFP-SCAP (D428A) together with/without pCMV-Myc-Insig-1 using X-tremeGENE HP DNA Transfection Reagent. At 24 hr post-transfection, cells were washed once with ice-cold PBS and lysed with 0.5 ml of immunoprecipitation (IP) lysis buffer (50 mM HEPES-KOH, pH 7.4, 100 mM NaCl, 1.5 mM MgCl2, 0.1% Nonidet P-40, 1 μg/ml pepstatin A, 10 μg/ml leupeptin, and 2 μg/ml aprotinin). Cell lysates were passed through a 22-gauge needle 15 times and incubated for 1 hr at 4°C. The cell extracts were clarified by centrifugation at 20,000 × g for 30 min at 4°C. Supernatants were pre-cleared for 1 hr by rotation with 30 μl of pre-equilibrated protein G-agarose beads at 4°C (#11243233001, Roche Applied Science). Pre-cleared lysates were incubated with 2 μg of anti-GFP antibody at 4 °C for 1 hr, 30 μl of pre-equilibrated protein G-agarose beads were then added and rotated for 16 hr at 4°C. After centrifugation, the beads were washed three times with 1 ml of ice-cold IP lysis buffer. The bead-bound proteins were eluted by boiling in SDS-PAGE sample buffer and subjected to SDS-PAGE and subsequent western blot analysis. Please all see previous study for the procedure28.
Measures of Ammonia Levels in Tissues, Cells and bound to SCAP
To measure ammonia levels in tumors and normal tissues, 10 mg of tissues were collected and lysed through homogenization on ice in the ammonia assay buffer (100 μl) from the commercial kit. The lysates were centrifuged at 20,000 × g for 5 min at 4°C and the ammonia levels in the supernatants were measured by the ammonia assay kit following the manufacturer’s instructions (#ab83360, Abcam).
For measurement of SCAP-bound ammonia, a total of 1.3 × 10⁷ HEK293T cells was seeded in 15 cm dishes for 24 hr. The cells were transfected with GFP, GFP-SCAP wild-type, or D428A mutant together with myc-Insig1 plasmids for 24 hr, and then washed with PBS, followed by addition of fresh DMEM medium containing glucose (5 mM) and NH4CI (4 mM) for 2 hr in the absence of glutamine. The cells were then washed with ice-cold PBS and lysed with 1 ml of buffer (25 mM Tris, pH 8.0, 150 mM NaCl, 1% (w/v) LMNG (DL14035, Biosynth Carbosynth) containing a protease inhibitor cocktail50. Cell lysates were passed through a 22-gauge needle 30 times and incubated for 1 hr at 4°C. The cell extracts were clarified by centrifugation at 17,000 × g for 10 min at 4°C. Supernatants were incubated for 1 hr by rotation with 50 μl of pre-equilibrated GFP-Trap agarose beads (#gta, ChromoTek) at 4°C. The precipitated protein complex was washed with 1 ml buffer (25 mM Tris, pH 8.0, 150 mM NaCl, 0.005% (w/v) LMNG) twice, and then added to 50 μl ammonia assay buffer to measure ammonia according to the kit instructions.
Measurements of ammonia, glutamate and α-KG levels in cells were conducted using the ammonia assay kit, glutamate assay kit (ab138883) and α-KG assay kit (ab83431), respectively, according to the manufacturer’s instructions.
Isolation of Microsomal Membranes from H1299 cells for ER-budding Assay
H1299 cells were washed and scraped into 2 ml of ice-cold DPBS with protease inhibitors from duplicate 15 cm dishes. The cells were centrifuged at 1000 × g for 5 min at 4°C. The tubes were snap-frozen in liquid nitrogen and stored at −80°C after aspiration of the supernatants. When needed, the tubes were thawed in a 37°C water bath for 50 sec and placed on ice. Each cell pellet was resuspended in 0.4 ml of Buffer B (10 mM HEPES-KOH (pH 7.2), 250 mM sorbitol, 10 mM KOAc, 1.5 mM Mg(OAc)2, and protease inhibitors), passed through a 22-gauge needle 20 times, and centrifuged at 1000 × g for 5 min at 4°C. The supernatants were transferred to siliconized microcentrifuge tubes (#1212M66, Thomas scientific) and centrifuged at 16,000 × g for 3 min at 4°C. Subsequently, each pellet was resuspended in 0.5 ml of Buffer A and centrifuged again at 16,000 × g for 3 min at 4°C. The microsomes for use in the in vitro vesicle-formation assay were obtained by dissolving the remaining pellet into 60–100 μl of Buffer A. The protein concentration was determined after a 5 μl of the microsomal suspension was added to 5 μl of a solution of 20% (w/v) of hexyl-β-D-glucopyranoside. Please also see previous study for the procedure48.
In Vitro Vesicle-Formation Assay
Each reaction in a final volume of 80 μl contained 50 mM HEPES-KOH at pH 7.2, 250 mM sorbitol, 70 mM KOAc, 5 mM potassium EGTA, 2.5 mM Mg(OAc)2, 1.5 mM ATP, 0.5 mM GTP, 10 mM creatine phosphate, 4 units/ml of creatine kinase, protease inhibitors, 37–80 μg protein of H1299 microsomes, and 600 μg of rat liver cytosol. Reactions were carried out in siliconized 1.5 ml microcentrifuge tubes for 15 min at 37°C, terminated by transfer of the tubes to ice, and then followed by centrifugation at 16,000 × g for 3 min at 4°C to obtain a medium-speed pellet (the membrane fractions) and a medium-speed supernatant. The medium-speed supernatants were collected from each sample and centrifuged again at 132,527.136 × g for 40 min at 4°C in a Beckman TLA120.1 rotor to obtain a high-speed pellet (vesicle fractions). The vesicle and membrane fractions were each resuspended in 60 μl of the buffer (10 mM Tris-HCl at pH 7.6, 100 mM NaCl, 1% (w/v) SDS plus protease inhibitors, supplemented with 15 μl of the buffer: 150 mM Tris-HCl at pH 6.8, 15% SDS, 25% (v/v) glycerol, 0.02% (w/v) bromophenol blue, and 12.5% (v/v) 2-mercaptoethanol) and heated at 100°C for 10 min. The vesicle and membrane fractions were subjected to 10% SDS-PAGE and analyzed by immunoblotting. Please also see previous study for the procedure48.
Xenograft Mouse Models
Athymic nu/nu female mice (6–8 weeks old) housed under a 12 hr light/12 hr dark cycle at 22°C and a relative humidity of 25%, were used. For lung cancer model, H1299-luc cells were transfected with pC3.0-GFP, pC3.0-GFP-SCAP wild-type or pC3.0-GFP-SCAP D428A for 24 hr. The cells were selected with 600 ng/ml G418 for two weeks and implanted into mice via tail-vein injection (1 × 10⁶ cells/mouse suspended in 0.1 ml of PBS). After seven weeks, the mice were sacrificed, and the lungs were collected, fixed with 4% formaldehyde and embedded in paraffin. Sections (5 μm) were cut and stained with H&E and IHC. For subcutaneous tumor mice, NSCLC H1299 cells were infected with shGLS- or shSREBP-1-expressing lentivirus for 48 hr and then were implanted (2 × 10⁶ cells/mouse) into the flank of nude mice (6–8 weeks old). Mice were sacrificed by euthanasia when tumor size reached the limitation (tumor diameter is up to 1.6 cm) and tumors were isolated and weighed. For intracranial xenograft models, GBM30 cells stably expressing GFP, GFP-SCAP wild-type, or GFP-SCAP D428A mutant (3.5 × 10³ cells in 4 μl of PBS) were stereotactically implanted into mouse brain. Mice were observed and scanned by Magnetic Resonance Imaging (MRI) until they became moribund, at which point they were sacrificed. All animal procedures were approved by the Subcommittee on Research Animal Care at Ohio State University Medical Center.
Mouse Luminescence Imaging
Mice implanted with H1299 cells expressing luciferase were intraperitoneally injected with a Luciferin (#122796, Perkin Elmer) solution (15 mg/ml in PBS, dose of 150 mg/kg). The bioluminescence images were acquired using the IVIS Lumina system and analyzed by the Living Image software.
Molecular Dynamics Simulations
The cryo-EM structure of the Insig/SCAP complex (PDB ID: 6M49)50 was used as the initial structure for our simulations. The SCAP structure without 25-HC was prepared by replacing the partially unfolded S4 helix (residues 354–358) in the inactive conformation with a fully folded S4 helix, which was built with Modeller V10.1 using NPC1 (PDB code: 6W5S)61 as a template. The CHARMM-GUI membrane builder was used to build a membrane bilayer consisting of 366 hydrated palmitoyl-oleyl-phosphatidylcholine (POPC) molecules62,63. Each system was solvated with approximately 34,000 TIP3P water molecules (a type of water used in simulations that represents 3-site rigid water molecule with charges and Lennard-Jones parameters assigned to each of the 3 atoms (HOH)) and 0.15 M NaCl64. The CHARMM 36 force field was used for the proteins, lipids and ions, while the ligand (25-HC) was parameterized using SwissParam65. All simulations were performed at 310K and the temperature was regulated with the v-rescale scheme 66. The solutes (protein, membrane and ligand) and solvents (water and ions) were coupled separately with a relaxation time constant of 0.1 ps. The Parrinello-Rahman barostat was used to keep the pressure at 1 bar with a coupling constant of 0.2 ps. The isothermal compressibility was 4.5 × 10⁻⁵ bar−1. The pressure was coupled semi-isotropically, where the x and y directions were coupled together, and the z direction was independently coupled. All bonds were constrained with the LINCS algorithm. The integration time step was 2 fs. The non-bonded long-range electrostatic interactions were calculated using the particle mesh Ewald method with a 14 Å cutoff. The van der Waals interaction also used a 14 Å cutoff. All simulations were carried out using Gromacs 202067.
Each system was first energy minimized with the steepest-descent method with a maximum of 50,000 steps or the maximum force in the system reaching less than 100 kJ·mol−1Å−2. After energy minimization, a 500 ps equilibration simulation was performed with position restraints on the protein, lipids, and ligands, which was followed by six 1 ns simulations with decreasing position restraints. Finally, one ~1 μs-long production simulation without any restraints was run for each system, with trajectories saved every 100 ps (a total of ~10,000 frames for each simulation) for subsequent analysis.
Co-solvent Mapping
With the Insig-SCAP complex embedded in a 1-palmitoyl-2-oleoyl-sn-glycero-3-phosphocholine (POPC) bilayer prepared as described above, we solvated each system with high concentrations of either NH3 or NH4+ to identify the potential binding sites for NH3 or NH4+ using MD simulations. A total of 1000 NH3 molecules were added to the system with a box size of 127Å x 127Å x 116 Å, yielding a final NH3 concentration of 1M. Independently, 600 NH4+ molecules were added to the system, yielding a final NH4+ concentration of 0.6 M. The force fields for NH3 and NH4+ were generated using CGenFF68,69. All minimization and equilibration steps were the same as those in the standard MD simulations described above. Five sets of co-solvent mapping simulations were conducted, which are listed in table below; for each set, five independent replicas were performed, yielding a total of 25 simulations, each with a duration of 100 ns.Summary of all co-solvent mapping simulations performed is shown in Supplemental Table 2
Simulation Data Analysis
The molecular visualization software VMD was used for visualization and structural parameter calculations70. Details please see Supplementary Information, method section.
Statistics and Reproducibility
All figures, including western blots, metabolites analysis, and mouse experiments, are representative of at least two biological replicates with similar results, unless stated otherwise. The quantification of tumor volume in mice brain measured by MRI imaging was blinded. All other data collection and analysis were not performed blind to the conditions of the experiments. Data analysis was performed using GraphPad Prism 8.0.2. Data distribution was assumed to be normal but this was not formally tested. No animals or data points were excluded from the analyses in our study Statistical significance was obtained using paired or unpaired Student’s t test, or one-way or two-way ANOVA depending on the data. Multiplicities were adjusted by the Dunnetts’s or Turkey methods. Kaplan-Meier method was used to generate patient and mice overall survival curves and the difference in survivals was tested by Log-rank test. No statistical method was used to determine sample sizes but sample size used was based on the results from our previous studies28,53,55.
Reporting Summary
Further information on research design is available in the Nature Research Reporting Summary linked to this paper.
Data Availability
All data that support the findings of this study are available within the paper and its supplementary information files. RNA-seq data for Fig.1a, Fig.2f, and Extended Data Fig.1a are provided in Supplementary Data, and the raw data are deposited in the GEO repository (Accession: GSE199089; link: https://www.ncbi.nlm.nih.gov/geo/query/acc.cgi?acc=GSE199089).
Code Availability
No custom codes were used during this study.
Extended Data
Extended Data Fig. 1. Glutamine activates SREBP-1 to promote cell proliferation.
a, Heatmap comparison of metabolic and overall pathways based on RNA-seq data from H1299 cells under glucose, glutamine or a combination of glucose and glutamine vs. both free conditions (12 hr) using the bioinformatics Ingenuity Pathway Analysis (IPA). #NUM, no activity pattern available.
b, c, Western blot analysis of cell lysates of cells stimulated with glutamine for 12 hr (b) or with 4 mM glutamine at the indicated times (c) under serum-free conditions (glucose 5 mM).
d, Lipids derived from 14C-labeled glucose (0.5 μCi, 2 hr) in cells after culturing cells with/without glutamine (4 mM) for 12 hr in serum-free medium containing 5 mM non-labeled glucose. The results are presented as mean ± SEM (n = 3).
e, Proliferation of cancer cells cultured in medium supplemented with 1% dialyzed FBS with/without glutamine (4 mM) or glucose (5 mM) (mean ± SD, n = 3).
f, g, Western blot analysis of cells after infection with shRNA-expressing lentivirus for 48 hr and then placed in fresh medium (5 mM glucose) with/without glutamine (4 mM) for another 12 hr (left panels). Cell proliferation was determined under 1% dialyzed FBS (right panels). The results are shown as mean ± SD (n = 3).
h, Western blot analysis of cells after treatment with atorvastatin (5 μM) for 12 hr in 5% lipoprotein-deficient serum (LPDS) containing 5 mM glucose with/without glutamine (4 mM).
i, Western blot analysis of cells after stimulation with EGF (20 ng/ml) for 12 hr in serum-free medium (5 mM glucose) with/without glutamine (4 mM).
j, Western blot analysis of cells after incubation with/without aspartate (0.15 mM), asparagine (0.38 mM), leucine (0.38 mM), methionine (0.1 mM), threonine (0.17 mM) or glutamine (2 mM) for 12 hr in HBSS buffer (containing 5.6 mM glucose) supplemented with essential amino acids. The dose selected for each amino acid is same as their concentration included in RPMI 1640 medium.
Significance was determined by unpaired and two-tailed Student’s t test (d) or two-way ANOVA with Dunnett’s (e) or Tukey’s (g) multiple comparisons adjustment.
Extended Data Fig. 2. Ammonia activates SREBPs and lipogenesis.
a, Western blot analysis of cells stimulated with glutamine, NH4Cl, NH3·H2O, NaCl, NaOH, or NaNO3 (all 4 mM) under serum-free medium (5 mM glucose) for 12 hr.
b, Western blot analysis of cells stimulated with NaCl (12 hr) in the absence of glutamine under serum-free culture conditions containing 5 mM glucose.
c, Representative IF images of cells after stimulation with glutamate (4 mM), α-KG (4 mM), lactate (10 mM) or glutamine (4 mM) for 12 hr under serum-free culture conditions (5 mM glucose). Scale bars, 10 μm. The nuclear intensity of SREBP-1 (bottom panel) was quantified over 30 cells by ImageJ (mean ± SEM, n ≥30).
d-f, Western blot analysis of H1299 cells stimulated with glutamine (4 mM), glutamate (Glu, 4 mM), α-KG (4 mM), octyl-α-KG (OA-KG) (2 mM), or NH4Cl (4 mM) for 12 hr under serum-free culture conditions (5 mM glucose) (d). The levels of glutamate (e) and α-KG (f) in the cells were measured using the appropriate assay kits. The results (e and f) are presented as mean ± SEM (n = 3).
g, Western blot analysis of H1299 cells stimulated with glutamine (4 mM) or NH4Cl (4 mM) for 12 hr in the presence of glucose (5 mM) after ATG5 siRNA knockdown for 24 hr.
h, Western blot analysis of cells stimulated with NH4Cl at the indicated doses for 12 hr under serum-free culture conditions (5 mM glucose).
i-k, Western blot analysis of membranes (for GFP-SCAP, PDI and SREBP precursors) and nuclear extracts (for N-terminal SREBPs and Lamin A) from HEK293T cells transfected with GFP (2 μg), GFP-SCAP wild-type (NNN) (2 μg) or its mutant QQQ (5 μg), obtained by replacing all three N-glycosylation residues asparagine (N) to glutamine (Q), together with full length Flag-SREBP-1a (i), -1c (j), or HA-SREBP -2 (k) for 24 hr and then stimulated with glutamine or NH4Cl (all 4 mM) for another 12 hr under serum-free culture conditions (5 mM glucose).
Significance was determined by unpaired and two-tailed Student t test or one-way ANOVA with Dunnett’s multiple comparisons adjustment.
Extended Data Fig. 3. Suppressing ammonia release from glutamine inhibits SREBPs.

a, Relative metabolite levels in H1299 cells after treatment with GPNA (5 mM) or CB-839 (100 nM) for 12 hr under serum-free medium containing glutamine (4 mM) and glucose (5 mM) via using appropriate assay kits (mean ± SEM, n = 3). Cell culture conditions upon treatment are the same for the subsequent panels.
b, Relative glutamine consumption of cells treating with GPNA (5 mM) or CB-839 (100 nM) for 12 hr (mean ± SEM, n = 3).
c, d, Western blot analysis of cells treated with GPNA or CB-839 (48 hr).
e, Western blot analysis of GBM30 cells treated with CB-839 (200 nM) for 12 hr with/without glutamine, glutamate or NH4Cl (all 4 mM).
f, Ammonia measurement (left panel) in tumor tissues from H1299 cells (4 × 10⁶) derived xenograft model treated with CB-839 (30 mg/kg/mouse, i.p., twice per day for 3 days) when tumor size reached 200 mm3 (mean ± SEM, n = 6). Middle panel shows representative IHC images. Scale bars, 50 μm. The expression levels were quantified by using ImageJ to analyze 4 images per tumor (3 tumors/group) (mean ± SEM, n ≥ 2441 cells) (right panel).
g, Relative glutamine consumption (12 hr) of cells after infection with shRNA-expressing lentiviruses (48 hr) (mean ± SEM, n = 3).
h, Relative metabolite levels in cells measured by the appropriate assay kit after infection with shRNA-expressing lentiviruses (mean ± SD, (n = 3).
i, j, Western blot analysis of cells after infection with shRNA-expressing lentiviruses for 48 hr and then stimulated with 4 mM glutamate, α-KG or NH4Cl for 12 hr.
k, l, Real-time qPCR (k) and Western blot (l) analysis of cells under serum-free medium containing 5 mM glucose and 4 mM glutamine for 12 hr after siRNA knockdown of glutamate dehydrogenase (GDH1/2), asparaginase (ASPG) or serine deaminase (SDS) (24 hr). The results (k) are presented as mean ± SEM (n = 3).
Significance was determined by unpaired and two-tailed Student’s t test or one-way ANOVA with Dunnett’s multiple comparisons adjustment.
Extended Data Fig. 4. GLS is correlated with SREBP-1 in human tumor tissues.
a, Representative IHC images of anti-GLS and -SREBP-1 staining in tumor vs. adjacent normal tissues from individuals with adenocarcinoma (Adeno) or squamous lung cancer. Scale bars, 50 μm.
b-c, Representative IHC images of anti-GLS and anti-SREBP-1 staining from lung cancer TMA (b). Representative images of different levels of anti-GLS or anti-SREBP-1 staining and scoring are shown in (c).
d, Comparison of GLS expression and SREBP-1 levels in 50 paired tumors vs. adjacent normal lung tissues from the lung cancer TMA based on H score. Significance was determined by an unpaired Student’s t test.
e, Genetic inhibition of GLS or SREBP-1 dramatically suppressed lung tumor growth in vivo. NSCLC H1299 cells were infected with shGLS- or shSREBP-1-expressing lentivirus for 48 hr and then were implanted (2 × 10⁶ cells/mouse) into the flank of nude mice. The tumors were isolated from mice at 53 days post-implantation and were imaged (left panel) and weighed (right panel) for comparison. Data are shown as mean ± SEM (n = 6). Significance was determined by one-way ANOVA with Dunnett’s multiple comparisons adjustment.
f, Representative IHC images of anti-GLS, anti-SREBP-1, anti-ASPG and anti-SDS staining in tumor tissues from patients with GBM. Scale bars, 50 μm.
g, h, Representative images of anti-GLS and anti-SREBP-1 staining from glioma TMA (g). Representative images of different levels of anti-GLS or anti-SREBP-1 staining and scoring are shown in (h).
Extended Data Fig. 5. Ammonia binds to SCAP stimulating SCAP/SREBP activation.
a, Representative confocal images of U87 cells in response to glutamine (4 mM), glucose (5 mM) or NH4Cl (4 mM) stimulation for 12 hr with/without CB-839 (100 nM) under serum-free culture conditions. Scale bars, 10 μm.
b, In vitro SCAP ER-budding assay. H1299 cells were stimulated with/without glutamine (4 mM) or NH4Cl (4 mM) for 4 hr under serum-free medium (5mM glucose). Microsomes were purified and incubated at 37°C for 15 min or on ice (as time 0) with cytosol extracts from rat liver in the presence of ATP and GTP (left panel). Alternatively, microsomes purified from H1299 cells cultured with glucose (5 mM) alone (2 hr) were incubated with NH4Cl (1 mM) or NaCl (1 mM) at 37°C or on ice together with liver extracts as above (right panel). The mixtures were centrifuged to separate budded vesicles from the ER membrane fractions, which were then analyzed by Western blot by using indicated antibodies.
c, Co-solvent NH3 computational mapping of SCAP.
d, Alignment of the SCAP protein fragment.
e, A schematic model for the sequential binding of NH4+ to SCAP obtained from the co-solvent ammonia mapping and NH4+-bound SCAP simulations.
f, Western blot analysis of HEK293T cells transfected with GFP, wild-type or different GFP-SCAP mutants together with full-length Flag-SREBP-1c for 24 hr, and then stimulated with glutamine (4 mM) for 12 hr under serum-free conditions (5 mM glucose).
g. Co-solvent ammonia mapping for SCAP bound with 25-HC. Right panel shows the biochemical analysis of GFP-SCAP-bound ammonia in HEK293T cells stimulated with NH4Cl (4 mM) for 2 hr with/without pretreatment with 25-HC (10 μg/ml, 1 hr) using an ammonia assay kit. Top panel shows by western blot that equal amounts of proteins were purified. The results are presented as mean ± SEM (n = 3). Significance was determined by unpaired and two-tailed Student’s t-test.
h, i, Western blot analysis of H1299 cells cultured with NH4Cl (4 mM) (h) or glutamine (4 mM) (i) for 12 hr in serum-free medium (5 mM glucose) together with a cholesterol/25-hydroxycholesterol mixture (sterols).
Extended Data Fig. 6. Ammonia binding induces SCAP dissociation from Insig.
a-d, Comparison of the coupling, tilting and kink angles of S3, S5 and S6 helices during the 1 μs simulations of SCAP bound with NH4+ vs. SCAP without bound NH4+. In panel (a), S3 and S6 helices from the NH4+ unbound simulation (in light gray) is aligned with the NH4+ bound simulation (in dark gray). NH4+, D428, S326 and S330 are shown in the stick representation. The coupling of the S3 and S6 helices was altered by the binding of NH4+ (a). In the NH4+ bound simulation, the S3 helix had a smaller tilting angle (b) and S5 and S6 helix had a larger tilting angle (c and d). Inset in panel (b) illustrates a helix titling angle. Insets in panel (c) and (d) illustrate a helix kink conformation with the lower part of the helix aligned (white), and the top part of the helix showing a difference between NH4+ bound and NH4+ unbound SCAP. Only converged data from the last 500 ns of each simulation were used for the histogram analysis.
e, Comparison of the interface contact area between SCAP and Insig during the simulations of the NH4+ bound SCAP vs. the NH4+ unbound SCAP.
f, A schematic model for NH4+ regulated SCAP activation. Left: Insig-SCAP binding in the absence of 25-HC and NH4+. Top: Binding of 25-HC blocks NH4+ binding to prevent SCAP activation (orange). Middle: Absence of 25-HC opens the channel, which permits the entry of NH4+ to bind to D428 first, then to S326/S330 to form a stable binding site, leading to significant conformational changes of SCAP (red) and its dissociation from Insig for subsequent translocation and SREBP activation. Bottom: D428A mutant is unable to bind NH4+, preventing NH4+ from inducing conformational changes required for SCAP dissociation from Insig in the absence of 25-HC; thus, it cannot be activated by NH4+.
Extended Data Fig. 7. SCAP D428A mutation completely abolishes ammonia function.
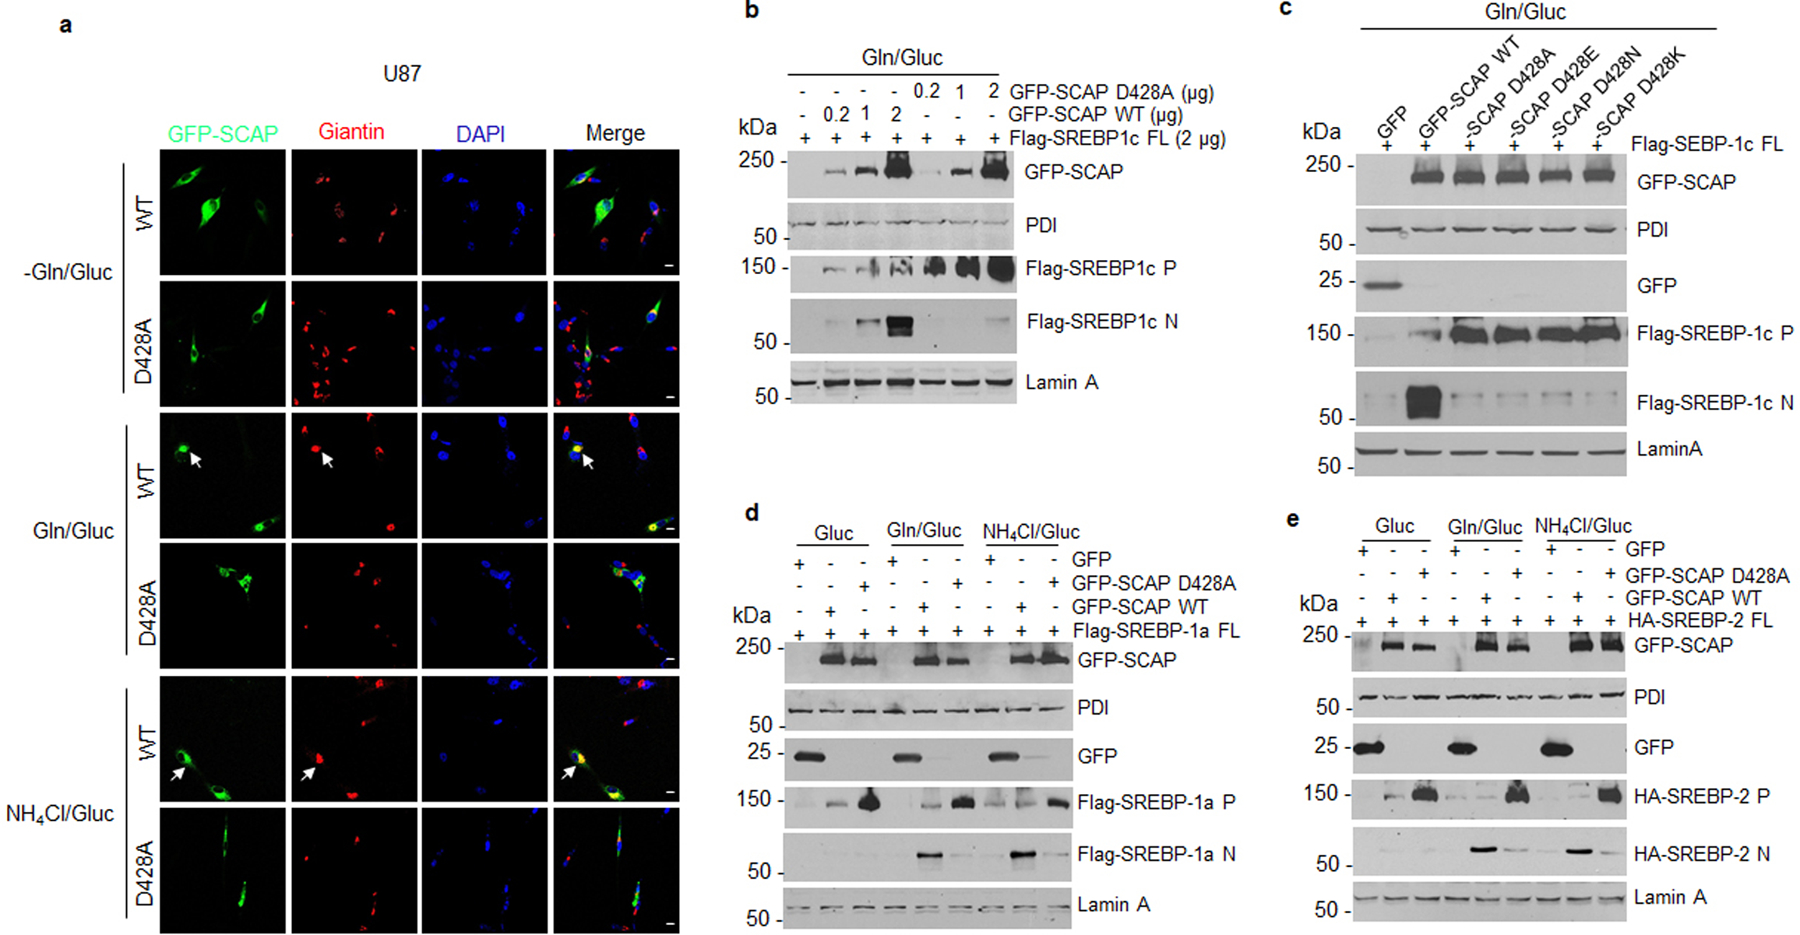
a, Representative confocal microscopy images of wild-type or mutant (D428A) GFP-SCAP in U87 cells compared to the Golgi marker Giantin (red) in response to glutamine or NH4Cl stimulation in the presence of glucose. U87 cells were cultured on coverslips in DMEM medium supplemented with 5% FBS for 24 hr, followed by transfection with wild-type or mutant (D428A) GFP-SCAP plasmids for 24 hr. The transfected cells were washed with PBS once and incubated with glutamine (4 mM) or NH4Cl (4 mM) for 12 hr in fresh serum-free DMEM medium with the presence of glucose (5 mM). Cell culture conditions prior to treatment are the same for subsequent panels. Scale bars, 10 μm.
b, Western blot analysis of membrane and nuclear extracts from HEK293T cells transfected with GFP, GFP-SCAP wild-type or D428A mutant plasmids at the indicated doses together with full-length Flag-SREBP-1c for 24 hr and then placed in fresh serum-free DMEM medium containing glutamine (4 mM) and glucose (5 mM) for another 12 hr.
c, Western blot analysis of membrane and nuclear extracts from HEK293T cells transfected with GFP, GFP-SCAP wild-type or mutant D428A, D428E (glutamate), D428N (asparagine), D428K (lysine) together with full-length Flag-SREBP-1c for 24 hr and then placed in fresh serum-free medium in the presence of glucose (5 mM) and glutamine (4 mM) for another 12 hr.
d, e, Western blot analysis of membrane (for GFP-SCAP and SREBP precursors) and nuclear extracts (for N-terminal SREBPs) from HEK293T cells transfected with GFP, wild-type or mutant GFP-SCAP (D428A) together with full-length Flag-SREBP-1a (d) or HA-SREBP-2 (e) for 24 hr and then stimulated with glutamine (4 mM) or NH4Cl (4 mM) in the presence of glucose (5 mM) under fresh serum-free medium.
Extended Data Fig. 8. D428A mutation abolishes SCAP-promoted tumor growth.
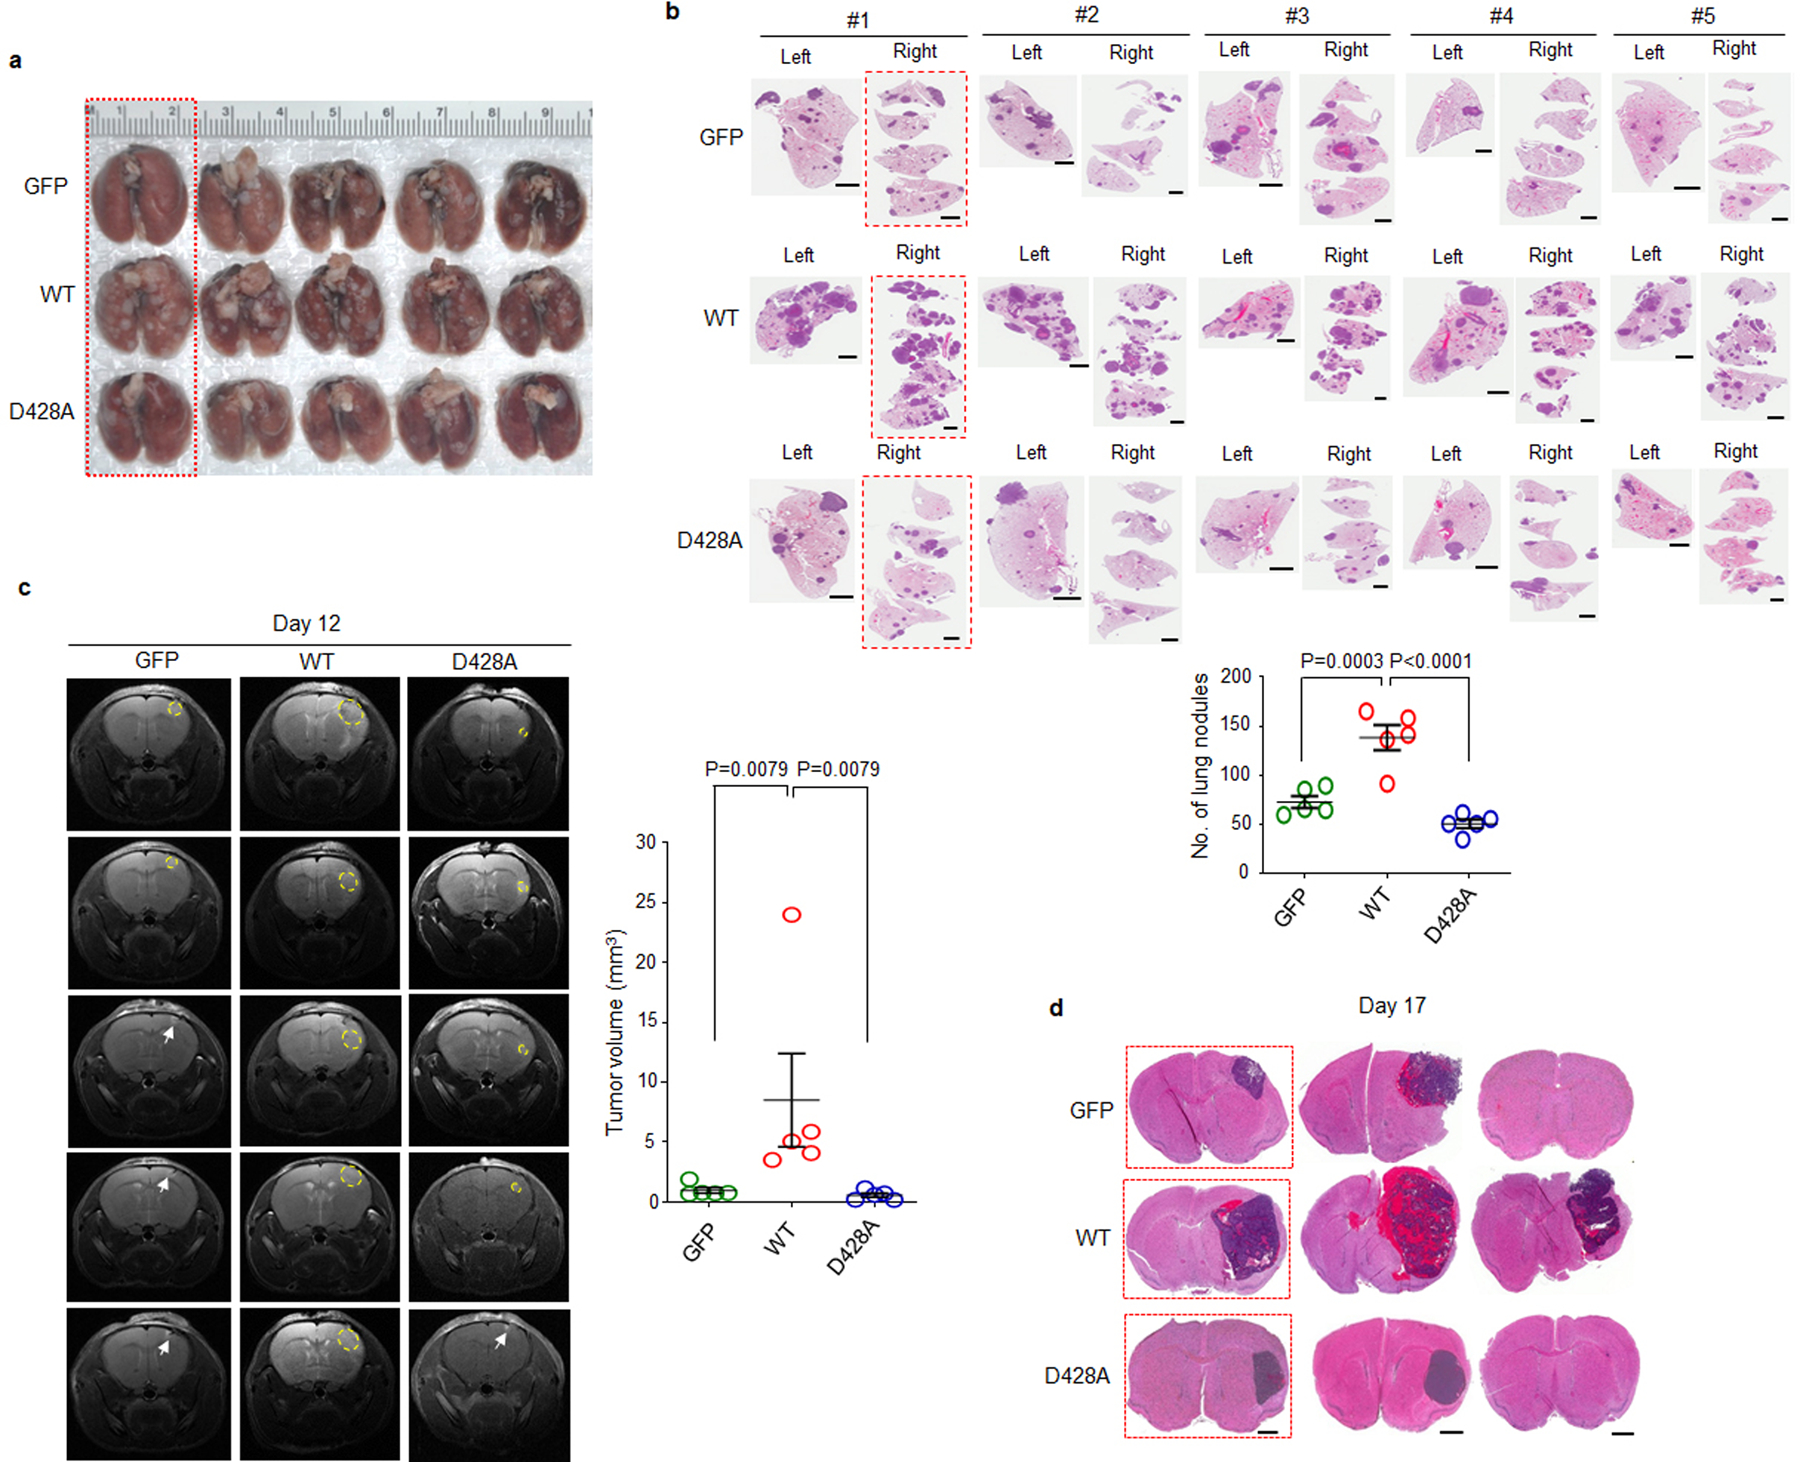
a, b, Gross and macroscopic images of mouse lungs (a) and H&E staining of lung sections (b) at day 50 after mouse implantation with H1299 cells expressing GFP, wild-type (WT) or mutant GFP-SCAP D428A. Framed images in red were presented in Fig. 6d as representatives. Scale bars, 2 mm. The number of nodules on mice lung sections was quantified by Image-J (b, lower panel). Data are shown as mean ± SEM (n = 5). Significance was determined by one-way ANOVA with Dunnett’s multiple comparisons adjustment.
c, MRI scans of mouse brain at day 12 after implantation of GBM30 cells stably transfected with GFP, wild-type or mutant (D428A) GFP-SCAP (3.5 × 10³ cells/mouse). Yellow circles indicate tumor location. White arrows indicate injection site. Scatter plot shows tumor volume from MRI scans quantified from the outlined region-of-interest (ROIs) (right panel). The results are presented as mean ± SEM (n = 5). Significance was determined by unpaired and two-tailed Student’s t test.
d, H&E staining of mouse brain sections excised at day 17 after implantation of GBM30 cells as described in (c). Rectangle-framed images were used in Fig. 6h as representatives. Scale bars, 1 mm.
Supplementary Material
Acknowledgments
This work was supported by NINDS and NCI (USA) grants NS104332, NS112935 and R01CA240726 to DG, CA227874 to DG/AC, and an American Cancer Society Research Scholar Grant RSG-14-228-01-CSM to DG. We also appreciate the support from OSUCCC-Pelotonia Idea grant and Urban & Shelly Meyer Fund for Cancer Research to DG. The authors wish to thank Dr. Martine Torres for her editorial assistance.
Footnotes
Competing Interests
The authors declare no competing interests.
Additional information
Supplementary information is available for this paper.
References
- 1.Guo D, Bell EH, Mischel P & Chakravarti A Targeting SREBP-1-driven lipid metabolism to treat cancer. Curr Pharm Des 20, 2619–2626 (2014). [DOI] [PMC free article] [PubMed] [Google Scholar]
- 2.Cheng C, Geng F, Cheng X & Guo D Lipid metabolism reprogramming and its potential targets in cancer. Cancer Commun (Lond) 38, 27, doi: 10.1186/s40880-018-0301-4 (2018). [DOI] [PMC free article] [PubMed] [Google Scholar]
- 3.Cheng X, Li J & Guo D SCAP/SREBPs are Central Players in Lipid Metabolism and Novel Metabolic Targets in Cancer Therapy. Curr Top Med Chem 18, 484–493, doi: 10.2174/1568026618666180523104541 (2018). [DOI] [PMC free article] [PubMed] [Google Scholar]
- 4.Nohturfft A & Zhang SC Coordination of lipid metabolism in membrane biogenesis. Annu Rev Cell Dev Biol 25, 539–566, doi: 10.1146/annurev.cellbio.24.110707.175344 (2009). [DOI] [PubMed] [Google Scholar]
- 5.Goldstein JL, DeBose-Boyd RA & Brown MS Protein sensors for membrane sterols. Cell 124, 35–46, doi: 10.1016/j.cell.2005.12.022 (2006). [DOI] [PubMed] [Google Scholar]
- 6.Goldstein JL & Brown MS A century of cholesterol and coronaries: from plaques to genes to statins. Cell 161, 161–172, doi: 10.1016/j.cell.2015.01.036 (2015). [DOI] [PMC free article] [PubMed] [Google Scholar]
- 7.Jeon TI & Osborne TF SREBPs: metabolic integrators in physiology and metabolism. Trends Endocrinol Metab 23, 65–72, doi: 10.1016/j.tem.2011.10.004 (2012). [DOI] [PMC free article] [PubMed] [Google Scholar]
- 8.Horton JD, Goldstein JL & Brown MS SREBPs: activators of the complete program of cholesterol and fatty acid synthesis in the liver. J Clin Invest 109, 1125–1131, doi: 10.1172/JCI15593 (2002). [DOI] [PMC free article] [PubMed] [Google Scholar]
- 9.Brown MS, Radhakrishnan A & Goldstein JL Retrospective on Cholesterol Homeostasis: The Central Role of Scap. Annu Rev Biochem 87, 783–807, doi: 10.1146/annurev-biochem-062917-011852 (2018). [DOI] [PMC free article] [PubMed] [Google Scholar]
- 10.Bennett MK, Lopez JM, Sanchez HB & Osborne TF Sterol regulation of fatty acid synthase promoter. Coordinate feedback regulation of two major lipid pathways. J Biol Chem 270, 25578–25583, doi: 10.1074/jbc.270.43.25578 (1995). [DOI] [PubMed] [Google Scholar]
- 11.Xu D et al. The gluconeogenic enzyme PCK1 phosphorylates INSIG1/2 for lipogenesis. Nature 580, 530–535, doi: 10.1038/s41586-020-2183-2 (2020). [DOI] [PubMed] [Google Scholar]
- 12.Guo D et al. EGFR signaling through an Akt-SREBP-1-dependent, rapamycin-resistant pathway sensitizes glioblastomas to antilipogenic therapy. Sci Signal 2, ra82, doi: 10.1126/scisignal.2000446 (2009). [DOI] [PMC free article] [PubMed] [Google Scholar]
- 13.Guo D et al. An LXR agonist promotes GBM cell death through inhibition of an EGFR/AKT/SREBP-1/LDLR-dependent pathway. Cancer discovery 1, 442–456, doi: 10.1158/2159-8290.CD-11-0102 (2011). [DOI] [PMC free article] [PubMed] [Google Scholar]
- 14.Li C et al. SREBP-1 has a prognostic role and contributes to invasion and metastasis in human hepatocellular carcinoma. International journal of molecular sciences 15, 7124–7138, doi: 10.3390/ijms15057124 (2014). [DOI] [PMC free article] [PubMed] [Google Scholar]
- 15.Zhu Z et al. p54(nrb)/NONO regulates lipid metabolism and breast cancer growth through SREBP-1A. Oncogene 35, 1399–1410, doi: 10.1038/onc.2015.197 (2016). [DOI] [PubMed] [Google Scholar]
- 16.Sun Y et al. Role of transgelin-2 in diabetes-associated pancreatic ductal adenocarcinoma. Oncotarget 8, 49592–49604, doi: 10.18632/oncotarget.17519 (2017). [DOI] [PMC free article] [PubMed] [Google Scholar]
- 17.Gao Y et al. SREBP1 promotes the invasion of colorectal cancer accompanied upregulation of MMP7 expression and NF-kappaB pathway activation. BMC Cancer 19, 685, doi: 10.1186/s12885-019-5904-x (2019). [DOI] [PMC free article] [PubMed] [Google Scholar]
- 18.Sun LP, Seemann J, Goldstein JL & Brown MS Sterol-regulated transport of SREBPs from endoplasmic reticulum to Golgi: Insig renders sorting signal in Scap inaccessible to COPII proteins. Proc Natl Acad Sci U S A 104, 6519–6526, doi: 10.1073/pnas.0700907104 (2007). [DOI] [PMC free article] [PubMed] [Google Scholar]
- 19.Espenshade PJ, Cheng D, Goldstein JL & Brown MS Autocatalytic processing of site-1 protease removes propeptide and permits cleavage of sterol regulatory element-binding proteins. J Biol Chem 274, 22795–22804, doi: 10.1074/jbc.274.32.22795 (1999). [DOI] [PubMed] [Google Scholar]
- 20.Cheng D et al. Secreted site-1 protease cleaves peptides corresponding to luminal loop of sterol regulatory element-binding proteins. J Biol Chem 274, 22805–22812, doi: 10.1074/jbc.274.32.22805 (1999). [DOI] [PubMed] [Google Scholar]
- 21.Rawson RB et al. Complementation cloning of S2P, a gene encoding a putative metalloprotease required for intramembrane cleavage of SREBPs. Mol Cell 1, 47–57, doi: 10.1016/s1097-2765(00)80006-4 (1997). [DOI] [PubMed] [Google Scholar]
- 22.Duncan EA, Dave UP, Sakai J, Goldstein JL & Brown MS Second-site cleavage in sterol regulatory element-binding protein occurs at transmembrane junction as determined by cysteine panning. J Biol Chem 273, 17801–17809, doi: 10.1074/jbc.273.28.17801 (1998). [DOI] [PubMed] [Google Scholar]
- 23.Hua X, Sakai J, Brown MS & Goldstein JL Regulated cleavage of sterol regulatory element binding proteins requires sequences on both sides of the endoplasmic reticulum membrane. J Biol Chem 271, 10379–10384, doi: 10.1074/jbc.271.17.10379 (1996). [DOI] [PubMed] [Google Scholar]
- 24.Yang T et al. Crucial step in cholesterol homeostasis: sterols promote binding of SCAP to INSIG-1, a membrane protein that facilitates retention of SREBPs in ER. Cell 110, 489–500, doi: 10.1016/s0092-8674(02)00872-3 (2002). [DOI] [PubMed] [Google Scholar]
- 25.Yabe D, Brown MS & Goldstein JL Insig-2, a second endoplasmic reticulum protein that binds SCAP and blocks export of sterol regulatory element-binding proteins. Proc Natl Acad Sci U S A 99, 12753–12758, doi: 10.1073/pnas.162488899 (2002). [DOI] [PMC free article] [PubMed] [Google Scholar]
- 26.Espenshade PJ, Li WP & Yabe D Sterols block binding of COPII proteins to SCAP, thereby controlling SCAP sorting in ER. Proceedings of the National Academy of Sciences of the United States of America 99, 11694–11699, doi: 10.1073/pnas.182412799 (2002). [DOI] [PMC free article] [PubMed] [Google Scholar]
- 27.Adams CM, Goldstein JL & Brown MS Cholesterol-induced conformational change in SCAP enhanced by Insig proteins and mimicked by cationic amphiphiles. Proceedings of the National Academy of Sciences of the United States of America 100, 10647–10652, doi: 10.1073/pnas.1534833100 (2003). [DOI] [PMC free article] [PubMed] [Google Scholar]
- 28.Cheng C et al. Glucose-Mediated N-glycosylation of SCAP Is Essential for SREBP-1 Activation and Tumor Growth. Cancer Cell 28, 569–581, doi: 10.1016/j.ccell.2015.09.021 (2015). [DOI] [PMC free article] [PubMed] [Google Scholar]
- 29.Guo D SCAP links glucose to lipid metabolism in cancer cells. Molecular & Cellular Oncology, doi:DOI: 10.1080/23723556.2015.1132120 (2016). [DOI] [PMC free article] [PubMed] [Google Scholar]
- 30.Shao W & Espenshade PJ Sugar Makes Fat by Talking to SCAP. Cancer Cell 28, 548–549, doi: 10.1016/j.ccell.2015.10.011 S1535-6108(15)00388-8 [pii] (2015). [DOI] [PMC free article] [PubMed] [Google Scholar]
- 31.Cheng C et al. Analysis of SCAP N-glycosylation and Trafficking in Human Cells. J Vis Exp, doi: 10.3791/54709 (2016). [DOI] [PMC free article] [PubMed] [Google Scholar]
- 32.Yang L, Venneti S & Nagrath D Glutaminolysis: A Hallmark of Cancer Metabolism. Annu Rev Biomed Eng 19, 163–194, doi: 10.1146/annurev-bioeng-071516-044546 (2017). [DOI] [PubMed] [Google Scholar]
- 33.Pavlova NN & Thompson CB The Emerging Hallmarks of Cancer Metabolism. Cell Metab 23, 27–47, doi: 10.1016/j.cmet.2015.12.006 (2016). [DOI] [PMC free article] [PubMed] [Google Scholar]
- 34.Hensley CT, Wasti AT & DeBerardinis RJ Glutamine and cancer: cell biology, physiology, and clinical opportunities. J Clin Invest 123, 3678–3684, doi: 10.1172/JCI69600 (2013). [DOI] [PMC free article] [PubMed] [Google Scholar]
- 35.Cheng X, Geng F & Guo D DGAT1 protects tumor from lipotoxicity, emerging as a promising metabolic target for cancer therapy. Mol Cell Oncol 7, 1805257, doi: 10.1080/23723556.2020.1805257 (2020). [DOI] [PMC free article] [PubMed] [Google Scholar]
- 36.Wu X et al. Lipid Droplets Maintain Energy Homeostasis and Glioblastoma Growth via Autophagic Release of Stored Fatty Acids. iScience 23, 101569, doi: 10.1016/j.isci.2020.101569 (2020). [DOI] [PMC free article] [PubMed] [Google Scholar]
- 37.Venneti S et al. Glutamine-based PET imaging facilitates enhanced metabolic evaluation of gliomas in vivo. Sci Transl Med 7, 274ra217, doi: 10.1126/scitranslmed.aaa1009 (2015). [DOI] [PMC free article] [PubMed] [Google Scholar]
- 38.Reinfeld BI et al. Cell-programmed nutrient partitioning in the tumour microenvironment. Nature 593, 282–288, doi: 10.1038/s41586-021-03442-1 (2021). [DOI] [PMC free article] [PubMed] [Google Scholar]
- 39.Altman BJ, Stine ZE & Dang CV From Krebs to clinic: glutamine metabolism to cancer therapy. Nat Rev Cancer 16, 749, doi: 10.1038/nrc.2016.114 (2016). [DOI] [PubMed] [Google Scholar]
- 40.Tanaka K et al. Compensatory glutamine metabolism promotes glioblastoma resistance to mTOR inhibitor treatment. J Clin Invest 125, 1591–1602, doi: 10.1172/JCI78239 (2015). [DOI] [PMC free article] [PubMed] [Google Scholar]
- 41.Grkovski M et al. Pharmacokinetic Assessment of (18)F-(2S,4R)-4-Fluoroglutamine in Patients with Cancer. J Nucl Med 61, 357–366, doi: 10.2967/jnumed.119.229740 (2020). [DOI] [PMC free article] [PubMed] [Google Scholar]
- 42.Dunphy MPS et al. In Vivo PET Assay of Tumor Glutamine Flux and Metabolism: In-Human Trial of (18)F-(2S,4R)-4-Fluoroglutamine. Radiology 287, 667–675, doi: 10.1148/radiol.2017162610 (2018). [DOI] [PMC free article] [PubMed] [Google Scholar]
- 43.McBrayer SK et al. Transaminase Inhibition by 2-Hydroxyglutarate Impairs Glutamate Biosynthesis and Redox Homeostasis in Glioma. Cell 175, 101–116 e125, doi: 10.1016/j.cell.2018.08.038 (2018). [DOI] [PMC free article] [PubMed] [Google Scholar]
- 44.Curthoys NP & Watford M Regulation of glutaminase activity and glutamine metabolism. Annu Rev Nutr 15, 133–159, doi: 10.1146/annurev.nu.15.070195.001025 (1995). [DOI] [PubMed] [Google Scholar]
- 45.Li T & Le A Glutamine Metabolism in Cancer. Adv Exp Med Biol 1063, 13–32, doi: 10.1007/978-3-319-77736-8_2 (2018). [DOI] [PubMed] [Google Scholar]
- 46.Eng CH, Yu K, Lucas J, White E & Abraham RT Ammonia derived from glutaminolysis is a diffusible regulator of autophagy. Sci Signal 3, ra31, doi: 10.1126/scisignal.2000911 (2010). [DOI] [PubMed] [Google Scholar]
- 47.Liu Y et al. The role of ASCT2 in cancer: A review. Eur J Pharmacol 837, 81–87, doi: 10.1016/j.ejphar.2018.07.007 (2018). [DOI] [PubMed] [Google Scholar]
- 48.Nohturfft A, Yabe D, Goldstein JL, Brown MS & Espenshade PJ Regulated step in cholesterol feedback localized to budding of SCAP from ER membranes. Cell 102, 315–323, doi: 10.1016/s0092-8674(00)00037-4 (2000). [DOI] [PubMed] [Google Scholar]
- 49.Ghanakota P & Carlson HA Driving Structure-Based Drug Discovery through Cosolvent Molecular Dynamics. J Med Chem 59, 10383–10399, doi: 10.1021/acs.jmedchem.6b00399 (2016). [DOI] [PMC free article] [PubMed] [Google Scholar]
- 50.Yan R et al. A structure of human Scap bound to Insig-2 suggests how their interaction is regulated by sterols. Science 371, doi: 10.1126/science.abb2224 (2021). [DOI] [PubMed] [Google Scholar]
- 51.Kober DL et al. Scap structures highlight key role for rotation of intertwined luminal loops in cholesterol sensing. Cell, doi: 10.1016/j.cell.2021.05.019 (2021). [DOI] [PMC free article] [PubMed] [Google Scholar]
- 52.Brown MS & Goldstein JL Cholesterol feedback: from Schoenheimer’s bottle to Scap’s MELADL. J Lipid Res 50 Suppl, S15–27, doi: 10.1194/jlr.R800054-JLR200 (2009). [DOI] [PMC free article] [PubMed] [Google Scholar]
- 53.Geng F et al. Inhibition of SOAT1 Suppresses Glioblastoma Growth via Blocking SREBP-1-Mediated Lipogenesis. Clin Cancer Res 22, 5337–5348, doi: 10.1158/1078-0432.CCR-15-2973 (2016). [DOI] [PMC free article] [PubMed] [Google Scholar]
- 54.Cheng X et al. Targeting DGAT1 Ameliorates Glioblastoma by Increasing Fat Catabolism and Oxidative Stress. Cell Metab 32, 229–242 e228, doi: 10.1016/j.cmet.2020.06.002 (2020). [DOI] [PMC free article] [PubMed] [Google Scholar]
- 55.Ru P et al. Feedback Loop Regulation of SCAP/SREBP-1 by miR-29 Modulates EGFR Signaling-Driven Glioblastoma Growth. Cell Rep 16, 1527–1535, doi: 10.1016/j.celrep.2016.07.017 (2016). [DOI] [PMC free article] [PubMed] [Google Scholar]
- 56.Walker V Ammonia metabolism and hyperammonemic disorders. Adv Clin Chem 67, 73–150, doi: 10.1016/bs.acc.2014.09.002 (2014). [DOI] [PubMed] [Google Scholar]
- 57.Braissant O, McLin VA & Cudalbu C Ammonia toxicity to the brain. J Inherit Metab Dis 36, 595–612, doi: 10.1007/s10545-012-9546-2 (2013). [DOI] [PubMed] [Google Scholar]
- 58.Kim J et al. CPS1 maintains pyrimidine pools and DNA synthesis in KRAS/LKB1-mutant lung cancer cells. Nature 546, 168–172, doi: 10.1038/nature22359 (2017). [DOI] [PMC free article] [PubMed] [Google Scholar]
- 59.Spinelli JB et al. Metabolic recycling of ammonia via glutamate dehydrogenase supports breast cancer biomass. Science 358, 941–946, doi: 10.1126/science.aam9305 (2017). [DOI] [PMC free article] [PubMed] [Google Scholar]
- 60.Feramisco JD et al. Intramembrane aspartic acid in SCAP protein governs cholesterol-induced conformational change. Proc Natl Acad Sci U S A 102, 3242–3247, doi: 10.1073/pnas.0500206102 (2005). [DOI] [PMC free article] [PubMed] [Google Scholar]
- 61.Webb B & Sali A Comparative Protein Structure Modeling Using MODELLER. Curr Protoc Bioinformatics 54, 5 6 1–5 6 37, doi: 10.1002/cpbi.3 (2016). [DOI] [PMC free article] [PubMed] [Google Scholar]
- 62.Jo S, Kim T, Iyer VG & Im W CHARMM-GUI: a web-based graphical user interface for CHARMM. J Comput Chem 29, 1859–1865, doi: 10.1002/jcc.20945 (2008). [DOI] [PubMed] [Google Scholar]
- 63.Wu EL et al. CHARMM-GUI Membrane Builder toward realistic biological membrane simulations. J Comput Chem 35, 1997–2004, doi: 10.1002/jcc.23702 (2014). [DOI] [PMC free article] [PubMed] [Google Scholar]
- 64.Jorgensen WL, Chandrasekhar J, Madura JD, Impey RW & Klein ML Comparison of simple potential functions for simulating liquid water. The Journal of Chemical Physics 79, 926–935, doi: 10.1063/1.445869 (1983). [DOI] [Google Scholar]
- 65.Zoete V, Cuendet MA, Grosdidier A & Michielin O SwissParam: a fast force field generation tool for small organic molecules. J Comput Chem 32, 2359–2368, doi: 10.1002/jcc.21816 (2011). [DOI] [PubMed] [Google Scholar]
- 66.Bussi G, Donadio D & Parrinello M Canonical sampling through velocity rescaling. J Chem Phys 126, 014101, doi: 10.1063/1.2408420 (2007). [DOI] [PubMed] [Google Scholar]
- 67.Pronk S et al. GROMACS 4.5: a high-throughput and highly parallel open source molecular simulation toolkit. Bioinformatics 29, 845–854, doi: 10.1093/bioinformatics/btt055 (2013). [DOI] [PMC free article] [PubMed] [Google Scholar]
- 68.Vanommeslaeghe K & MacKerell AD Jr. Automation of the CHARMM General Force Field (CGenFF) I: bond perception and atom typing. J Chem Inf Model 52, 3144–3154, doi: 10.1021/ci300363c (2012). [DOI] [PMC free article] [PubMed] [Google Scholar]
- 69.Vanommeslaeghe K et al. CHARMM general force field: A force field for drug-like molecules compatible with the CHARMM all-atom additive biological force fields. J Comput Chem 31, 671–690, doi: 10.1002/jcc.21367 (2010). [DOI] [PMC free article] [PubMed] [Google Scholar]
- 70.Humphrey W, Dalke A & Schulten K VMD: visual molecular dynamics. J Mol Graph 14, 33–38, 27–38, doi: 10.1016/0263-7855(96)00018-5 (1996). [DOI] [PubMed] [Google Scholar]
Associated Data
This section collects any data citations, data availability statements, or supplementary materials included in this article.
Supplementary Materials
Data Availability Statement
All data that support the findings of this study are available within the paper and its supplementary information files. RNA-seq data for Fig.1a, Fig.2f, and Extended Data Fig.1a are provided in Supplementary Data, and the raw data are deposited in the GEO repository (Accession: GSE199089; link: https://www.ncbi.nlm.nih.gov/geo/query/acc.cgi?acc=GSE199089).