

Summary
Visual motion provides rich geometrical cues about the three-dimensional configuration the world. However, how brains decode the spatial information carried by motion signals remains poorly understood. Here, we study a collision avoidance behavior in Drosophila as a simple model of motion-based spatial vision. With simulations and psychophysics, we demonstrate that walking Drosophila exhibit a pattern of slowing to avoid collisions by exploiting the geometry of positional changes of objects on near-collision courses. This behavior requires the visual neuron LPLC1, whose tuning mirrors the behavior and whose activity drives slowing. LPLC1 pools inputs from object- and motion-detectors, and spatially biased inhibition tunes it to the geometry of collisions. Connectomic analyses identified circuitry downstream of LPLC1 that faithfully inherits its response properties. Overall, our results reveal how a small neural circuit solves a specific spatial vision task by combining distinct visual features to exploit universal geometrical constraints of the visual world.
eTOC blurb
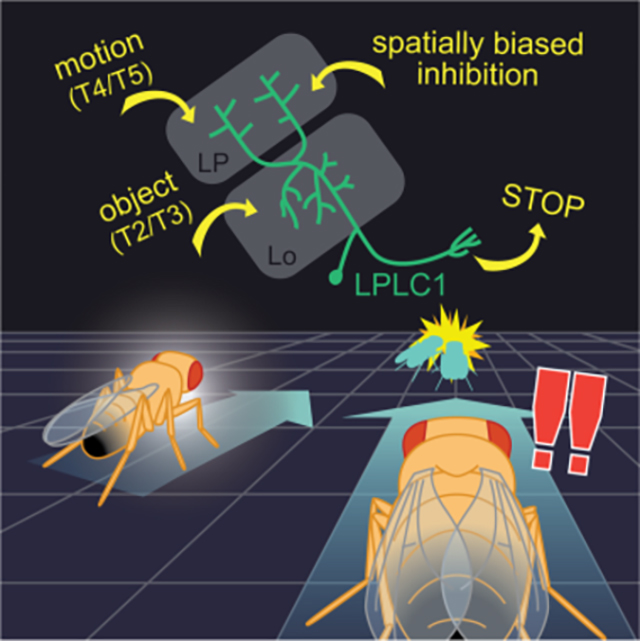
Visual motion contains rich information about space, but how brains decode spatial information to guide specific behaviors remains poorly understood. Tanaka and Clark show how Drosophila LPLC1 neurons implement a selective collision avoidance behavior by pooling outputs of motion and object detectors, as well as spatially biased inhibition.
Graphical Abstract
Introduction
The problem of spatial vision addresses how we can sense three-dimensional configurations of our surroundings from the “flat” images on our retinas. This problem has long been a central issue in vision science1,2. In solving this problem, visual motion is a particularly useful source of spatial information, since the pattern of retinal motion caused by relative movements between an observer and its environment follows lawful geometry3. Indeed, neuroanatomical and physiological studies in primates have established that motion-sensitive cortical visual areas, like area MT, comprise a part of the so-called “where” pathway4,5 and contribute to the perception of three-dimensional structures based on motion cues6. However, circuit-level understanding of how spatial information carried by visual motion is decoded to guide specific behaviors remains largely missing. A useful model system to explore the mechanism of motion-based spatial vision is the fruit fly Drosophila, where powerful genetic7 and connectomic8 tools allow one to dissect neural circuit mechanisms in detail. In addition, recent years have seen rapid progress in understanding the motion detection circuitry in the Drosophila visual system9,10, which can now guide attempts to pinpoint neural mechanisms of spatial vision in flies.
For many animals, one routine task that requires spatial vision is avoiding collisions with other animals. Collision with predators poses an obvious survival threat to animals, and unwanted collisions with conspecifics can compromise navigation or tactile communication, even when there is no risk of predation. As objects move relative to the observer, geometry dictates the size and position of their retinal images over time. Objects approaching the observer expand in apparent size, or ‘loom’, providing a useful and well-studied collision cue11,12. Importantly, beyond the change in size, change in an object’s position can also provide useful cues about impending collisions: provided an observer and an approaching object both maintain constant velocities, the retinal position of the object stays constant only if it is on a collision course, a situation analogous to “constant bearing, decreasing range” in maritime navigation13. Similarly, approaching objects will move back-to-front from the perspective of the observer if they will cross in front of the observer, or will move front-to-back if they will cross behind the observer (Figure 1A). Objects crossing in front of the forward-moving observer pose asymmetrically larger collision risks to than ones crossing behind, because they can collide with the observer by simply stopping or slowing. Thus, back-to-front motion, which predicts frontal path crossings, can be used as a heuristic geometrical cue to prevent collisions. Indeed, a previous study demonstrated that freely walking flies halt upon observing other flies or small magnetic robots moving back-to-front14, a strategy that could avoid collisions with conspecifics15. However, the circuits governing such collision avoidance based on directional motion remain unknown.
Figure 1. Flies exhibit slowing that mirrors geometry of collisions.

(A) Geometry of collisions. Objects crossing the path in front of an observer appear to move in the back-to-front (btf) direction across the retina, whereas ones crossing behind the observer will appear to move front-to-back (ftb). (B) A schematic of the simulation. Linearly translating circular objects were placed at random around an observer that moved forward at a constant velocity. The collision risk posed by the object was calculated based on their future path-crossing intercept. (C) Immediate collision risk, defined as time-discounted inverse of positive future intercept (see Methods for details), as a function of angular position and velocity. Odd and even quadrants respectively correspond to front-to-back and back-to-front motion. (D) (left) When an object is on an exact collision course with the observer, the relative bearing (θ) of the observer remains constant. (right) An object that crosses the path in front of the observer at an acute angle decrease its bearing as they approach, causing back-to-front motion. (E) Schematic of the setup for the behavioral experiments in which flies walked on a spherical treadmill while they were presented with panoramic visual stimuli. (F) In the approach stimuli, simulated black circular objects with 2 mm height and 3 mm width approached the fly obliquely either from the front (ftb) or from the back (btf) for 8/3 seconds. The initial position of the objects was 30 mm to the side and 30 mm in front or behind the fly. The speed of the object was 15 mm/s along the axis parallel to the fly, and 7.5 mm/s along the axis perpendicular to the fly. These numbers translate to average apparent angular velocity of 30 °/s and size expansion from 4° to 13°. See also Video S1. (G, H) Wildtype fly normalized walking response to the approach stimuli in either direction, (G) as a function of time or (H) time-averaged. Forward walking speed was normalized by the baseline speed during the preceding interstimulus period, which is indicated by horizontal dotted line. The vertical dotted lines mark the beginning and the end of the stimulus. Each dot in (H) represents a fly, and data from the same flies are connected with gray lines. See Figure S1A for the associated turning responses. (I) In the parallel stimuli, simulated black rectangular objects appeared by the fly and remained stationary for 2 seconds, moved in a trajectory parallel to the fly in either direction for one second, stopped for another 2 seconds, and then disappeared. The object was 2 mm tall and 3 mm wide, and its initial position was 25 mm to the side and 15 mm in front or behind the fly. These numbers translated to average angular velocity of 60 °/s and apparent size of 5° to 7°. See also Video S1. (J, K) Same as (G, H), but for the parallel stimuli. Time-averaged responses were calculated within the shaded region in (J). The vertical dotted lines and the shaded regions respectively represent on-and offset of the object and the period during which the object was moving. See Figure S1B for the associated turning responses. (L) Schematic of the stimuli used to test the interaction between the collision avoidance behavior and background motion. A 10° × 10° black square moved azimuthally at 60 °/s in either way on the background of a half-contrast, 5° resolution checkerboard that rotated around the fly horizontally at a velocity between −60 to 60 °/s. (M) Wildtype fly normalized walking response to squares moving in either direction (top: back-to-front, bottom: front-to-back), paired with rotating backgrounds. The velocity of the background is color-coded. The gray shaded region indicates when the object was moving. (N) Time-averaged normalized walking responses of wildtype flies to squares moving in either direction, as functions of background velocities. Averaging was within the shaded region in (M). Positive velocity is in the same direction as back-to-front (btf). See Figure S1C for the associated turning responses. (O) Time-averaged normalized walking speed in response to squares when the background was moving with the square minus when the background was moving against the square, for each background speed. (P) To probe retinotopic bias in the direction selective slowing, black 10° squares sweeping 30° long horizontal trajectories in either direction at 60 °/s were presented at various azimuthal locations. (Q, R) Time-averaged normalized walking response of wildtype flies to the azimuth sweep stimuli as functions of azimuth, either (Q) by the motion directions or (R) the difference between the two. The averaging window was 1 second long from the onset of the stimuli. See Figure S1D for the associated turning responses. Error bars and shades around mean traces all indicate standard error of the mean. (G, H) N = 21 flies. (J, K) N = 19 flies. (M-O) N = 19 flies. (Q, R) N = 39 flies. n. s.: not significant (p> .05); *: p < .05; **: p < .01; ***: p < .001; ****: p < .0001 in Wilcoxon signed-rank test or Friedman test (R only).
Here, we investigate how Drosophila uses positional changes to avoid collision at both behavioral and circuit levels. First, by combining simulations and high-throughput psychophysics, we demonstrate that the flies exhibit a pattern of slowing that avoids collisions by exploiting the positional geometry associated with them. Second, using synaptic silencing and optogenetics, we show that a visual projection neuron called LPLC1 is necessary for this collision avoidance behavior, and activating LPLC1 elicits slowing. LPLC1’s response properties, as measured with two-photon calcium imaging, mirror the tuning of the collision avoidance behavior, including a spatial bias in direction selectivity concordant with the positional geometry of collisions. Third, we show that LPLC1 combines excitatory inputs from elementary motion and object detectors, and achieves selectivity for objects on near-collision courses in part through spatially biased glutamatergic inhibition. Last, we identify a central brain pathway for this collision avoidance and show that it faithfully inherits response properties of LPLC1. Overall, the results reveal how signals from motion and object detectors can be combined to implement a solution for a spatial vision task that exploits universal geometrical constraints of the visual world.
Results
Back-to-front motion is a useful terrestrial collision cue
As objects move relative to an observer, their apparent size and position change systematically as dictated by geometry. There are at least two reasons to think that back-to-front motion in particular can be a useful heuristic cue to detect and avoid collisions with objects. First, back-to-front motion is salient against optic flow during forward locomotion. Because optic flow caused by forward translation always moves front-to-back, back-to-front motion observed during forward locomotion can be unambiguously attributed to non-stationary objects in the surroundings14, which could potentially collide with the observer. Second, back-to-front motion can predict path crossings in front, which can pose collision risks. An approaching object will appear moving in the back-to-front direction if it is about to cross in front of the observer, and will appear to move front-to-back if it will cross behind the observer (Figure 1A). If the approaching object is an animal, it could stop while crossing in front of the observer, which would pose a risk of collision if the observer is moving forward. To gain better intuition about how and when back-to-front motion is useful to predict frontal path crossings, we simulated an observer moving forward in the presence of objects with random relative positions and constant random velocities (Figure 1B). We quantified how each object contributed to the ‘immediate collision risk’, defined as the time-discounted, inverted intercept between the observer and object trajectories (see Methods for details of the simulation).
When we plotted the collision risk against retinal angular position and angular velocity of the object (Figure 1C), there were two pairs of clusters with high collision risk: one around zero angular velocity and the other around large angular velocities in the back-to-front direction. The zero-velocity clusters correspond to the “constant bearing, decreasing range” situation (Figure 1D), where the object is directly intercepting the observer. A second cluster with higher back-to-front velocities represents nearby objects about to cross in front of the observer at acute angles (Figure 1D). In these higher velocity clusters, the collision risk was higher for lateral rather than for directly frontal objects (Figure 1C). This is because objects moving laterally right in front of the observer tend to cross the observer’s path long before the observer reaches that location. These results suggest that back-to-front motion of objects predicts imminent near-collisions in front, especially in the frontolateral visual field.
Drosophila shows direction selective slowing in response to stimuli mimicking conspecifics
With the above geometrical results in mind, we designed experiments to characterize how flies respond to visual objects moving in different directions in our high throughput psychophysics assay. In our assay, tethered flies were placed above air-suspended balls, and their walking responses were recorded as the rotation of the balls16,17. Visual stimuli were presented on panoramic screens surrounding the flies (Figure 1E). All stimuli were presented independently from the flies’ behavior (i. e., open loop). First, we presented a black object that linearly approached the fly from the side with a constant velocity in a simulated Cartesian coordinate (hereafter ‘approach stimulus’; See Video S1 as well as Methods for details). The object was 2 mm tall and 3 mm wide, and its trajectory started from 30 mm to the side and 30 mm to the front or the back of the fly. The velocities of the object along the axes parallel and perpendicular to the fly’s heading were respectively 15 and 7.5 mm/s, and it was presented for 8/3 seconds. The size and velocity of the object were approximately matched to the realistic size and walking velocity of Drosophila18,19. Here, only the objects starting from behind the fly are projected to cross in front of the observer fly. From the fly’s perspective, the objects starting behind appeared to move back-to-front, while those appearing in front appeared to move front-to-back, and both expanded modestly in size identically over time (Figure 1F). The average apparent angular velocity of the objects was 30 °/s, and their minimum and maximum apparent angular widths were respectively around 4° and 13°. Wildtype flies slowed slightly in response to the front-starting approach stimulus, but slowed substantially more and for a longer duration in response to the rear-starting approach stimuli (Figure 1G, H). Note that, flies tend to control their walking in a discrete bout-like fashion19, and the trial-averaged walking speed does not necessarily represent their walking dynamics on a trial-by-trial basis.
This differential slowing is consistent with the idea that flies use direction of object motion to initiate slowing to prevent collision, as previously proposed14. However, in addition to their apparent direction of motion, the front- and rear-starting approach stimuli were also different in terms of where their angular size reached maxima. In particular, while the back-to-front object appeared largest in front of the fly, front-to-back object appeared largest behind the fly. Thus, it is conceivable that the apparent directional bias in the slowing behavior (Figure 1G, H) was driven by different responses to larger objects in front versus behind. To test if flies are capable of using directional motion cues to prevent collisions, we next simulated a rectangular object that moved parallel to the fly again in a Cartesian coordinate (hereafter ‘parallel stimulus’) (Figure 1I, Video S1). The object was 2 mm tall and 3 mm wide, and its trajectory started from 25 mm to the side and 15 mm to the front or the back of the fly. The velocity of the object was 30 mm/s. From the fly’s perspective, the object moved at the average angular velocity of 60 °/s, and its apparent angular size virtually remained between 5° to 7°. The object also waited 2 s after appearing on the screen before starting to move, so that we can disentangle genuine motion responses from initial startle responses, which can be position-dependent.
Wildtype flies presented with the parallel stimuli again slowed significantly more in response to rear-starting conditions (Figure 1J, K). Because the front- and rear-starting parallel stimuli are trajectory-matched and contain virtually no looming, this result strongly suggests that the observed slowing behavior is genuinely selective for the direction of object motion. Given that back-to-front motion predicts imminent path crossings in front (Figure 1C), selective slowing to back-to-front object motion can function as an algorithm to reduce risks of collision. Selective slowing to the back-to-front parallel object here amounts to a false alarm since the object will never cross the path of the fly. However, freely walking flies have also been reported to exhibit freezing in response to such stimuli14. In addition to slowing, both approach and parallel stimuli also elicited mild turning against the position of the objects and against the direction of the object motion (Figure S1A, B)20,21. Overall, these results suggest that flies selectively initiate slowing in response to visual motion in the back-to-front direction, which can reduce the risk of colliding with objects crossing in front.
The pattern of direction selective slowing mirrors the geometry of collision
One of the reasons why back-to-front motion can be a useful collision cue is that it is directed counter to the optic flow from forward translation and thus can be unambiguously attributed to moving objects. This argument suggests that flies would exhibit the direction-selective slowing behavior even in the presence of cluttered, moving backgrounds, as long as objects and backgrounds are moving against each other. To test this hypothesis, we presented wildtype flies with 10° × 10° black squares translating against half-contrast, 5° resolution random checkerboard patterns that rotated around the fly at several velocities (Figure 1L). Note that all horizontally translating object stimuli introduced hereafter are generated in simulated cylindrical coordinates and possess only azimuthal motion with no changes in size. Rotational, rather than translational background was used, since translational optic flow presented in an open-loop manner by itself potently slows flies22, making it difficult to observe additional slowing induced by objects. Overall, rotating backgrounds, especially fast ones, suppressed the slowing caused by moving objects (Figure 1M, N), in addition to causing mild slowing and strong turning (Figure S1C). Interestingly, while slowing caused by a front-to-back object was suppressed equally by backgrounds moving either direction, flies slowed significantly more to an object moving in the back-to-front direction when it is on a background moving against rather than with the object (Figure 1O). This result indicates that flies use relative motion between object and background, in addition to the directionality of object motion itself, to initiate slowing.
Last, we asked if there is any spatial bias in the observed slowing behavior that could match the geometry of frontal path crossing. In our simulation, we observed that back-to-front motion strongly predicted collision risks especially around 60° to 80° azimuth (Figure 1C). To test this idea, we presented a small square sweeping a short horizontal trajectory in either direction at different azimuthal locations (Figure 1P). Objects in front elicited more slowing in wildtype flies regardless of direction, and slowing was selective for back-to-front direction at all azimuths (Figure 1Q). However, the directional difference in slowing showed a U-shaped pattern, peaking at around 80° azimuth (Figure 1R). This result implies that the direction selectivity of the slowing behavior is strongest in the same azimuthal range where back-to-front motion most strongly predicts future collision (Figure 1C). Note that these stimuli also caused flies to turn against the position of the objects and against the direction of the object motion, similar to the approach and parallel stimuli (Figure S1D).
LPLC1 is necessary for direction selective slowing induced by small moving objects and its activation causes slowing
We next worked to identify neural substrates for this collision avoidance behavior. Since the slowing is selective for the direction of object motion, we hypothesized that synaptic outputs of T4 and T5 neurons, the first direction selective cells in the fly visual system23, would be necessary for the behavior. When we silenced the synaptic output of T4 and T5 by introducing shibirets 24 to these cells, slowing in response to back-to-front parallel stimuli was significantly reduced compared to the genetic controls (Figure 2A, B), while slowing in response to front-to-back stimuli was significantly increased, almost abolishing the direction selectivity in the behavior. This result shows that outputs of T4/T5 are required for the direction selective slowing. Similarly, silencing T4 and T5 significantly reduced fly slowing in response to back-to-front approach stimuli (Figure S2A, B). In addition, T4/T5-silenced flies always turned away from the position of the objects regardless of direction of motion (Figure S2E, F).
Figure 2. LPLC1 is necessary for collision avoidance and sufficient to cause slowing.

(A, B) Normalized walking responses of T4/T5 silenced flies and their controls in response to the parallel stimuli, (A) over time or (B) averaged over time, as in Figure 1J, K. See also Figure S2A, B, E, F. (C, D) Same as (A, B), but for LPLC1. See also Figure S2C, D, E–I. (E) Time-averaged walking responses of (top) T4/T5 or (bottom) LPLC1 silenced flies with their respective controls to the azimuth sweep stimuli by directions, as in Figure 1Q. See also Figure S2J for the associated turning responses. (F) The directional differences of the walking responses of the same flies as in (E) to the azimuth sweep stimuli, as in Figure 1R. (G) A schematic of the optogenetics setup. (H, I) Walking response of LPLC1>Chrimson flies with or without ATR feeding to pulses of green light, either (H) over time or (I) time-averaged. The averaging window was 1 second long. Horizontal lines in (H) indicate the duration during which the light stimulation was on for each trace of corresponding colors. Error bars and shades around mean traces all indicate standard error of the mean. (A, B) N = 19 (T4/T5>shi), 17 (T4/T5>+), 22 (empty>shi) flies. (C, D) N = 20 (LPLC1 >shi), 17 (LPLC1>+), 22 (empty>shi) flies. (E, F) N = 18 (T4/T5>shi), 20 (T4/T5>+), 19 (LPLC1>shi), 16 (LPLC1>+), 19 (empty>shi) flies. (H, I) N = 13 (ATR+), 12 (ATR−) flies. n. s.: not significant (p >.05); *: p < .05; **: p < .01; ***: p < .001; ****: p < .0001 in Wilcoxon rank sum test (B, D-F) and 2-way analysis of variance (ANOVA) (I; the main effect of ATR conditions). Colored and black stars indicate the comparisons between the experimental and Gal4-only or UAS-only controls, respectively.
Next, we aimed to identify neurons downstream of T4/T5 that selectively respond to objects moving back-to-front to trigger the slowing behavior. Lobula plate (LP), the neuropil where T4/T5 axon terminals reside, is innervated by several types of columnar visual projection neurons (VPNs)25–30. Columnar VPNs detect specific local visual features and can trigger a variety of behaviors21,26,28,30–34, so they make good candidates for the putative back-to-front moving object detector. Among the known LP-innervating columnar VPN types, LPLC2 has been shown to detect visual loom and drive escape responses31,32 and LPC1 and LLPC1 to detect translational optic flow and drive slowing28,30. Among remaining LP-innervating VPNs with no known function, a neuron called lobula plate-lobula columnar cell type 1 (LPLC1) is particularly well positioned to detect objects moving back-to-front, because it innervates layer 2 of LP, which houses T4/T5 terminals tuned to back-to-front motion, but not the front-to-back-selective layer 123,26. To test whether LPLC1 is necessary for the slowing, we silenced synaptic outputs of LPLC1 by expressing shibirets, and examined its effect on the behavior. We found that flies with LPLC1 silenced slowed significantly less in response to the back-to-front parallel (Figure 2C, D) as well as approach stimuli (Figure S2C, D), indicating that LPLC1 is necessary for the wild-type slowing phenotype. In contrast to T4/T5, silencing of LPL1 did not qualitatively affect turning (Figure S2E, F). We also confirmed that silencing LPLC1 does not affect several other visuomotor behaviors known to be dependent on T4/T5 (Figure S2G–I).
We also tested how silencing either T4/T5 or LPLC1 affects the spatial bias in the slowing behavior (Figure 1P–R). Silencing T4 and T5 increased slowing in response to front-to-back objects in front, and reduced slowing in response to back-to-front objects on the side (Figure 2E). This reduced the direction selectivity of slowing across the almost all azimuth tested, abolishing the U-shaped pattern of directional difference in slowing visible in control genotypes (Figure 2F). Similarly, silencing LPLC1 reduced slowing in response to back-to-front objects across broad azimuths (Figure 2E). However, reduction in directional differences of slowing was only significant from the both of the two control genotypes at lateral azimuths (Figure 2F). This result suggests that direction selectivity of LPLC1 neurons is spatially biased and most pronounced in the frontolateral azimuthal range where back-to-front motion most strongly predicts near collision (Figure 1C). In addition to slowing, silencing T4/T5 also affected flies turning, especially to frontal objects moving back-to-front, whereas silencing of LPLC1 did not affect turning (Figure S2J).
To further confirm the involvement of LPLC1 in the slowing behavior, we optogenetically activated LPLC1 neurons in blind (norpA−) flies, and tested whether activity in LPLC1 can trigger slowing. Blind flies expressing a red-shifted channelrhodopsin Chrimson35 in LPLC1 were tethered on air suspended balls, and pulses of green light with various durations were shone onto the flies from the DLP projectors16,21 (Figure 2G). We compared the walking velocity changes in response to green light between flies fed with food with or without all-trans retinal (ATR) 36, a cofactor necessary for channelrhodopsin function. While flies fed with food without ATR did not show any response to green lights, flies fed with ATR exhibited duration-dependent slowing in response to green light (Figure 2H, I), showing that the activity of LPLC1 alone is sufficient to make flies slow.
Visual response properties of LPLC1 neurons mirror the tuning of the collision avoidance behavior
To better understand how LPLC1 contributes to this collision avoidance behavior, we next used two-photon calcium imaging to directly explore the visual tuning of LPLC1 neurons (Figure 3A). First, to broadly characterize their response properties, we imaged the axon terminals of LPLC1 neurons expressing GCaMP6f37 while presenting a variety of visual stimuli. The axon terminals of columnar VPNs including LPLC1 form structures called optic glomeruli, where retinotopy is mostly discarded (Otsuna and Ito, 2006; Panser et al., 2016; Wu et al., 2016 -- but see Morimoto et al., 2020). Thus, glomerular calcium activity can be interpreted as the spatially averaged population activity of LPLC1 neurons. We used a battery of stimuli consisting of full-field drifting square wave gratings (20° period, 60 °/s), full-field flashes, moving bars (10° wide, 60 °/s) and small squares (10° × 10°, 60 °/s), and expanding disks (initial radius 0°, terminal radius 60°). LPLC1 did not respond to wide field stimuli, while it did respond to moving bars and small squares (Figure 3B). As expected from the behavioral results, LPLC1’s responses to bars and squares were significantly selective for the back-to-front direction (Figure 3C), although the extent of the direction selectivity seemed weaker than that of behavior. LPLC1 vigorously responded to dark expanding disks, similar to several other types of columnar VPNs26,31–33,39.
Figure 3. Physiological response properties of LPLC1 match the tuning of the collision avoidance behavior.

(A) Schematic of the imaging setup. (B) Individual (light blue) and fly-averaged (dark blue) calcium responses of LPLC1 axon population over time to a variety of visual stimuli (horizontally moving bars and squares, looming, square wave gratings, full-field flashes). Leftward in the stimulus schematics correspond to the back-to-front direction. (C) Time-averaged population responses of LPLC1 axons to horizontally translating bars and squares by the stimulus directions. Each dot represents an individual fly, and data from the same fly are connected by a gray line. (D) Cell-averaged spatial tuning curves of LPLC1 main dendritic stalks, measured with translating black squares. See also Figure S3A, B. (E) The vertical and horizontal receptive field sizes of individual LPLC1 dendritic stalks, measured as the full-width quarter-maximum visual angles of Gaussian fit to individual spatial tuning curves. See also Figure S3C for the estimated receptive field locations. (F) Time-averaged responses of individual LPLC1 dendrites to 10° × 10° black squares that passed through their receptive field centers. (G-J) Responses of individual LPLC1 dendrites to horizontally translating rectangular objects with various (G, H) heights and (I, J) widths, either as (G, I) functions of time by sizes or (H, J) peak responses as functions of sizes by directions. Time traces are only shown for the back-to-front directions. See also Figure S3D–K. (K-M) LPLC1 dendrite responses to translating objects on rotating backgrounds, similar to behavioral results in Figure 1L–O. (K) Responses over time to different object directions and background velocities. Vertical dotted lines and the shaded region respectively indicate the on-/offset of the background and the period during which the object was moving. (L) Peak calcium response as functions of background velocity, by the directions of the object. Positive velocity is in the same direction as front-to-back. (M) Differences of peak calcium responses between when the background was moving with and against the object, for each background speed. (N) Average direction selectivity index (DSI) of lobula dendritic ROIs of LPLC1 expressing jGCaMP7b, as a function of their estimated azimuthal receptive field center location. See also Figure S3M–P. (O) The distribution of correlation between receptive field location and direction selectivity. Error bars and shading around mean traces all indicate standard error of the mean across flies (C, N, O) or cells (D-M). (B, C) N = 22 flies. (D-F) N = 80 (vertical), 60 (horizontal) cells. (G, H) N = 16 cells. (I, J) N = 12 cells. (K-M) N = 17 cells. (N, O) N = 37 flies. n. s.: not significant (p > .05); *: p < .05; **: p < .01; ***: p < .001; ****: p < .0001 in Wilcoxon signed-rank (C, M, O) or rank sum test (F).
To characterize the receptive field structure of LPLC1 neurons in more detail, we next recorded activity of individual LPLC1 neurons from their main dendritic stalks in lobula (Figure S3A). For each cell, we first estimated their receptive field (RF) with translating black squares21 (Figure S3B; see Methods), and then subsequent stimuli were centered around the estimated RF location (Figure S3C). On average, LPLC1 had a receptive field size of about 30° along both vertical and horizontal axes, measured as the full-width quarter-maximum value of the Gaussian fits (Figure 3E). In addition, the response of LPLC1 neurons to stimuli used for RF mapping were significantly direction selective in the back-to-front and up directions (Figure 3F).
We then measured the size tuning of LPLC1 by presenting horizontally translating rectangular objects with various heights and widths (Figure 3G–J). This resulted in a tuning curve peaking at 10° of height (Figure 3H), similar to several known lobula VPN types21,40,41. We confirmed that the LPLC1-dependent component of the slowing behavior is also tuned to small vertical sizes in an additional behavioral experiment (Figure S3D–G). This was in contrast to slowing caused by LPC1 neurons, another back-to-front selective visual projection neuron28,30, revealing a complementary vertical size tuning between LPLC1 and LPC1 (Figure S3F, G). On the other hand, LPLC1 was not tuned to objects with narrow width: rather, responses of LPLC1 increased up until the width of about 30° and saturated beyond that width (Figure 3I, J). LPLC1 showed relatively broad tuning to object velocity and tuning for low flicker frequencies (Figure S3H–K).
Next, we asked whether LPLC1 is itself sensitive to the relative motion between the objects and the background, as we found in the LPLC1-dependent slowing behavior (Figure 1L–O). To test this, we measured LPLC1’s response to traveling squares over rotating checkerboard backgrounds similar to the stimuli used in the behavioral experiment (Figure 1M). Overall, addition of moving background, especially fast ones, generally suppressed the response of LPLC1 neurons (Figure 3K, L), similar to the behavioral slowing responses. Again, similar to the behavioral results, LPLC1 responded significantly more to back-to-front objects on backgrounds moving against rather than with the objects (Figure 3M). This effect was weaker and not significant for front-to-back objects. This result suggests that the sensitivity to relative motion observed in the collision avoidance behavior is already computed at the level of LPLC1 calcium signals.
Lastly, we asked if the direction selectivity of LPLC1 population is spatially biased, a potential adaptation to the geometry of collisions (Figure 1C) and a bias observed in the behavioral experiments (Figure 1P–R). To this end, we recorded calcium responses in lobula dendrites of LPLC1 to rectangular objects sweeping long horizontal trajectories in either direction. We then calculated the direction selectivity of each dendritic ROI and plotted it against its estimated receptive field location (Figure 3N). Direction selectivity of each ROI was quantified as direction selectivity index (DSI), calculated as the difference divided by the sum of its peak responses to stimuli moving in the front-to-back and back-to-front directions. Across flies, we found a strong correlation between the direction-selectivity of LPLC1 neurons and their azimuthal location (Figure 3N, O), consistent with our earlier behavioral results. Thus, LPLC1 neurons are most direction selective in the regions of the visual field where direction is most predictive of a potential collision. Note that this spatial bias in direction selectivity partially explains the discrepancy in the magnitude of direction selectivity between the behavioral and imaging experiments: Stimuli in behavioral experiments were mostly presented to the side of the flies, whereas stimuli for axonal imaging as well as RF locations for dendritic imaging was centered about 40° azimuth (Figure S3C). In another set of experiments, we excluded the possibility that the discrepancy of direction selectivity between the behavioral and physiological experiments resulted from different behavioral states (Figure S3L–P).
LPLC1 receives inputs from T2, T3, and T4/T5
Having characterized physiological response properties of LPLC1 neurons, we next sought to obtain a mechanistic understanding how LPLC1 achieves these properties by combining its inputs. To identify neurons presynaptic to LPLC1, we turned to the hemibrain connectome dataset8. First, we aimed to confirm the assumption that LPLC1 neurons receive inputs from T4/T5 tuned to back-to-front, upward, and downward motion at layers 2, 3, 4 of the lobula plate (i.e. T4/T5 subtypes b, c, and d)26. While the hemibrain contains only a small fraction of lobula plate, it contains a large fraction of lobula as well as several labeled lobula plate tangential cells (LPTCs). Therefore, we hypothesized that we could still identify some T5 cells and examine their connectivity to LPLC1. Indeed, guided by their pre- and postsynapse innervations in lobula and lobula plate, connectivity to known LPTCs (or lack thereof), as well as their morphology, we were able to identify approximately 40 to 50 T5 cells in each of the four subtypes (Figures 4A, S4A) (See Methods for details). These numbers approximately amount to 5% of the total T5 population, but we believe this to be close to complete given the fraction of lobula plate included in the hemibrain dataset. See Data S1 for the complete list of identified T5 cells. About 20% of the all identified T5b, c, and d cells synapsed onto identified LPLC1 cells, with the total synapse counts of about 50 per type (Figure 4B). In contrast, we found only two synapses from T5a cells to LPLC1 (Figure 4B). This observation supports the hypothesis that LPLC1 receives inputs from T5 at all layers of lobula plate it innervates (i. e., layers 2, 3, and 4). Beyond those anatomical connections, to confirm the functional connectivity between T4/T5 and LPLC1, we optogenetically activated the T4/T5 cells expressing Chrimson35 with a diode laser, while monitoring the axonal calcium activity of LPLC1 with jGCaMP7b. As expected, activation of T4/T5 resulted in large LPLC1 calcium transients in flies fed with ATR compared to negligible transients in control animals without ATR (Figure 4C, D).
Figure 4. Input circuitry of LPLC1.

(A) Examples of T5 cells in the hemibrain dataset, with the four subtypes coded by different colors. Characteristic layered innervation in lobul aplate (LP) and somata in lobula plate cortex are visible. See also Figure S4A. (B) Connectivity from T5 cells onto LPLC1 by T5 subtypes, quantified by (top) the total number of synapses and (bottom) fraction of identified T5 cells connected to LPLC1. (C, D) Calcium response of LPLC1 to optogenetic stimulation of T4/T5 in flies with or without ATR feeding, either as (B) functions of time or (C) time-averaged. (E) Morphology of putative T2 and T3 axons from the hemibrain dataset (left), alongside with Golgi staining based morphology of T2 and T3 (right) 29. See Data S1 for the list of visually annotated T2 and T3. See also Figure S4B, C for more detailed results of the clustering analysis. (F) Total number of synapses the LPLC1 population in the hemibrain dataset receives from the putative T2 and T3 cells, among the other fragmented lobula terminals analyzed here. (G) A schematic of hypothesis of a mechanism for the spatially biased direction selectivity in LPLC1 population (shown in Figure 3N, O). Inhibition that can mask excitation from back-to-front tuned T4/T5 and is stronger in front can in principle make LPLC1 more direction selective on the side and less in front. (H, I) Glutamate measured with iGluSnFR expressed in LPLC1 cells at (top) lobula plate (LP) and (bottom) lobula (Lo) dendrites to a variety of stimuli, either (H) over time or (I) time-averaged. (J) An example image of lobula plate dendrites expressing iGluSnFR, whose ROIs are color coded according to the direction of the bar to which they responded best. Approximate location of each lobula plate (LP) layer is indicated. The pink arrow indicates the axis along which we measured the normalized positions of ROIs in (K). (K) Peak glutamatergic signals in lobula plate dendrites, as functions of normalized positions of ROIs along the layers of lobula plate, measured from the distal most layer. See also Figure S4D, E for data from flies expressing iGluSnFR pan-neuronally. (L-N) Calcium responses of LPLC1 cells expressing GluClα RNAi and their Dicer-2 only controls to translating objects with various heights, as in Figure 3G, H. (L) Responses over time, by object sizes and directions. (M) Peak responses as the functions of object sizes, by object directions. (N) Direction selectivity index of the peak responses as the function of object size, by genotype. (O, P) Fly-averaged (O) peak calcium responses and (P) DSI of LPLC1 expressing GluClα RNAi with Dicer-2 and their Dicer-2 only control, as functions of azimuthal RF positions of the ROIs. (Q) DSI of iGluSnFR signals in lobula plate dendrites in response to translating bars, plotted against the azimuthal RF location of each ROI. ROIs from different flies are in different colors, and the solid black line indicates median DSI within each 15° bin. DSI showed only weak correlation with the azimuthal location (r = −0.078). (R) The normalized histogram of azimuthal RF locations of lobula plate ROIs of LPLC1 expressing iGluSnFR. Error bars and shades around mean traces indicate standard error of the mean across flies, unless otherwise noted. (C, D) N = 7 (ATR+), 6 (ATR−) flies. (H, I) N = 11 (LP), 10 (Lo.) flies. (K, Q, R) N = 17 (flies), 366 (ROIs). (L-N) N = 14 (GluClα RNAi), 16 (Dicer-2 only) cells. (O, P) N = 21 (GluClα RNAi), 22 (Dicer-2 only) flies. n. s.: not significant (p > .05); *: p < .05; **: p < .01; ***: p < .001; ****: p < .0001 in Wilcoxon signed-rank (I) or rank sum test (D, N, P). Non-significant pairs are not indicated in (I) for visual clarity.
Next, we tried to identify lobula neuron types providing excitatory inputs to LPLC1, specifically focusing on small-field columnar neurons. The hemibrain dataset does not contain most of the medulla neuropil. Thus, the overwhelming majority of putative feedforward, columnar neurons that provide input to lobula (e.g., transmedullar (Tm) cells) are only partially reconstructed and are unlabeled. However, close inspection of their fragmented terminals can still offer useful insight into the input circuit organization of lobula VPNs21. Here, we ran a connectivity- and morphology-based agglomerative hierarchical clustering on ~1,000 fragmented terminals presynaptic to LPLC1, which likely represent feedforward excitatory inputs into LPLC1 and accounted for 25% of the lobula postsynapses in LPLC1 cells (Figure S4B; see Methods for the details and Data S1 for the complete results). Among the identified putative presynaptic cell types, of particular interest were T2 and T329 (Figures 4E, S4B). T2 and T3 are cholinergic42, small-field ON-OFF cells with tight size tuning, and provide excitatory inputs to at least one other object-selective lobula VPN, LC1121,43. We were able to identify 50 putative T2s and 82 putative T3s among the fragmented terminals analyzed here, which respectively had 393 and 532 total synapses on the entire LPLC1 population we analyzed of 60 cells (Figure 4F). These numbers combined correspond to about one sixth of all synapses from the ~1,000 small neurite fragments onto LPLC1 analyzed here (Figure 4F). Overall, the connectomic analyses here suggest that LPLC1 achieves its direction selective response to small moving objects by pooling inputs from T2, T3, and T4/T5, among other neurons (Figure S4C).
Glutamatergic inhibition creates spatial bias in direction selectivity
Next, we wondered how the spatial bias in direction selectivity of LPLC1 could be implemented. Specifically, how did LPLC1 neurons with more lateral receptive fields become more selective for objects moving back-to-front (Figure 3N, O). One possibility is that frontally facing LPLC1 neurons receive additional inhibition which masks direction selective, excitatory inputs from T4/T5 to make them less direction selective (Figure 4G). To characterize inhibitory inputs to LPLC1, we visualized glutamatergic signals at LPLC1 dendrites using iGluSnFR44. Glutamate is one of the major inhibitory neurotransmitters in the fly brain45,46, and several VPNs are known to receive directionally selective glutamatergic inhibition in lobula plate, including LPLC232,47. We first presented flies expressing iGluSnFR in LPLC1 with a battery of visual stimuli consisting of full-field flashes, drifting square wave gratings, and vertical bars moving horizontally (Figure 4H, I). We observed glutamatergic signals in both lobula and lobula plate neurites of LPLC1. Since LPLC1 is cholinergic45,48, these signals likely represent inputs into, rather than outputs from LPLC1. In both neuropils, the glutamatergic signals were strongest in response to the bars, moderate in response to the square waves, and minimal to the flashes (Figure 4H, I). In addition, glutamatergic inputs in lobula plate, but not in lobula, were direction selective: in lobula plate, back-to-front bars elicited stronger glutamate signals than front-to-back ones. The front-to-back square wave also resulted in smaller responses than ones moving in the other three directions. Importantly, the direction selectivity of these measured glutamatergic signals is syn-directional with the preferred directions of LPLC1 itself and its excitatory inputs, unlike other VPNs that receive directionally opponent excitation and inhibition32,47.
To better characterize this unexpected syn-directionally tuned glutamatergic inputs, we mapped the laminar organization of glutamatergic inputs into LPLC1 in the lobula plate. To do so, we presented the flies with vertical or horizontal bars translating in the four cardinal directions. Then, for each direction, we plotted the peak responses of dendritic ROIs against their relative position in the lobula plate along the distal-proximal axis (see Methods for details) (Figure 4J, K). In the vertical directions, glutamatergic responses to upward motion peaked most distally (near layer 4), whereas responses to downward motion peaked slightly more proximally (near layer 3) (Figure 4K). This observation is consistent with the previous documented innervation pattern and directional tuning of lobula intrinsic neurons LPi3–4 and LPi4–3, which are thought to receive excitatory input from one layer while providing glutamatergic inhibition in the neighboring layer47. In the horizontal directions, the peak of back-to-front responses was adjoining the peak of down responses proximally, likely corresponding to layer 2 (Figures 4K). The proximal-most ROIs (layer 1) showed more response to front-to-back bars than anywhere else (Figures 4K), albeit with a smaller amplitude. This observation implies the existence of glutamatergic interneuron types that receive inputs from T4/T5 in layers 1 or 2 and send outputs locally within the same layer, in contrast to the LPi neurons studied previously47. We confirmed that this pattern of intra-layer glutamatergic inhibition in the horizontally selective lobula plate layers holds true beyond LPLC1 inputs by repeating the same experiment in flies expressing iGluSnFR pan-neuronally (Figure S4D, E).
If these direction selective glutamatergic inputs into LPLC1 are indeed inhibitory, suppressing them should make LPLC1 more selective to back-to-front stimuli. To test this hypothesis, we knocked down a subunit of the glutamate-gated chloride channel GluClα specifically in LPLC1 by introducing RNAi46,49 while also overexpressing Dicer-2, which can facilitate mRNA cleavage50. When we presented horizontally translating dark rectangular objects with various heights to the flies with RNAi, we observed that the responses of LPLC1 with GluClα RNAi to 20° and 40° tall objects were more selective for back-to-front direction compared to control genotype with only Dicer-2 overexpression (Figure 4L–N). This result confirms the idea that glutamatergic, syn-directional inhibition is suppressing the direction selectivity of wildtype LPLC1 neurons.
Finally, we tested whether this glutamatergic inhibition is indeed responsible for the observed retinotopic bias in the direction selectivity of LPLC1, as hypothesized (Figure 4G). To this end, we again introduced GluClα RNAi and Dicer-2 into LPLC1 and recorded population activity in lobula dendrites in response to objects moving horizontally. We found that the knock-down of GluClα significantly increased direction selectivity of forward-facing LPLC1 ROIs only (Figure 4O, P). While the size of the effect was modest, this observation supports the idea that glutamatergic inhibition creates spatial bias of DSI in LPLC1. Such bias could be inherited from glutamatergic neurons that already have spatially biased direction selectivity, or it could be achieved de novo by the spatial bias in the synaptic strength between the glutamatergic neurons and LPLC1. To disambiguate these possibilities, we re-analyzed the iGluSnFR imaging data in lobula plate (Figure 4J, K), and checked the distribution of azimuthal RF locations for ROIs and their direction selectivity. We found that the azimuthal location of ROIs did not correlate with their horizontal DSI (Figure 4Q), suggesting that the spatial bias in DSI is not simply inherited from the glutamatergic neurons. Interestingly, the majority of identified lobula plate ROIs in these iGluSnFR recordings had their RF centers in the frontal visual field (Figure 4R). While this observation could simply reflect a bias in sampling, it may also favor the hypothesis that the spatial bias in the distribution of synapses between the glutamatergic neurons and LPLC1 is creating the bias in direction selectivity.
A downstream pathway that mediates slowing faithfully inherits LPLC1’s response
In a last set of experiments, we aimed to identify pathways downstream of LPLC1 that transmit signals responsible for the collision avoidance behavior. We focused our experiments on five major neuron types postsynaptic to LPLC1: DNp03, DNp06, PVLP112/113, and PLP219 (Figures 5A, S5A), which could be selectively labeled by split Gal4 lines51, including ones we newly generated (see Methods for details) (Figures 5B, S5B, Videos S2–4). These five cell types were among top postsynaptic partners of LPLC1, each receiving approximately 1,000 to 3,000 synapses from LPLC1 (Figure S5C, D). Of these neurons, the two descending neuron types, DNp03 and 06 were promiscuous in receiving inputs from VPNs. In addition to LPLC1, DNp03 receive inputs from LPLC4 and LC4, and DNp06 from LC4, 6, and 31. In contrast, the interneurons PVLP112/113 and PLP219 receive about one half of their inputs from LPLC1. We treated PVLP112 and 113 as a single group, because they share very similar connectivity and morphology, and our split Gal4 line appeared to label both, based on the number of cell bodies (4 and 3 PVLP112 and 113 are respectively reported in the hemibrain dataset, and the split Gal4 line typically labeled 7 PVLP cells per hemisphere) (Figure S5A, B).
Figure 5. A central brain pathway for collision avoidance.

(A) Reconstructed morphology of PLP219 neurons, viewed from the front. See also Figure S5A for morphology of other downstream neurons. Figure S5C, D quantifies connectivity from LPLC1 to these downstream neuron types. (B) PLP219 neurons labeled with myr::GFP using a newly generated split Gal4 line (VT041832AD, VT021792DBD > UAS-myr::GFP). The corresponding structures are marked by the red arrows between (A) and (B). See also Figure S5B and Videos S2–4 for the expression patterns of the newly generated split Gal4 lines. (C, D) Walking responses of PLP219 silenced flies and their controls in response to the parallel stimuli, (C) over time or (D) averaged over time. See also Figure S5E, F. (E, F) Walking responses of PLP219>Chrimson flies with or without ATR feeding in response to pulses of green light with different durations, either (C) over time or (D) time-averaged. Horizontal lines in (E) indicate the duration during which the light stimulation was on for each trace of corresponding colors. See also Figure S5G, H. (G) Individual fly (light purple) and averaged (dark purple) calcium responses of PLP219 population over time to a variety of visual stimuli (horizontally moving bars and squares, looming, square wave gratings, full-field flashes). Leftward in the stimulus schematics correspond to the back-to-front direction. See also Figure S5I. Error bars and shades around mean traces all indicate standard error of the mean. (C, D) N = 20 (PLP219>shi), 19 (PLP219/+), 22 (empty/shi). (E, F) N = 15 (ATR+), 13 (ATR−). (G) N = 11. n. s.: not significant *: p < .05 in (D) Wilcoxon signed-rank test or (F) 2-way analysis of variance (ANOVA) (the main effect of ATR conditions).
To test whether any on these downstream neurons is necessary for the collision avoidance behavior or sufficient to elicit slowing, we repeated synaptic silencing and optogenetic activation experiments identical to those we performed for LPLC1 (Figure 2). Somewhat surprisingly, given how these four neuron types receive the majority of LPLC1 outputs, silencing of none of the four with shibirets resulted in any significant change in slowing response to the parallel stimuli in either direction (Figures 5C, D, S5E, F). In contrast, optogenetic activation of PLP219 with Chrimson caused flies to slow significantly (Figures 5E, F, S5G, H), similar to activation of LPLC1 (Figure 2G–I). The results show that activity of PLP219 is sufficient to trigger slowing in the absence of visual inputs, while its output is not necessary and is likely redundant with other parallel pathways, which could also include neurons that we did not include in the present survey.
Finally, to characterize the visual response properties of PLP219 neurons, we imaged the calcium activity of their putative dendrites with jGCaMP7b (Figure 5G) while presenting the same broad battery of stimuli we used for the initial glomerular imaging of LPLC1 (Figure 3B). Overall, the pattern of PLP219’s responses closely matched those of LPLC1 axon terminals, where they responded to moving bars, squares, and expanding discs, but not to full-field stimuli (Figures 3B, 5G). This was in contrast to PVLP112/113 neurons, which responded to a broader set of stimuli, including drifting gratings and flashes (Figure S5I). In summary, PLP219, a downstream pathway of LPLC1 that mediates collision avoidance, inherits the response property of LPLC1 more faithfully than the other tested parallel pathway.
Discussion
In the present study, we explored a collision avoidance behavior in walking Drosophila and its underlying circuit mechanisms as a simple model of motion-based spatial vision. Using high-throughput psychophysics experiments, we demonstrated that back-to-front motion in the frontolateral visual field—a geometrical cue for near collision—causes slowing in walking flies (Figure 1), consistent with a previous report14. Using genetic silencing and activation experiments, we showed that the visual projection neuron LPLC1 is necessary for this putative collision avoidance behavior and its activity is sufficient to cause slowing in walking flies (Figure 2). Physiological response properties of LPLC1 mirrored the visual tuning of the slowing behavior, most notably in its spatial bias in direction selectivity (Figure 3), which was also consistent with the geometry of near collisions. Using connectomic analyses, optogenetics, and neurochemical imaging and manipulation, we showed that object-selective T2 and T3 inputs are pooled with direction-selective T4/T5 inputs, likely establishing the object- and direction-selectivity of LPLC1, while spatially biased glutamatergic inhibition creates its position-dependent tuning (Figure 4). Lastly, we identified a neuron downstream of LPLC1 called PLP219 to be not necessary, but sufficient to cause slowing, and to faithfully inherit the response property of LPLC1 (Figure 5). Figure 6 summarizes a model of neuronal circuitry surrounding LPLC1 based on these findings.
Figure 6. Mechanistic model of circuitry surrounding LPLC1.

With connectomic analyses, we identified T5b, c, d and T2/T3 neurons to be upstream of LPLC1 neurons, among others (Figures 4A, B, E, F, S4A, B). In addition, we confirmed synapses from T4/T5 to LPLC1 to be excitatory by optogenetic activation (Figure 4C, D). With glutamate imaging and glutamate channel knock-down, our experiments suggest that spatially-biased glutamatergic inhibition in lobula plate layer 2, which is tuned to the back-to-front direction, reduces horizontal direction selectivity in front-facing LPLC1 neurons (Figure 4G–R). This input circuitry likely creates LPLC1’s direction selective responses to small objects especially in the frontolateral visual field, a useful heuristic cue for collision avoidance. Optogenetic activation showed that the downstream neuron PLP219 is likely a part of redundant pathways translating LPLC1 activity into the slowing behavior (Figure 5). The schematic represents a horizontal slice through a fly brain, and A and P in the visual neuropils respectively indicate anterior and posterior retinotopic positions.
Positional cues for threat detection and collision avoidance
As objects move relative to an observer, the apparent size and position of the object systematically change as dictated by geometry. How animals detect change in object size and use it to avoid predation has been well studied in various vertebrate species ranging from primates52, rodents53–55, birds56, and fish57, as well as in insects32,58–61. In contrast, how and when animals use positional changes or directional motion to detect and avoid collision with moving objects has been studied less, with a notable exception14. In general, positional changes of moving objects are more salient than their changes in apparent size: One can show that the maximum apparent expansion rate of an object with radius R moving at a given speed is always less than its maximum apparent translational velocity when the object is more than R away from the observer (see Methods for calculation). Moreover, the ratio between the maximal translation rate and the maximal expansion rate can become arbitrarily large as the object is further and further from the observer (see Methods for calculation). Intuitively, these results correspond to the fact that one can easily tell whether someone 100 meters away is running to the right or left, while it is difficult to tell if that same person is running towards or away from you, based solely on visual motion. This saliency of translation rates is likely one reason that aerial predators employ interception strategies that minimize their apparent positional shifts on their prey’s retinae62–64. Less sophisticated pursuit strategies, often used in non-predatory chasing among conspecifics65,66, generate positional changes that can be used by pursuees to detect pursuers. Note that even predators that employ sophisticated strategies will suffer from positional changes after sudden turns of the prey before they settle into a new interception course.
Positional changes are therefore a useful cue to simply detect objects such as conspecifics and predators, but back-to-front motion particularly useful for preventing collisions. This is because approaching objects appear to be moving back-to-front only when they will cross the path of the observer in front; such objects can collide with the forward-moving observer simply by slowing or stopping. We empirically confirmed this conjecture by running a simple simulation with randomized trajectories (Figure 1C). Based on this geometrical argument, we interpret the direction selective slowing behavior of the flies studied here as a maneuver to create a safety margin in front and prevent collisions. This is in contrast to other object motion-triggered freezing behaviors in both flies21 and mice54, which are not selective for stimulus direction and thus are unlikely to be a specific response to predicted collision. Note, however, that this interpretation does not imply that expansion in size is not useful for collision avoidance. Indeed, we observed that LPLC1 neurons, a neural basis of position-based collision avoidance behavior we identified, itself also responded vigorously to fast-expanding stimuli (Figure 3B). It is of future interest to study how changes in size and position are combined to improve the performance of collision avoidance, both behaviorally and mechanistically.
Patterns of visual object-induced behaviors and their neural mechanisms
The behavioral experiments in the present study were specifically designed to isolate and explore flies’ slowing in response to visual motion in the back-to-front direction, which can function as a strategy to prevent collision with objects crossing in front, as discussed above. For example, the parallel stimuli in Figure 1I, as well as the “azimuth sweep” stimuli in Figure 1L and “relative motion” stimuli in Figure 1P all had negligible or zero size changes. As hypothesized from the geometrical argument, flies showed selective slowing in response to objects moving back-to-front in the absence of size cues, replicating a previous finding14 (Figure 1J–R). The direction selectivity of the slowing behavior was abolished by silencing T4/T5 (Figure 2A, B, E, F), the earliest direction selective cells in the fly brain23. Interestingly, this effect was bidirectional: Silencing T4/T5 increased slowing in response to front-to-back objects, in addition to reducing slowing in response to back-to-front objects (Figure 2B, E), indicating that flies are actively ignoring optic flow-consistent objects. In addition, silencing visual projection neuron LPLC1, which is postsynaptic to T4/T5, also reduced slowing in response to objects moving in the back-to-front direction (Figure 2C, D, E, F). In contrast to T4/T5, silencing LPLC1 never resulted in increased slowing in response to front-to-back motion. This suggests there exists a parallel T4/T5 downstream pathway mediating the negligence of front-to-back objects. Also, flies with T4/T5 or LPLC1 silenced still exhibited residual slowing in response to moving objects without size expansion, which likely came through other slowing inducing LC neurons, such as LC1121. The LPLC1-dependent direction selective slowing behavior we studied here resembles flies’ slowing response to back-to-front optic flow22, which is implemented by LPC1 neurons28,30. While the two neurons share selectivity for back-to-front motion, they differ in terms of their size tuning (Figure S3F, G), as well as LPC1’s sensitivity to binocular optic flow28.
The approach stimuli (Figure 1F) were an exception, since they expanded approximately 3-fold in size from 4° to 13° wide. The sizes of approach stimuli reached their maxima in front of the fly in the back-to-front condition and behind the fly in the front-to-back condition. The fact that silencing of T4/T5, the only known source of directional motion detection in the Drosophila brain, spared flies’ preferential response to the back-to-front approach stimulus (Figure S2A) suggests that flies initiate slowing in response to larger expanding objects, especially in front. Such loom-evoked slowing is conceivably implemented by loom sensitive visual projection neurons independent of T4/T5, such as LC4, LC6, and LC16 26,33,39.
The object-like stimuli we used elicited turning, in addition to slowing responses. Most of the time, flies turned away from the side of the object, but they sometimes showed turning towards the side of the object, especially when objects were moving back-to-front. A useful way to analyze these turning behaviors is to decompose them into position- and motion-dependent components67,68. To disentangle the two components of the behavior, it is useful to compare the behavior of T4/T5-silenced, motion-blind flies with controls. Across the stimulus conditions, T4/T5-silenced flies exhibited consistent turning against the side of small moving and/or expanding objects (Figure S2E, F, J), revealing an anti-positional component of the behavior. In contrast, flies with intact T4/T5 turned toward back-to-front objects, which amounts to anti-directional turning. This anti-directional turning to back-to-front motion was stronger in the frontal, rather than lateral, visual field (Figures S1D, S2J), in contrast to the anti-positional component that was more spatially uniform.
Mechanisms of visual feature elaboration in LPLC1
By analyzing the hemibrain connectome, we found LPLC1 to receive inputs from T5 subtypes tuned to back-to-front, up, and down directions (Figure 4A, B, S4A). While we could not test whether the same pattern holds for T4s, this seems likely given a recent finding suggesting that connections from T4 and T5 to downstream neurons are mostly balanced69. The specific connectivity from back-to-front tuned T4/T5 to LPLC1 explains the horizontal direction selectivity of LPLC1. In contrast, the function of up and down selective excitation to LPLC1 are less clear. Conceivably, vertically direction selective excitation can be spatially arranged to enhance LPLC1’s sensitivity to looming stimuli, similar to LPLC232—although the dendrites of LPLC1 lack a clear radial structure like LPLC226. Alternatively, vertical direction selectivity of LPLC1 might be biased along elevation to help detect objects moving against translational optic flow: Downward and upward motion in the upper and lower visual field are respectively against translational optic flow during forward locomotion, and thus they can be unambiguously attributed to moving objects, similar to back-to-front motion along the horizontal axis.
In addition to T4/T5, we identified object selective excitatory neurons T2 and T321,43 synapses onto LPLC1 in lobula (Figure 4E, F, S4B), which can in principle explain their selectivity for small objects. Unfortunately, we were unable to test the functional contribution of T2/T3 to LPLC1 responses due to the lack of genetic reagents to orthogonally target these pairs of neurons strongly enough. While inputs from T2/T3 to LPLC1 are sizable, it is also worth noting that they are a minority of all inputs. Other putative input cell types of LPLC1 we identified include several Tm and TmY cell types (Figure S4C). However, most have never been studied physiologically. Future efforts to identify genetic drivers to target these understudied Tm and TmY cells will likely be key to understanding visual computations in lobula visual projection neurons, including LPLC1.
In addition to cholinergic inputs from T4/T5 as well as T2/T3, we also found that LPLC1 receives glutamatergic inputs that are tuned to the back-to-front direction in the lobula plate layer 2 (Figure 4H–K). This unexpected intra-layer glutamatergic inhibition in the horizontal layers of lobula plate is at odds with the model where layers 1 and 2 inhibit each other through reciprocal glutamatergic projections, proposed by analogy to the layers 3 and 447. A recent connectomic reconstruction of lobula plate identified diverse lobula plate intrinsic neurons which are well suited to both intra-layer inhibition (e. g., LPi2b) and inter-layer inhibition (e. g., LPi1–2 and LPi2–1)69. Physiological studies of these new LPi neurons would be necessary to clarify the architecture of inhibitory interactions in lobula plate.
We showed that glutamatergic inhibition contributes to the spatial bias of direction selectivity in LPLC1 by knocking-down GluClα with RNAi, but the effect of RNAi appeared different depending imaging locations. In fine dendritic arbors, RNAi appeared to increase response to back-to-front objects (Figure 4O), which is the effect one would naively expect from reduced back-to-front selective inhibition. In contrast, in more distally located main dendritic branches, responses to front-to-back were decreased by RNAi (Figure 4M). The unexpected reduction in front-to-back response might reflect homeostatic regulation of membrane excitability due to reduced inhibition70, for example by downregulation of voltage-gated sodium channels71. The subcellular difference in the effect of RNAi might be explained by subcellular localization of channels that participated in the homeostatic control of the membrane excitability. Such localization is indeed known for para, the voltage gated sodium channel in Drosophila, which is tightly localized to the initial segment of axons72.
The mechanisms of visual computations in LPLC1 dendrites we discovered here (Figure 6) leave some of its visual response properties unexplained. First, how LPLC1 responds vigorously to looming stimuli (Figure 3B) remains unclear. Conceivably, inputs from T4/T5 might be contributing to its loom responses, as discussed above. Alternatively, LPLC1 might be receiving loom-selective excitation in lobula. Indeed, our clustering analysis identified input clusters shared between LPLC1 and other known loom detecting neurons, such as LC4, LC6, and LPLC2 (Figure S4B). Second, mechanisms underlying LPLC1’s sensitivity to relative motion between moving objects and backgrounds (Figure 3K–M) remain unclear. Achieving such selectivity to combinations between object and background directions likely requires a nonlinear computational step between motion detector outputs and LPLC1 inputs. Neurons that connect lobula plate and lobula, such as TmY or Y neurons69, are well situated to perform such computation.
Downstream circuitry of LPLC1
We found that optogenetic activation of PLP219 neurons, the recipient of the largest number of LPLC1 synapses after LPLC1 itself, results in slowing (Figure 5E, F), similar to activating LPLC1 itself (Figure 2H, I). In contrast, synaptic silencing of PLP219 did not reduce visually evoked slowing (Figure 5). Given that PLP219 neurons receive more than half of inputs from LPLC1 and that its activity can drive flies to slow, a plausible scenario is that PLP219 and other neurons redundantly transmit activity of LPLC1 to slowing-inducing, command-like neurons. A possible candidate for such redundant pathway is PLP220. PLP220 is the 8th largest recipient of LPLC1 synapses, it morphologically resembles PLP219, and PLP219 and PLP220 appear to share a large number of postsynaptic targets.
Other neurons we studied downstream of LPLC1 (PVLP112/113, DNp03, DNp06) were neither individually necessary nor sufficient for the slowing behavior, despite their strong connectivity to LPLC1. These neurons could be implementing other behavioral functions of LPLC1. For example, a previous study reported that strong optogenetic activation of LPLC1 can lead to behavioral phenotypes other than slowing, such as jumping26. Descending neurons DNp03 and DNp06, which receive inputs from other loom-sensitive, jump-inducing VPNs (LC4, LC6), make good candidates for the neural basis of such jumping phenotypes.
An interesting question is how the activation of LPLC1 neurons by different stimuli (e. g., small objects moving back-to-front vs. looming objects) results in different behavioral responses. For example, one could imagine that the activation of LPLC1 without activation of other loom sensitive cells (e.g., LC4, LC6) is decoded as the presence of a conspecific in a collision course to initiate slowing, whereas simultaneous activation of LPLC1 alongside other loom detectors strongly implies predators and thus triggers rapid escape. How such population-level decoding and behavioral decision-making is implemented through the network of interglomerular local neurons25 is of particular interest for future studies.
Convergent motifs of visual computation beyond LPLC1
Several computational motifs employed by LPLC1 appear to have parallels in different visual systems. For example, the horizontal direction selectivity of LPLC1’s responses and their behavioral outputs were spatially biased (Figures 1Q, R, 2E, F, 3N) such that it is most direction selective at azimuthal positions where back-to-front motion most strongly predicts frontal crossings (Figure 1C). Such retinotopic biases in visual processing have been found in diverse species. For example, in vertebrate retinae, circuit features such as opsin expression, dendritic morphology, synaptic strengths, and cell density can all vary systematically across visual space, depending on species73–75. Features such as receptive field sizes76 and orientation selectivity77 exhibit retinotopic biases in primate visual cortices. Importantly, the geometrical justification we provided here for the spatial bias in direction selectivity for collision detection is not specific to flies. Thus, it is likely that similar biases exist in other sighted species, arrived at through convergent evolution. Indeed, rodent superior colliculus—a center of visual threat detection—has been reported to exhibit a similar retinotopic bias where back-to-front and upward motion is overrepresented in the upper lateral visual field 78, although this observation is contested79. Still, if true, such topographic bias could be seen as reflecting the geometry of approaching overhead predators, similar to LPLC1.
In the present study, we suggest that LPLC1 pools inputs from elementary motion and object detecting neurons to detect objects in near-collision courses (Figure 6). Interestingly, a similar computational motif of convergence between motion- and object-detecting pathways seems to be present in the early visual systems of vertebrates as well. Vertebrate retinae are equipped with retinal ganglion cells selective for motion directions80 as well as small objects81–83. The axon terminals of motion- and object-selective ganglion cells innervate the shallowest layers of optic tectum in zebrafish84 as well as of superior colliculus in mice85. While the internal circuitry of the optic tectum / superior colliculus is still not well understood, physiological studies on the neural bases of prey capture in larval zebrafish have identified tectal neurons that show direction selective responses to small objects similar to those in LPLC186–88. Similarly, narrow field neurons in mouse superior colliculus, which are also necessary for prey capture behavior, exhibit direction selectivity as well as tight tuning to small object sizes89. These results suggest that integration of motion- and object-detector outputs similar to LPLC1 indeed takes place in the local circuitry of optic tectum / superior colliculus. Parallels between vertebrates and invertebrates in the early layers of visual processing and motion detection have been noted90–92. The findings reported here extend the computational analogies between insect and vertebrate visual systems to the motif of initial segregation and subsequent convergence of motion and object detecting pathways to drive specialized object-detection behaviors.
STAR Methods
RESOURCE AVAILABILITY
Lead contact
Damon Clark (damon.clark@yale.edu)
Materials availability
Split Gal4 lines newly generated in the present study are available from the Lead contact without restriction.
Data and code availability
The code to perform the numerical simulation of collisions (https://github.com/ClarkLabCode/CollisionSimulation) and connectomic analyses (https://github.com/ClarkLabCode/LPLC1ConnectomeAnalysis) are also deposited to our GitHub repositories. Further information and requests for data and code should be directed to and will be fulfilled by the Lead contact.
EXPERIMENTAL MODEL AND SUBJECT DETAILS
Fly strains and husbandry
Flies were raised at around 50% humidity on a dextrose-based food. Non-virgin female flies were used for all experiments except for the optogenetic activation in blind flies, where male flies with single deficient allele of norpA on the X chromosome were used for experimental convenience. Flies for behavior experiments were raised at 20 °C on 12 h light/dark cycle. Adults less than one day post eclosion were collected with CO2 anesthesia, and all experiments were performed within 12 to 24 h after staging, with the exception of flies for optogenetics experiments, which were dark-reared on food with or without 10 μM all-trans retinal (ATR)36. All behavioral experiments were performed within 3 h windows after lights-on or before lights-off. Flies for imaging experiments were grown at 25 °C. Most flies were staged with CO2 at least 12 h prior to the experiments and immobilized with ice before surgery. Flies were typically imaged between 2 to 7 days post eclosion. Flies for imaging experiments with optogenetics were dark reared on food with or without ATR for 3 days. In imaging experiments with RNA interference, only 5 days old flies were used. The genotypes of the flies used for the experiments are summarized in Table S1.
Tethered walking psychophysics assay
Previously reported fly-on-the-ball rigs were used to measure fly locomotor responses to visual stimuli16. Flies were anesthetized on ice, and tethered to 30G surgical needles with UV-curable epoxy on their dorsal thorax. The tethered flies were mounted above air-floated balls, whose rotation were used as a read out of flies’ attempted movements. The rotation of the balls was measured with optical mouse chips at the resolution of ~0.5° and 60 Hz. Visual stimuli were projected onto panoramic screen covering 270° azimuth and 106° elevation using Lightcrafter DLP evaluation module (Young Optics) using green light (peak 520 nm and mean intensity ~ 100 cd/m2). The temperature of the rig was set at 36 °C to promote walking and to use thermogenetic tools.
Visual stimuli used in the behavioral experiments were compiled in Table S2. For optogenetic stimulation16, the panoramic screens were removed and the pulses of green light were directly shone on the flies from the four directions (top, front, left, right). The mean light intensity was approximately ~10 μW/mm2.
Behavioral data analysis
Walking speed of the flies were normalized relative to the average walking speed within the 500 ms window prior to each stimulus onset, unless otherwise noted. The time traces of normalized walking speed and turning angular velocity were then averaged across presentations of each stimulus type. Walking and turning time traces in response to mirror-symmetric pairs of stimuli were also averaged in subtractive and additive fashion, respectively. These individual mean time traces were then averaged over time for statistical comparisons. The window for the averaging spanned the entire duration of stimuli, unless otherwise noted in the caption. In addition, group mean time traces and standard error of the mean were calculated from the individual mean time traces to visualize the dynamics of the responses.
Two-photon imaging
For imaging experiments, flies were cold anesthetized and head-fixed into a metal shim with UV curable epoxy. The brain was exposed by surgically removing cuticle, fat tissue, and trachea on the back of the head. All recordings were performed on the right side of the brain. The mouth parts were fixed with the epoxy to minimize the brain movement. The exposed brain was submerged under oxygenated sugar-saline solution102. Imaging was performed with a two-photon microscope (HyperScope; Scientifica) equipped with a 20x water immersion objective (XLUMPlanFL; Olympus). Visual stimuli were presented on a panoramic screen covering 270° azimuth and 69° elevation of the flies’ visual field with a DLP projector (Texas Instruments)16. Stimuli were pitched 45° forward relative to the screen to account for the tilt of the fly’s head in the shim. The projector output was filtered with a 565/24 in series with a 560/25 filter (Semrock) to prevent green light from bleeding into the PMT. The input into PMT was also filtered with two 512/25 filters (Semrock) to capture green fluorophore emissions. A femtosecond Ti-sapphire laser (Mai Tai; Spectra-Physics) provided 930 nm excitation. The power on the sample was set below 40 mW. Images were acquired at 8.46 Hz with ScanImage100 software and motion-corrected offline. Frames with more than 4.3 microns of motion were excluded from further analyses, and recordings with more than 5% of frames rejected were discarded.
Stimulus presentation
The stimuli used in behavioral and imaging experiments are respectively compiled in Supplementary Tables 2. In some imaging experiments, probe stimuli were presented at the beginning of experiments in order to identify responsive ROIs. See the section on imaging data analysis for how responses to probe stimuli were used in the analysis. All visual stimuli were presented against mean gray background unless otherwise noted. Visual objects were all black and presented on the visual equator unless otherwise noted. Each stimulus presentation was interleaved with blank gray screen, typically around 3 s. When a stimulus is described in terms of azimuthal and elevational degrees, the azimuthal and elevational zero respectively correspond to the central meridian and visual equator, with positive degrees indicating right and ventral visual fields. Since all the imaging experiments were performed on the right hemisphere, positive horizontal velocity always corresponds to front-to-back movements. Stimuli used in the single cell imaging experiments (Figures 3G–M, 4L–N, S3H–K) are centered about the estimated receptive field location of the recorded cell.
Optogenetic activation during imaging
Optogenetic activation of Chrimson under the two-photon microscope (Figure 3C, D) was performed using a Thorlabs 690 nm laser diode (Thorlabs, HL6738MG). The measured power of the laser at the sample was ~2 mW/mm2 and the laser was shone onto the sample through the imaging objective.
Imaging data analysis
ROIs were defined either manually (glomerular and single-cell recordings; Figures 3B–M, 4C, D, L–N, S3B, C, H–K), with a watershed segmentation algorithm103 (dendritic recordings; Figures 3N, O, 4H–K, O-R, 5G, S3L–P, S4I) based on time-averaged fluorescent images, or as 3 μm rectangular grids (pan-neuronal recordings; Figure S4E). To remove stimulus bleed-through, the recordings were subtracted with the pixel-averaged signals from background regions, which were defined as the largest contiguous regions below 10 percentile brightness. The fluorescent time traces were then converted into the unit of ΔF/F to account for expression level variability and photo-bleaching of the fluorophores. To obtain the baseline fluorescence (i.e., the denominator F), fluorescence within each ROI was averaged across pixels, and a decaying exponential Ae−τ was fit to the time-averaged fluorescence within each interleave epoch, where τ was constrained to be identical across all ROIs in a single recording. The fit exponential (i.e., the baseline fluorescence) was then subtracted from the original ROI-wise fluorescence time traces, and the remainder (ΔF) was then divided by the same fit exponential to generate ΔF/F time traces.
In some recordings where ROIs were extracted in an automated fashion (Figures 3N, O, 4H–K, O–R, S3L–P, S4D, E), responsive ROIs were selected based on the consistency of their responses to probe stimuli (see Table S2). The probe stimuli were typically presented three to five times before each recording, and Pearson correlations between every pair of responses were calculated. ROIs with average correlation below certain thresholds were then discarded (0.4 for GCaMP6f and jGCaMP7b recordings, 0.3 for iGluSnFR recordings).
The responses to repetitions of the same stimulus were averaged within each ROI, and then across all ROIs within each fly to generate an individual mean response. The time-averaged ΔF/F during the 500 ms period preceding each stimulus presentation was subtracted from the time trace to remove the spontaneous fluctuation of ΔF/F. For statistical comparisons across conditions and genotypes, mean or peak individual mean responses were calculated over appropriate time windows, which spanned the entire duration of the stimuli unless otherwise noted. Additionally, group mean responses and standard error of the mean were calculated based on the individual mean responses across flies to visualize the dynamics of the responses.
In some lobula plate recordings (Figures 4J, K, S4D, E), the laminar positions of ROIs were estimated. To this end, we manually drew a directed line segment that approximately started at the distal end of lobula plate, traversed the layers orthogonally, and ended at the proximal end. The position of each ROI along this line segment was calculated as a proxy of its layer affiliation.
Receptive field localization
In the single cell recordings (Figures 3G–M, 4L–N, S3H–K), the receptive field (RF) location of each cell was mapped prior to the experiment, and subsequent stimuli were centered around the estimated RF location21. First, the approximate RF location was probed interactively by presenting translating small black squares. Next, a 10° black square moving horizontally or vertically at 60 °/s swept the 40° × 40° area around the approximate RF location at the resolution of 5° (noted as RF mapping stimulus in Table S2). For each azimuth and elevation, the neural response in the unit of ΔF/F (see later) was averaged over time within the 1.5 s window from the stimulus onset and over the directions of motion, resulting in horizontal and vertical spatial tuning curves. Gaussian functions were independently fit to the two tuning curves, and resulted means of the distributions were used as the estimated RF center. In addition, the full-width quarter-width (FWQM) values of the fitted Gaussian functions were later used as the measure of RF size (Figure 3E). Only sizes of RF with good (R2 > 0.8) Gaussian fit are plotted for this purpose. In some non-single cell dendritic recordings (Figures 3N, O, 4O–R), azimuthal RF location of each ROI was estimated based on the averaged time-to-peak in response to objects moving rightward and leftward.
Behavioral state recording and manipulation
To either manipulate or monitor the behavioral state of the flies during the imaging experiments, we performed (1) bath application of chlordimeform (CDM), (2) simultaneous recording of spontaneous leg movement, and (3) simultaneous recording of locomotor activity with the fly walking on an air-supported ball. In the CDM application experiment, flies’ baseline stimulus responses were recorded (shown as pre in Figure S3L), and then the bath solution was swapped for solution with 100 μM CDM. After waiting 15 minutes, another recording was performed (shown as CDM in Figure S3L). Then, the bath solution was again swapped for solution without CDM, and a final recording was performed after waiting another 15 minutes (shown as wash in Figure S3L). To exclude the possibility that observed differences between the recordings simply resulted from elapsed time or changing solutions, we also performed sham experiments where solutions were swapped in a similar way but with identical ones without CDM (shown as sham in Figure S3L).
In another experiment (Figure S3M), we recorded flies’ spontaneous leg movements with an infrared (IR) camera (FLIR BlackFly S USB3) with SpinView software. Flies were illuminated with 850 nm IR LEDs from beneath, and an 850 nm short-pass filter (Thorlabs FES0850) was mounted on the camera to filter out the two-photon laser. To quantify fly leg movements, we calculated, for each pair of consecutive frames in the video and for each pixel, the absolute difference in pixel intensities, which was then averaged over space within a rectangular ROIs drawn to cover the whole fly. This time trace of averaged absolute intensity differences was then normalized such that its 2.5 and 97.5 percentile values correspond to 0 and 1, respectively104. We call this normalized index of leg movements the ‘motion index’ (MI), following a previous study104.
Simultaneous physiological and behavioral recordings were performed generally following a previously published protocol105. The air-floated ball with mouse chip reading out the rotation of the ball, identical to ones used in the behavioral experiments (Figure 1D), was placed under the two-photon objective (Figure S3N). The fly holder was designed to leave space for fly’s thorax and abdomen so that flies could walk comfortably. To promote forward walking, flies were starved for 1 day and the bath solution was heated to 40 °C with a thermoelectric cooling unit operated by a PID controller and a H-bridge amplifier. At room temperature, we observed that flies almost never walked forward despite turning vigorously, in agreement with previous reports105,106.
Geometrical simulation
For the simulation in Figure 1C, 5 million circular objects with 2 mm radius were simulated around an observer. The positions of the objects were uniformly distributed within a circular area with the radius of 200 mm about the observer. We assumed the observer to be moving forward at 10 mm/s, and the speed of the objects were randomly drawn from a uniform distribution ranging from 0 to 20 mm/s. The direction of the objects’ velocity was also chosen uniformly at random. For each object, given the instantaneous relative position and velocity and under the assumption that the both observer and the object maintain the constant velocity, we calculated immediate collision risk as time-discounted, rectified inverse intercept between the observer and the object trajectories. The intercept I and immediate collision risk h are given as follows:
where (x, y) and are the initial position and velocity of the object relative to the observer, (time to path crossing), τ = 10 s and ϵ = 2 mm. We then plotted h as a function of the instantaneous angular position and velocity of the object as seen by the observer, averaged over samples. The code to run the simulation is available on GitHub (https://github.com/ClarkLabCode/CollisionSimulation).
Proof of the geometrical conjecture
Let us assume a stationary observer at the origin and a circular object with radius R located at r0 = (x0, y0), moving at a constant velocity v = (vx, vy). Let us denote the future position of the object as r(t) = (x0 + vxt, y0 + vyt) = r0 + vt, and distance to the object d(t) = |r(t)|. Then, the future retinal position ϕ(t) and size ψ(t) of the object seen from the observer can be written as
where ϕ = 0 points in the positive direction along y-axis. Then, the instantaneous angular velocity and expansion rate at time t = 0 can be obtained by differentiating these by t and evaluating at t = 0:
where d0 = d(0). Now, if we constrain the speed of the object to be a constant v = |v|, vx and vy can be written as (vx, vy) = v(cosθ, sinθ), where θ is the direction of the object’s movement. We can also set x0 = 0 and y0 = d0 without losing generality Then, maximum angular velocity and expansion rate of the object are
The ratio between these two values can be written as
where δ = R/d0. This is a monotonically increasing function of δ that grows arbitrarily large with δ, which is larger than 1 when δ > 1. That is, when the object is further than R away from the observer, its apparent angular velocity caused when it moves tangentially to the observer is larger than the expansion rate caused when it moves straight toward the observer.
Connectomic identification of T5
To identify candidate T5 cells in the hemibrain v1.1 dataset8, we first extracted cells that had (1) synapses only in lobula or lobula plate, and (2) more presynaptic sites in lobula plate than in lobula and more postsynaptic sites in lobula than in lobula plate. From this candidate T5 pool, we identified cells that were connected to only one out of the three sets of monostratified LPTCs in single lobula plate layers (HS and CH for layer 1, H2 for layer 2, and VS for layer 4, respectively). After visual inspection, we were able to identify 52 T5a, 36 T5b, and 43 T5d cells. Since there is no identified monostratified LPTC in layer 3 of lobula plate, we searched for T5c cells from the candidate T5 pool as ones that had (1) no connection to the aforementioned LPTCs, and (2) fewer pre- and postsynaptic sites in lobula and lobula plate than the corresponding maximum numbers of pre- and postsynaptic sites in the two neuropils among the T5a, b, d cells identified above. After visual inspection, this resulted in 55 T5c cells (Figures 4A, B, S4A). We then examined the connectivity between the identified T5 subtypes and LPLC1. The code to identify candidate T5s can be found on our GitHub repository (https://github.com/ClarkLabCode/LPLC1ConnectomeAnalysis), and the body IDs of the annotated T5s can be found in Data S1.
Connectomic identification of lobular inputs into LPLC1
To identify columnar neuron types providing inputs into LPLC1 neurons in the lobula, we first extracted all neurons in the hemibrain v1.1 dataset8 that have (1) at least 3 synapses onto a single LPLC1 neuron, (2) no synapse outside of lobula, and (3) less than 300 synaptic sites in total, pre- and postsynapses combined. This resulted in a pool of 977 distinct lobula intrinsic terminals. We then clustered these lobula intrinsic terminals according to their (1) connectivity, (2) terminal morphology, and (3) layer innervation patterns. First, we identified all labeled cell types that had more than 2 synapses from at least a single cell among the pool of the lobula intrinsic terminals, which resulted in 126 distinct identified cell types, including LPLC1. We then constructed a 977 × 126 matrix that contained synaptic counts between each lobula intrinsic terminal and each postsynaptic cell type. Postsynaptic cells without identified cell types were ignored here. Second, we extracted the positions of the all presynapses of each lobula intrinsic terminal in the native XYZ coordinate of the hemibrain dataset. Then, these synapse positions were translated and rotated such that the new XY axes are approximately parallel to the layers of the lobula and the new Z axis is normal to the layers and goes through the retinotopic center of the lobula. This new coordinate system was obtained by performing principal component analysis on the postsynaptic terminals of the 4 LT1 neurons in the lobula. LT1 neurons have a dense, monostratified dendrite in the lobula layer 2 that covers the entire tangential extent of the lobula29, which can be used as a landmark. We then calculated three standard deviations of the positions of presynapses of each lobula intrinsic terminals along each dimension of the new coordinate system, which respectively characterized the spatial spread of the terminals in the two tangential dimensions (PC1 and 2) and the normal dimension (PC3). Third, to identify the layer affiliation of each synaptic terminal, we first fit a surface model to the positions of the presynaptic terminals of LT1, which predicted PC3 position of each synapse with a bivariate quadratic formula of PC1 and PC2. The least square fit resulted in R2 = 0.74. Then, for each postsynapse location of the lobula intrinsic terminals, we calculated deviation between its actual PC3 position and the prediction from the quadratic model, which was interpreted as the relative depth of the synapse with respect to the layer 2 under the assumption that the layer boundaries of the lobula can be approximated as parallel quadric manifolds (positive deviations corresponding to deeper layers). For each lobula intrinsic terminal, we counted the numbers of the synapses whose fell in eleven 5 μm bins ranging from −10 μm to 45 μm. Finally, we ran a hierarchical agglomerative clustering on the 977 × 140 connectivity-morphology-innervation matrix and extracted 15 clusters, whose membership sizes varied from 18 to 148 cells. We then visualized the all neurons in each cluster on neuPrint explorer101 (Figure S4C), and examined their morphology while referencing anatomical literature to identify putative cell types29. The code to run the clustering analysis can be found on our GitHub repository (https://github.com/ClarkLabCode/LPLC1ConnectomeAnalysis), and the complete list of the cells analyzed with their cluster affiliation is provided in Data S1. The list of visually annotated T2 and T3 cells can be also found in Data S1.
Connectomic identification and split Gal4 generation for downstream targets of LPLC1
Major downstream neuron types of LPLC1 were identified in the hemibrain v1.1 dataset8 through the neuprint website101. Since there were no preexisting selective Gal4 drives to label PLP219 and PVLP112/113, we created a new split Gal4 lines by screening for hemidrivers targeting these cell types using color depth maximum intensity projection search107 running on multi-color flip out image library108 on the NeuronBridge website101.
Immunohistochemistry
The tissues were dissected out in PBS, fixed in 4% paraformaldehyde for 15 minutes, washed three times for 20 minutes, blocked with 5% normal goat serum for another 20 minutes, and incubated with primary antibodies (mouse anti-Brp, 1:25; chicken anti-GFP, 1:50) in PBST (PBS with 0.2% Triton-X) for 24 hours. After another 3 washes, the tissues were incubated with secondary antibodies (goat anti-mouse AF633, 1:250; goat anti-Chicken AF488, 1:250). 5% normal goat serum was also added to the primary and secondary antibody solutions. The tissues were then mounted on glass microscope slides with Vectashield mounting medium, and imaged with a Zeiss confocal microscope.
QUANTIFICATION AND STATISTICAL ANALYSIS
For statistical purposes, each fly or cell was counted as an independent measurement, as noted in the figure captions. p-values presented are from Wilcoxon sign-rank tests (within-fly comparisons across stimulus conditions), rank-sum tests (across-fly comparisons across populations), Friedman test (within-fly comparisons across more than 3 stimulus conditions), or 2-way ANOVA (across-population comparison of tuning curves where only the existence of the population main effect matters). The tests are all as noted in the figure captions.
Supplementary Material
Data S1. The results of the connectomic analyses on the optic lobe neurons. Related to Figure 4. The lists of the annotated T5 neurons found in the hemibrain dataset (sheet 1), the complete results of the clustering analysis on the lobula neurite fragments (sheet 2), and the annotated T2 and T3 neurons (sheet 3).
Video S1. Approach and parallel stimuli on the virtual cylinder. Related to Figure 1F, I. The viewing fly was positioned at the center of the cylinder, facing forward. The cylinder as shown is viewed from above and behind the fly. The virtual cylinder shown here was projected onto the square screens so that the virtual cylinder geometry was preserved from the fly’s perspective.
Video S2. The expression pattern of the newly generated PLP219 split Gal4 line. Related to Figure 5B. The green and blue channels respectively show anti-GFP and anti-brp staining. The genotype of the fly is w/+; VT041832AD/+; VT021792DBD/UAS-myr::GFP. A side of the video is 472 microns long.
Video S3. The expression pattern of the first PVLP112/113 split Gal4 line. Related to Figure 5. The green and blue channels respectively show anti-GFP and anti-brp staining. The genotype of the fly is w/+; R72A10AD/+; VT002042DBD/UAS-myr::GFP. A side of the video is 472 microns long.
Video S4. The expression pattern of the second PVLP112/113 split Gal4 line. Related to Figure 5. The green and blue channels respectively show anti-GFP and anti-brp staining. The genotype of the fly is w/+; R72A10AD/+; VT019749DBD/UAS-myr::GFP. A side of the video is 472 microns long.
KEY RESOURCES TABLE.
| REAGENT or RESOURCE | SOURCE | IDENTIFIER |
|---|---|---|
| Antibodies | ||
| Anti-brp mouse monoclonal antibody (nc82) | Developmental Studies Hybridoma Bank | RRID: AB2314866 |
| Anti-GFP chicken polyclonal antibody | Invitrogen | RRID: AB2534023 |
| Anti-mouse goat polyclonal antibody, Alexa 633 conjugated | Invitrogen | RRID: AB141431 |
| Anti-chicken goat polyclonal antibody, Alexa 488 conjugated | Invitrogen | RRID: AB142924 |
| Normal goat serum | Abcam | RRID: AB2716553 |
| Chemicals, peptides, and recombinant proteins | ||
| All-trans retinal | Sigma Aldrich | PubChem SID: 24899355 |
| Vectashield antifade mounting medium | Vector Laboratories | RRID: AB2336789 |
| PBS | Sigma Aldrich | Cat#: P4417 |
| paraformaldehyde | Sigma Aldrich | Cat#: 252549 |
| Triton-X | Sigma Aldrich | Cat#: X-100 |
| chlordimeform | Sigma Aldrich | Cat#: 31099 |
| Deposited data | ||
| hemibrain (ver. 1.1) | https://neuprint.janelia.org/ | |
| Experimental models: Organisms/strains | ||
| +;+;+ | 93 | N/A |
| +; UAS-shits; UAS-shits | 24 | N/A |
| w; UAS-GCaMP6f; + | 37 | BDSC: #42747 |
| w; +; UAS-jGCaMP7b | 94 | BDSC: #79029 |
| w; UAS-iGluSnFR; + | 44 (Gift from Marc Freeman) | N/A |
| w; +; UAS-iGluSnFR | 44 (Gift from Marc Freeman) | N/A |
| w; +; UAS-CsChrimson.mVenus | BDSC: #55136 | |
| +; +; LexAop-CsChrimson.tdTomato | BDSC: #82183 | |
| y, v; UAS-GluClα RNAi; UAS-Dicer2 | (Gift from Rudy Behnia) | |
| +; UAS-Dicer2 / II+ | 95 | |
| w; +; UAS-myr::GFP | BDSC: #32197 | |
| w; +; nSyb-Gal4 (pan-neuronal) | BDSC: #51941 | |
| w; +; R36B06Gal4 (LPLC1) | 96 | BDSC: #49929 |
| w; R42F06lexA; + (T4/T5) | 96 | BDSC: #54203 |
| w; R64G09AD; R37H04DBD (split LPLC1) | 26 | JRC: OL0029B |
| w; R59E08AD; R42F06DBD (split T4/T5) | 97 | JRC: SS00324 |
| w; R81A05AD; + (for split LPC1) | 45 | BDSC: #70821 (part of SS02575) |
| w; +; VT031495DBD (for split LPC1) | 45 | BDSC: #71726 (part of SS02575) |
| w-; R91C05; R31B08DBD (split DNp03) | 51 | JRC: SS01081 |
| w; VT019018AD; VT017411DBD (split DNp06) | 51 | JRC: SS02256 |
| w; R72A10AD; VT058694DBD (for split PVLP112/113) | BDSC: #86601 | |
| w; +; VT002042DBD (for split PVLP112/113) | BDSC: #71680 | |
| w; +; VT019749DBD (for split PVLP112/113) | BDSC: #73774 | |
| w; VT041832AD; + (for split PLP219) | BDSC: #74313 | |
| w; +; VT021792DBD (for split PLP219) | BDSC: #71916 | |
| w; AD; DBD (enhancer-less split Gal4) | 98 | BDSC: #79603 |
| norpA7; +; + | BDSC: #5685 | |
| Software and algorithms | ||
| MATLAB | Mathworks | |
| Psychtoolbox 3 | 99 | |
| ScanImage 5 | 100 | |
| neuPrint | 101 | |
| Python 3 | ||
| ImageJ | v 1.5.2 | |
Highlights.
Walking flies sense object position and direction to avoid potential collisions
LPLC1 neurons are necessary and sufficient for this collision avoidance
LPLC1 detects collision trajectories using joint direction and position cues
PLP219 is a part of pathways downstream of LPLC1 that mediate collision avoidance
Acknowledgements
We thank the members of the Clark lab as well as A. Nandy, J. Jeanne, and L. Liang for helpful comments and discussions. We are indebted to The Neurotechnology Core at the Kavli Institute for Neuroscience at Yale, especially O. Mano, for the technical support on building the simultaneous behavioral and physiological measurement setup. RT was supported by the Takenaka Foundation and the Gruber Foundation. DAC and this project were supported by NIH R01EY026555 and NIH P30EY026878.
Footnotes
Declaration of Interests
The authors declare no competing interests.
Publisher's Disclaimer: This is a PDF file of an unedited manuscript that has been accepted for publication. As a service to our customers we are providing this early version of the manuscript. The manuscript will undergo copyediting, typesetting, and review of the resulting proof before it is published in its final form. Please note that during the production process errors may be discovered which could affect the content, and all legal disclaimers that apply to the journal pertain.
References
- 1.von Helmholtz H (1924). Helmholtz’s treatise on physiological optics, Vol. 1, Trans. from the 3rd German ed. Southall JPC, ed. (Optical Society of America; ). [Google Scholar]
- 2.Berkeley G (1709). An essay towards a new theory of vision 2nd ed. (Dublin: : printed by Aaron Rhames, for Jeremy Pepyat; ). [Google Scholar]
- 3.Gibson JJ (1966). The Senses Considered as Perceptual Systems (George Allen & Unwin; ). [Google Scholar]
- 4.Goodale M. a, and Milner D (1992). Separate visual pathways for perception and action. Trends Neurosci. 1. [DOI] [PubMed] [Google Scholar]
- 5.Mishkin M, Ungerleider LG, and Macko KA (1983). Object vision and spatial vision: Two cortical pathways. Trends Neurosci. 6, 414–417. [Google Scholar]
- 6.Bradley DC, Chang GC, and Andersen RA (1998). Encoding of three-dimensional structure-from-motion by primate area MT neurons. Nature 392, 714–717. [DOI] [PubMed] [Google Scholar]
- 7.Guo C, Pan Y, and Gong Z (2019). Recent Advances in the Genetic Dissection of Neural Circuits in Drosophila. Neurosci. Bull. 35, 1058–1072. [DOI] [PMC free article] [PubMed] [Google Scholar]
- 8.Scheffer LK, Xu CS, Januszewski M, Lu Z, Takemura SY, Hayworth KJ, Huang GB, Shinomiya K, Maitin-Shepard J, Berg S, et al. (2020). A connectome and analysis of the adult drosophila central brain. Elife 9, 1–74. [DOI] [PMC free article] [PubMed] [Google Scholar]
- 9.Borst A, Haag J, and Mauss AS (2020). How fly neurons compute the direction of visual motion. J. Comp. Physiol. A 206, 109–124. [DOI] [PMC free article] [PubMed] [Google Scholar]
- 10.Yang HH, and Clandinin TR (2018). Elementary Motion Detection in Drosophila : Algorithms and Mechanisms. Annu. Rev. Vis. Sci. 4, 143–163. [DOI] [PMC free article] [PubMed] [Google Scholar]
- 11.Branco T, and Redgrave P (2020). The Neural Basis of Escape Behavior in Vertebrates. Annu. Rev. Neurosci. 43, 417–439. [DOI] [PubMed] [Google Scholar]
- 12.Peek MY, and Card GM (2016). Comparative approaches to escape. Curr. Opin. Neurobiol. 41, 167–173. [DOI] [PubMed] [Google Scholar]
- 13.Murtaugh SA, and Criel HE (1966). Fundamentals of proportional navigation. IEEE Spectr. 3, 75–85. [Google Scholar]
- 14.Zabala F, Polidoro P, Robie AA, Branson K, Perona P, and Dickinson MH (2012). A simple strategy for detecting moving objects during locomotion revealed by animal-robot interactions. Curr. Biol. 22, 1344–1350. [DOI] [PMC free article] [PubMed] [Google Scholar]
- 15.Chalupka K, Dickinson M, and Perona P (2016). Generalized regressive motion: A visual cue to collision. Bioinspiration and Biomimetics 11. [DOI] [PubMed] [Google Scholar]
- 16.Creamer MS, Mano O, Tanaka R, and Clark DA (2019). A flexible geometry for panoramic visual and optogenetic stimulation during behavior and physiology. J. Neurosci. Methods 323, 48–55. [DOI] [PMC free article] [PubMed] [Google Scholar]
- 17.Salazar-Gatzimas E, Chen J, Creamer MS, Mano O, Mandel HB, Matulis CA, Pottackal J, and Clark DA (2016). Direct Measurement of Correlation Responses in Drosophila Elementary Motion Detectors Reveals Fast Timescale Tuning. Neuron 92, 227–239. [DOI] [PMC free article] [PubMed] [Google Scholar]
- 18.DeAngelis BD, Zavatone-Veth JA, and Clark DA (2019). The manifold structure of limb coordination in walking Drosophila. Elife 8, 1–34. [DOI] [PMC free article] [PubMed] [Google Scholar]
- 19.Branson K, Robie AA, Bender J, Perona P, and Dickinson MH (2009). High-throughput ethomics in large groups of Drosophila. Nat. Methods 6, 451–457. [DOI] [PMC free article] [PubMed] [Google Scholar]
- 20.Maimon G, Straw AD, and Dickinson MH (2008). A Simple Vision-Based Algorithm for Decision Making in Flying Drosophila. Curr. Biol. 18, 464–470. [DOI] [PubMed] [Google Scholar]
- 21.Tanaka R, and Clark DA (2020). Object-Displacement-Sensitive Visual Neurons Drive Freezing in Drosophila. Curr. Biol. 30, 1–19. [DOI] [PMC free article] [PubMed] [Google Scholar]
- 22.Creamer MS, Mano O, and Clark DA (2018). Visual Control of Walking Speed in Drosophila. Neuron 100, 1460–1473.e6. [DOI] [PMC free article] [PubMed] [Google Scholar]
- 23.Maisak MS, Haag J, Ammer G, Serbe E, Meier M, Leonhardt A, Schilling T, Bahl A, Rubin GM, Nern A, et al. (2013). A directional tuning map of Drosophila elementary motion detectors. Nature 500, 212–6. [DOI] [PubMed] [Google Scholar]
- 24.Kitamoto T (2001). Conditional modification of behavior in drosophila by targeted expression of a temperature-sensitive shibire allele in defined neurons. Dev. Neurobiol. 47, 81–92. [DOI] [PubMed] [Google Scholar]
- 25.Mu L, Ito K, Bacon JP, and Strausfeld NJ (2012). Optic Glomeruli and Their Inputs in Drosophila Share an Organizational Ground Pattern with the Antennal Lobes. J. Neurosci. 32, 6061–6071. [DOI] [PMC free article] [PubMed] [Google Scholar]
- 26.Wu M, Nern A, Williamson WR, Morimoto MM, Reiser MB, Card GM, and Rubin GM (2016). Visual projection neurons in the Drosophila lobula link feature detection to distinct behavioral programs. Elife 5, e21022. [DOI] [PMC free article] [PubMed] [Google Scholar]
- 27.Panser K, Tirian L, Schulze F, Villalba S, Jefferis GSXE, Bühler K, and Straw AD (2016). Automatic Segmentation of Drosophila Neural Compartments Using GAL4 Expression Data Reveals Novel Visual Pathways. Curr. Biol. 26, 1943–1954. [DOI] [PMC free article] [PubMed] [Google Scholar]
- 28.Isaacson MD (2018). Using new tools to study the neural mechanisms of sensation : Auditory processing in locusts and translational motion vision in flies. 1–114.
- 29.Fischbach KF, and Dittrich APM (1989). The optic lobe of Drosophila melanogaster. I. A Golgi analysis of wild-type structure. Cell Tissue Res. 258, 441–475. [Google Scholar]
- 30.Eliason J (2017). Single Neuron Contributions to Sensory Behaviors in Drosophila melanogaster.
- 31.Ache JM, Polsky J, Alghailani S, Parekh R, Breads P, Peek MY, Bock DD, von Reyn CR, and Card GM (2019). Neural Basis for Looming Size and Velocity Encoding in the Drosophila Giant Fiber Escape Pathway. Curr. Biol. 29, 1073–1081.e4. [DOI] [PubMed] [Google Scholar]
- 32.Klapoetke NC, Nern A, Peek MY, Rogers EM, Breads P, Rubin GM, Reiser MB, and Card GM (2017). Ultra-selective looming detection from radial motion opponency. Nature 551, 237–241. [DOI] [PMC free article] [PubMed] [Google Scholar]
- 33.von Reyn CR, Nern A, Williamson WR, Breads P, Wu M, Namiki S, and Card GM (2017). Feature Integration Drives Probabilistic Behavior in the Drosophila Escape Response. Neuron 94, 1190–1204.e6. [DOI] [PubMed] [Google Scholar]
- 34.Ribeiro IMA, Drews M, Bahl A, Machacek C, Borst A, and Dickson BJ (2018). Visual Projection Neurons Mediating Directed Courtship in Drosophila. Cell 174, 607–621.e18. [DOI] [PubMed] [Google Scholar]
- 35.Klapoetke NC, Murata Y, Kim SS, Pulver SR, Birdsey-Benson A, Cho YK, Morimoto TK, Chuong AS, Carpenter EJ, Tian Z, et al. (2014). Independent optical excitation of distinct neural populations. Nat. Methods 11, 338–346. [DOI] [PMC free article] [PubMed] [Google Scholar]
- 36.de Vries SEJ, and Clandinin T (2013). Optogenetic stimulation of escape behavior in Drosophila melanogaster. J. Vis. Exp, 1–6. [DOI] [PMC free article] [PubMed] [Google Scholar]
- 37.Chen T-WW, Wardill TJ, Sun Y, Pulver SR, Renninger SL, Baohan A, Schreiter ER, Kerr RA, Orger MB, Jayaraman V, et al. (2013). Ultrasensitive fluorescent proteins for imaging neuronal activity. Nature 499, 295–300. [DOI] [PMC free article] [PubMed] [Google Scholar]
- 38.Otsuna H, and Ito K (2006). Systematic analysis of the visual projection neurons ofDrosophila melanogaster. I. Lobula-specific pathways. J. Comp. Neurol. 497, 928–958. [DOI] [PubMed] [Google Scholar]
- 39.Morimoto MM, Nern A, Zhao A, Rogers EM, Wong AM, Isaacson MD, Bock DD, Rubin GM, and Reiser MB (2020). Spatial readout of visual looming in the central brain of Drosophila. Elife 9, e57685. [DOI] [PMC free article] [PubMed] [Google Scholar]
- 40.Keleş MF, and Frye MA (2017). Object-Detecting Neurons in Drosophila. Curr. Biol. 27, 1–8. [DOI] [PMC free article] [PubMed] [Google Scholar]
- 41.Städele C, Keleş MF, Mongeau J-MM, and Frye MA (2020). Non-canonical Receptive Field Properties and Neuromodulation of Feature-Detecting Neurons in Flies. Curr. Biol. 30, 2508–2519.e6. [DOI] [PMC free article] [PubMed] [Google Scholar]
- 42.Konstantinides N, Kapuralin K, Fadil C, Barboza L, Satija R, and Desplan C (2018). Phenotypic Convergence: Distinct Transcription Factors Regulate Common Terminal Features. Cell 174, 622–635.e13. [DOI] [PMC free article] [PubMed] [Google Scholar]
- 43.Keleş MF, Hardcastle BJ, Städele C, Qi X, and Frye MA (2020). Inhibitory interactions and columnar inputs to an object motion detector in Drosophila. Cell Rep. 30, 2115–2124. [DOI] [PMC free article] [PubMed] [Google Scholar]
- 44.Marvin JS, Borghuis BG, Tian L, Cichon J, Harnett MT, Akerboom J, Gordus A, Renninger SL, Chen TW, Bargmann CI, et al. (2013). An optimized fluorescent probe for visualizing glutamate neurotransmission. Nat. Methods 10, 162–170. [DOI] [PMC free article] [PubMed] [Google Scholar]
- 45.Davis FP, Nern A, Picard S, Reiser MB, Rubin GM, Eddy SR, and Henry GL (2020). A Genetic, Genomic, and Computational Resource for Exploring Neural Circuit Function. Elife 9, e50901. [DOI] [PMC free article] [PubMed] [Google Scholar]
- 46.Liu WW, and Wilson RI (2013). Glutamate is an inhibitory neurotransmitter in the Drosophila olfactory system. Proc. Natl. Acad. Sci. U. S. A. 110, 10294–10299. [DOI] [PMC free article] [PubMed] [Google Scholar]
- 47.Mauss AS, Pankova K, Arenz A, Nern A, Rubin GM, and Borst A (2015). Neural Circuit to Integrate Opposing Motions in the Visual Field. Cell 162, 351–362. [DOI] [PubMed] [Google Scholar]
- 48.Özel MN, Simon F, Jafari S, Holguera I, Chen Y-C, Benhra N, El-Danaf RN, Kapuralin K, Malin JA, Konstantinides N, et al. (2021). Neuronal diversity and convergence in a visual system developmental atlas. Nature 589, 88–95. [DOI] [PMC free article] [PubMed] [Google Scholar]
- 49.Molina-Obando S, Vargas-Fique JF, Henning M, Gür B, Schlad TM, Akhtar J, Berger TK, and Silies M (2019). On selectivity in the drosophila visual system is a multisynaptic process involving both glutamatergic and GABAergic inhibition. Elife 8, 1–34. [DOI] [PMC free article] [PubMed] [Google Scholar]
- 50.Kim K, Lee YS, Harris D, Nakahara K, and Carthew RW (2006). The RNAi pathway initiated by Dicer-2 in Drosophila. Cold Spring Harb. Symp. Quant. Biol. 71, 39–44. [DOI] [PubMed] [Google Scholar]
- 51.Namiki S, Dickinson MH, Wong AM, Korff W, and Card GM (2018). The functional organization of descending sensory-motor pathways in Drosophila. Elife 7, e34272. [DOI] [PMC free article] [PubMed] [Google Scholar]
- 52.Schiff W, Caviness JA, and Gibson JJ (1962). Persistent Fear Responses in Rhesus Monkeys to the Optical Stimulus of “Looming.” Science (80-. ). 136. [DOI] [PubMed] [Google Scholar]
- 53.Yilmaz M, and Meister M (2013). Rapid innate defensive responses of mice to looming visual stimuli. Curr. Biol. 23, 2011–2015. [DOI] [PMC free article] [PubMed] [Google Scholar]
- 54.De Franceschi G, Vivattanasarn T, Saleem AB, and Solomon SG (2016). Vision Guides Selection of Freeze or Flight Defense Strategies in Mice. Curr. Biol. 26, 2150–2154. [DOI] [PubMed] [Google Scholar]
- 55.Kim T, Shen N, Hsiang J, Johnson KP, and Kerschensteiner D (2020). Dendritic and parallel processing of visual threats in the retina control defensive responses. Sci. Adv. 6, eabc9920. [DOI] [PMC free article] [PubMed] [Google Scholar]
- 56.Sun H, and Frost BJ (1998). Computation of different optical variables of looming objects in pigeon nucleus rotundus neurons. Nat. Neurosci. 1, 296–303. [DOI] [PubMed] [Google Scholar]
- 57.Temizer I, Donovan JC, Baier H, and Semmelhack JL (2015). A Visual Pathway for Looming-Evoked Escape in Larval Zebrafish. Curr. Biol. 25, 1823–1834. [DOI] [PubMed] [Google Scholar]
- 58.Gabbiani F, Krapp HG, and Laurent G (1999). Computation of object approach by a wide-field, motion-sensitive neuron. J. Neurosci. 19, 1122–1141. [DOI] [PMC free article] [PubMed] [Google Scholar]
- 59.Gabbiani F, Krapp HG, Koch C, and Laurent G (2002). Multiplicative computation in a visual neuron sensitive to looming. 420. [DOI] [PubMed] [Google Scholar]
- 60.Card GM, and Dickinson MH (2008). Visually Mediated Motor Planning in the Escape Response of Drosophila. Curr. Biol. 18, 1300–1307. [DOI] [PubMed] [Google Scholar]
- 61.von Reyn CR, Breads P, Peek MY, Zheng GZ, Williamson WR, Yee AL, Leonardo A, and Card GM (2014). A spike-timing mechanism for action selection. Nat. Neurosci. 17, 962–970. [DOI] [PubMed] [Google Scholar]
- 62.Kane SA, and Zamani M (2014). Falcons pursue prey using visual motion cues: New perspectives from animal-borne cameras. J. Exp. Biol. 217, 225–234. [DOI] [PMC free article] [PubMed] [Google Scholar]
- 63.Mischiati M, Lin HT, Herold P, Imler E, Olberg R, and Leonardo A (2015). Internal models direct dragonfly interception steering. Nature 517, 333–338. [DOI] [PubMed] [Google Scholar]
- 64.Ghose K, Horiuchi TK, Krishnaprasad PS, and Moss CF (2006). Echolocating bats use a nearly time-optimal strategy to intercept prey. PLoS Biol. 4, 865–873. [DOI] [PMC free article] [PubMed] [Google Scholar]
- 65.Land MF (1993). Chasing and pursuit in the dolichopodid fly Poecilobothrus nobilitatus. J. Comp. Physiol. A 173, 605–613. [Google Scholar]
- 66.Chiu C, Reddy PV, Xian W, Krishnaprasad PS, and Moss CF (2010). Effects of competitive prey capture on flight behavior and sonar beam pattern in paired big brown bats, Eptesicus fuscus. J. Exp. Biol. 213, 3348–3356. [DOI] [PMC free article] [PubMed] [Google Scholar]
- 67.Bahl A, Ammer G, Schilling T, and Borst A (2013). Object tracking in motion-blind flies. Nat. Neurosci. 16, 730–738. [DOI] [PubMed] [Google Scholar]
- 68.Poggio T, and Reichardt W (1973). A theory of the pattern induced flight orientation of the fly Musca domestica. Biol. Cybern. 12, 185–203. [DOI] [PubMed] [Google Scholar]
- 69.Shinomiya K, Nern A, Meinertzhagen IA, Plaza SM, and Reiser MB (2021). Neuronal circuits integrating visual motion information in Drosophila. bioRxiv, 2021.12.20.473513. [DOI] [PubMed] [Google Scholar]
- 70.Marder E, and Goaillard JM (2006). Variability, compensation and homeostasis in neuron and network function. Nat. Rev. Neurosci. 7, 563–574. [DOI] [PubMed] [Google Scholar]
- 71.Baines RA (2003). Postsynaptic protein kinase A reduces neuronal excitability in response to increased synaptic excitation in the Drosophila CNS. J. Neurosci. 23, 8664–8672. [DOI] [PMC free article] [PubMed] [Google Scholar]
- 72.Ravenscroft TA, Janssens J, Lee PT, Tepe B, Marcogliese PC, Makhzami S, Holmes TC, Aerts S, and Bellen HJ (2020). Drosophila voltage-gated sodium channels are only expressed in active neurons and are localized to distal axonal initial segment-like domains. J. Neurosci. 40, 7999–8024. [DOI] [PMC free article] [PubMed] [Google Scholar]
- 73.Heukamp AS, Warwick RA, and Rivlin-Etzion M (2020). Topographic Variations in Retinal Encoding of Visual Space. Annu. Rev. Vis. Sci. 6, 237–259. [DOI] [PubMed] [Google Scholar]
- 74.Bleckert A, Schwartz GW, Turner MH, Rieke F, and Wong ROL (2014). Visual space is represented by nonmatching topographies of distinct mouse retinal ganglion cell types. Curr. Biol. 24, 310–315. [DOI] [PMC free article] [PubMed] [Google Scholar]
- 75.Hughes A (1977). The Topography of Vision in Mammals of Contrasting Life Style. In The Visual System in Vertebrates, pp. 613–756. [Google Scholar]
- 76.Harvey BM, and Dumoulin SO (2011). The relationship between cortical magnification factor and population receptive field size in human visual cortex: Constancies in cortical architecture. J. Neurosci. 31, 13604–13612. [DOI] [PMC free article] [PubMed] [Google Scholar]
- 77.Sasaki Y, Rajimehr R, Kim BW, Ekstrom LB, Vanduffel W, and Tootell RBH (2006). The Radial Bias: A Different Slant on Visual Orientation Sensitivity in Human and Nonhuman Primates. Neuron 51, 661–670. [DOI] [PubMed] [Google Scholar]
- 78.Li Y. tang, Turan Z, and Meister M (2020). Functional Architecture of Motion Direction in the Mouse Superior Colliculus. Curr. Biol. 30, 3304–3315.e4. [DOI] [PMC free article] [PubMed] [Google Scholar]
- 79.Chen H, Savier EL, DePiero VJ, and Cang J (2021). Lack of evidence for stereotypical direction columns in the mouse superior colliculus. J. Neurosci. 41, 461–473. [DOI] [PMC free article] [PubMed] [Google Scholar]
- 80.Barlow HB, and Hill RM (1963). Selective sensitivity to direction of movement in ganglion cells of the rabbit retina. Science (80-. ). 139, 412–414. [DOI] [PubMed] [Google Scholar]
- 81.Semmelhack JL, Donovan JC, Thiele TR, Kuehn E, Laurell E, and Baier H (2014). A dedicated visual pathway for prey detection in larval zebrafish. Elife 3, 1–19. [DOI] [PMC free article] [PubMed] [Google Scholar]
- 82.Ölveczky BP, Baccus SA, and Meister M (2003). Segregation of object and background motion in the retina. Nature 423, 401–408. [DOI] [PubMed] [Google Scholar]
- 83.Zhang Y, Kim I-J, Sanes JR, and Meister M (2012). The most numerous ganglion cell type of the mouse retina is a selective feature detector. Proc. Natl. Acad. Sci. U. S. A. 109, E2391–8. [DOI] [PMC free article] [PubMed] [Google Scholar]
- 84.Robles E, Laurell E, and Baier H (2014). The retinal projectome reveals brain-area-specific visual representations generated by ganglion cell diversity. Curr. Biol. 24, 2085–2096. [DOI] [PubMed] [Google Scholar]
- 85.Hong YK, Kim IJ, and Sanes JR (2011). Stereotyped axonal arbors of retinal ganglion cell subsets in the mouse superior colliculus. J. Comp. Neurol. 519, 1691–1711. [DOI] [PMC free article] [PubMed] [Google Scholar]
- 86.Bianco IH, and Engert F (2015). Visuomotor transformations underlying hunting behavior in zebrafish. Curr. Biol. 25, 831–846. [DOI] [PMC free article] [PubMed] [Google Scholar]
- 87.Förster D, Helmbrecht TO, Mearns DS, Jordan L, Mokayes N, and Baier H (2020). Retinotectal circuitry of larval zebrafish is adapted to detection and pursuit of prey. Elife 9, 1–26. [DOI] [PMC free article] [PubMed] [Google Scholar]
- 88.Antinucci P, Folgueira M, and Bianco IH (2019). Pretectal neurons control hunting behaviour. Elife 8, 1–34. [DOI] [PMC free article] [PubMed] [Google Scholar]
- 89.Hoy JL, Bishop HI, and Niell CM (2019). Defined Cell Types in Superior Colliculus Make Distinct Contributions to Prey Capture Behavior in the Mouse. Curr. Biol. 29, 4130–4138.e5. [DOI] [PMC free article] [PubMed] [Google Scholar]
- 90.Sanes JR, and Zipursky SL (2010). Design Principles of Insect and Vertebrate Visual Systems. Neuron 66, 15–36. [DOI] [PMC free article] [PubMed] [Google Scholar]
- 91.Clark DA, and Demb JB (2016). Parallel Computations in Insect and Mammalian Visual Motion Processing. Curr. Biol. 26, R1062–R1072. [DOI] [PMC free article] [PubMed] [Google Scholar]
- 92.Borst A, and Helmstaedter M (2015). Common circuit design in fly and mammalian motion vision. Nat. Neurosci. 18, 1067–1076. [DOI] [PubMed] [Google Scholar]
- 93.Gohl DM, Silies MA, Gao XJ, Bhalerao S, Luongo FJ, Lin CC, Potter CJ, and Clandinin TR (2011). A versatile in vivo system for directed dissection of gene expression patterns. Nat. Methods 8, 231–237. [DOI] [PMC free article] [PubMed] [Google Scholar]
- 94.Dana H, Sun Y, Mohar B, Hulse BK, Kerlin AM, Hasseman JP, Tsegaye G, Tsang A, Wong A, Patel R, et al. (2019). High-performance calcium sensors for imaging activity in neuronal populations and microcompartments. Nat. Methods 16, 649–657. [DOI] [PubMed] [Google Scholar]
- 95.Dietzl G, Chen D, Schnorrer F, Su KC, Barinova Y, Fellner M, Gasser B, Kinsey K, Oppel S, Scheiblauer S, et al. (2007). A genome-wide transgenic RNAi library for conditional gene inactivation in Drosophila. Nature 448, 151–156. [DOI] [PubMed] [Google Scholar]
- 96.Jenett A, Rubin GM, Ngo TTB, Shepherd D, Murphy C, Dionne H, Pfeiffer BD, Cavallaro A, Hall D, Jeter J, et al. (2012). A GAL4-Driver Line Resource for Drosophila Neurobiology. Cell Rep. 2, 991–1001. [DOI] [PMC free article] [PubMed] [Google Scholar]
- 97.Schilling T, and Borst A (2015). Local motion detectors are required for the computation of expansion Flow-Fields. Biol. Open 4, 1105–1108. [DOI] [PMC free article] [PubMed] [Google Scholar]
- 98.Hampel S, Franconville R, Simpson JH, and Seeds AM (2015). A neural command circuit for grooming movement control. Elife 4, 1–26. [DOI] [PMC free article] [PubMed] [Google Scholar]
- 99.Kleiner M, Brainard DH, and Pelli D (2007). “Whats new in Psychtoolbox-3?” Percept 36 ECVP Abstr. Suppl. [Google Scholar]
- 100.Pologruto TA, Sabatini BL, and Svoboda K (2003). ScanImage: Flexible software for operating laser scanning microscopes. Biomed. Eng. Online 2, 1–9. [DOI] [PMC free article] [PubMed] [Google Scholar]
- 101.Clements J, Dolafi T, Umayam L, Neubarth NL, Berg S, Scheffer LK, and Plaza SM (2020). neuPrint: Analysis Tools for EM Connectomics. bioRxiv, 2020.01.16.909465. [DOI] [PMC free article] [PubMed] [Google Scholar]
- 102.Wilson RI, Turner GC, and Laurent G (2004). Transformation of Olfactory Representations in the Drosophila Antennal Lobe. Science (80-. ). 303, 366–370. [DOI] [PubMed] [Google Scholar]
- 103.Meyer F (1994). Topographic distance and watershed lines. Signal Processing 38, 113–125. [Google Scholar]
- 104.Strother JA, Wu S-T, Rogers EM, Eliason JLM, Wong AM, Nern A, and Reiser MB (2017). Behavioral state modulates the ON visual motion pathway of Drosophila. Proc. Natl. Acad. Sci. U. S. A, 201703090. [DOI] [PMC free article] [PubMed] [Google Scholar]
- 105.Seelig JD, Chiappe ME, Lott GK, Dutta A, Osborne JE, Reiser MB, and Jayaraman V (2010). Two-photon calcium imaging from head-fixed Drosophila during optomotor walking behavior. Nat. Methods 7, 535–540. [DOI] [PMC free article] [PubMed] [Google Scholar]
- 106.Green J, Vijayan V, Mussells Pires P, Adachi A, and Maimon G (2019). A neural heading estimate is compared with an internal goal to guide oriented navigation. Nat. Neurosci. 22, 1460–1468. [DOI] [PMC free article] [PubMed] [Google Scholar]
- 107.Otsuna H, Ito M, and Kawase T (2018). Color depth MIP mask search: a new tool to expedite Split-GAL4 creation. bioRxiv 4, 318006. [Google Scholar]
- 108.Meissner GW, Dorman Z, Nern A, Forster K, Jeter J, Johnson L, He Y, Lee K, Melton B, Clements J, et al. (2020). An image resource of subdivided Drosophila GAL4-driver expression patterns for neuron-level searches. bioRxiv. [Google Scholar]
Associated Data
This section collects any data citations, data availability statements, or supplementary materials included in this article.
Supplementary Materials
Data S1. The results of the connectomic analyses on the optic lobe neurons. Related to Figure 4. The lists of the annotated T5 neurons found in the hemibrain dataset (sheet 1), the complete results of the clustering analysis on the lobula neurite fragments (sheet 2), and the annotated T2 and T3 neurons (sheet 3).
Video S1. Approach and parallel stimuli on the virtual cylinder. Related to Figure 1F, I. The viewing fly was positioned at the center of the cylinder, facing forward. The cylinder as shown is viewed from above and behind the fly. The virtual cylinder shown here was projected onto the square screens so that the virtual cylinder geometry was preserved from the fly’s perspective.
Video S2. The expression pattern of the newly generated PLP219 split Gal4 line. Related to Figure 5B. The green and blue channels respectively show anti-GFP and anti-brp staining. The genotype of the fly is w/+; VT041832AD/+; VT021792DBD/UAS-myr::GFP. A side of the video is 472 microns long.
Video S3. The expression pattern of the first PVLP112/113 split Gal4 line. Related to Figure 5. The green and blue channels respectively show anti-GFP and anti-brp staining. The genotype of the fly is w/+; R72A10AD/+; VT002042DBD/UAS-myr::GFP. A side of the video is 472 microns long.
Video S4. The expression pattern of the second PVLP112/113 split Gal4 line. Related to Figure 5. The green and blue channels respectively show anti-GFP and anti-brp staining. The genotype of the fly is w/+; R72A10AD/+; VT019749DBD/UAS-myr::GFP. A side of the video is 472 microns long.
Data Availability Statement
The code to perform the numerical simulation of collisions (https://github.com/ClarkLabCode/CollisionSimulation) and connectomic analyses (https://github.com/ClarkLabCode/LPLC1ConnectomeAnalysis) are also deposited to our GitHub repositories. Further information and requests for data and code should be directed to and will be fulfilled by the Lead contact.