

Abstract
Chronic liver diseases, resulting from chronic injuries of various causes, lead to cirrhosis with life-threatening complications including liver failure, portal hypertension, hepatocellular carcinoma. A key unmet medical need is robust non-invasive biomarkers to predict patient outcome, stratify patients for risk of disease progression and monitor response to emerging therapies. Quantitative imaging biomarkers have already been developed, for instance, liver elastography for staging fibrosis or proton density fat fraction on magnetic resonance imaging for liver steatosis. Yet, major improvements, in the field of image acquisition and analysis, are still required to be able to accurately characterize the liver parenchyma, monitor its changes and predict any pejorative evolution across disease progression. Artificial intelligence has the potential to augment the exploitation of massive multi-parametric data to extract valuable information and achieve precision medicine. Machine learning algorithms have been developed to assess non-invasively certain histological characteristics of chronic liver diseases, including fibrosis and steatosis. Although still at an early stage of development, artificial intelligence-based imaging biomarkers provide novel opportunities to predict the risk of progression from early-stage chronic liver diseases toward cirrhosis-related complications, with the ultimate perspective of precision medicine. This review provides an overview of emerging quantitative imaging techniques and the application of artificial intelligence for biomarker discovery in chronic liver disease.
Keywords: Chronic liver disease, Histo-pathological features, Pejorative evolution, Quantitative biomarkers, Elastography, Machine learning, Radiomics, Deep learning
Introduction
Over the last decades, the prevalence of chronic liver diseases (CLD) and their associated morbidity and mortality markedly increased, especially with the rise of non-alcoholic fatty liver disease (NAFLD). A substantial proportion of patients will indeed ultimately develop liver fibrosis and eventually progress toward cirrhosis. Cirrhosis is the end-stage of disease with life-threatening complications (e.g., liver failure, portal hypertension, hepatocellular carcinoma), which accounts for approximately 1.8% of deaths [1]. When chronic liver injuries progress, decompensation of the disease (e.g., ascites, jaundice, gastrointestinal bleeding or hepatic encephalopathy) may occur, resulting in a dramatic decrease in the overall survival rate [2]. Currently, the clinical predictors of the risk of decompensation have a limited impact on the patients’ management and we are unable to accurately monitor the changes or any pejorative evolution of liver parenchyma on imaging alone (e.g., using CT, MRI, ultrasound) [3–5]. The characterization of reference of CLD relies on invasive methods such as liver biopsy, to assess fibrosis, steatosis, and “activity” (i.e., inflammation) or trans-jugular catheterization for portal hypertension (i.e., measure of the hepatic venous pressure gradient). Such invasive and expensive gold standards are obviously inappropriate for screening and sequential monitoring. Additionally, liver biopsy is also prone to risks of under-sampling [6] and/or inter-reader variability [7]. All this leads to a necessary and ongoing transition toward non-invasive assessment of CLD progression and prognosis. Image-based biomarkers can provide a quantitative and reproducible representation of the liver parenchyma including pathogenesis, molecular and genetic pathways and, particularly, of its evolution [8, 9]. Indeed, they can be used at initial diagnosis or at any time during the evolution of the disease, creating the opportunity to impact clinical management.
Several image-based quantitative biomarkers have already emerged. For instance, fibrosis can be non-invasively assessed by ultrasound- or MRI-based elastography techniques. Approaches have been developed to estimate steatosis, exploiting the attenuation of ultrasonic waves or employing advanced MRI acquisitions techniques (e.g., multi-echo DIXON, spectroscopy). Several bio-clinical scoring systems based on routine parameters and liver elastography have proven valuable to predict the first liver-related event and overall survival in patients with cirrhosis [10–12].
Recently, artificial intelligence (AI) has gained spectacular popularity in the scientific community, suggesting that we are at the dawn of a revolution in patients’ care and management. The major strength of AI is its potential to augment the exploitation of massive multi-parametric data, often non-structured and unexploited, to extract valuable information and achieve personalized clinical decisions for patients [9, 13]. AI has the potential to go beyond the human eye and previously cited tools, to finally make biopsy outdated. This review article aims to provide a precise overview of quantitative imaging techniques of diffuse liver diseases, together with an explanation of the different concepts of artificial intelligence, with short- and long-term potential clinical applications for risk stratification and early diagnosis.
Artificial intelligence in imaging
Artificial intelligence (AI), a subfield of computer science, is a “fancy” term gathering different concepts including among others radiomics and machine learning. More precisely, machine learning is the umbrella term referring to the approaches seeking to learn from data without explicit programming. Machine learning can achieve tasks of classification, prediction, segmentation, detection, or images optimization (e.g., faster image acquisition, increased signal-to-noise ratio, etc.). The tasks of segmentation, detection and optimization of images will not be discussed in this article as not directly related to the characterization of CLD.
To achieve classification or prediction of clinical outcomes, different approaches exist, according to the available data and the objectives. The machine can learn from labeled data (e.g., tumor types) to pursue a defined objective (e.g., tumor type classification) or from unlabeled data to reveal unknown structural patterns across data. These approaches are respectively called supervised and unsupervised.
Therefore, AI-based imaging models, or the machine learning process, will seek to identify and combine new imaging biomarkers, inaccessible to the human eye, in a mathematical model [14]. It aims to provide predictive and/or prognostic information about patients and their pathologies, based on sophisticated statistical analysis [8]. Such imaging biomarkers are called radiomics. They are image descriptors reflecting the tissue heterogeneity and indirectly its molecular and genetic substrate [15]. They are reproducible, quantitative, human-engineered (so-called “traditional”) or free (so-called “deep” and automatically calculated). “Traditional” radiomics should be extracted, selected, and combined using a classifier (support vector machine, random forest, etc.) through a high-quality pipeline to ensure its robustness. These key steps should always be detailed to ensure the repeatability of the work. To provide reproducible and standardized processing workflow, but also consistency between studies, the image biomarker standardization initiative (IBSI) proposed biomarkers definitions and reporting guidelines for radiomics studies, including among other data description, image processing or image biomarker computation [16]. Compared to “traditional” radiomics, “deep” radiomics are free of human design, inaccessible to our understanding, and may highlight the most informative imaging markers to solve research hypotheses.
Deep learning (DL) [13, 17], a subclass of machine learning, refers to the deep convolutional neural network (CNN), named by analogy with human neurons (Fig. 1). Input data are weighted based on their importance and undergo a non-linear transformation, called activation function, to result in an output. During the training process, these input weights, or parameters, are computed and optimized, to allow the model to reach the highest diagnostic performances by minimizing the loss error function through a process called back-propagation. Upstream of the adjustment of the weights, designing a DL model requires the right choices regarding the most appropriate CNN architecture and hyper-parameters (number of hidden layers and units, weights initialization, type of activation function, learning rate, regularization technique to prevent overfitting, etc.) for the specific task to be achieved [13, 18]. The more hidden layers there are, the deeper a convolutional neural network is and the more complex the network is. Complexifying a neural network allows the identification and pooling of images features of a higher level of abstraction, thus increasing its performances. However, convolutional neural networks can be so powerful that they can perfectly adjust to a specific dataset, so-called overfitting, resulting in very high diagnostic performances on the training dataset, but preventing its external validation.
Fig. 1.
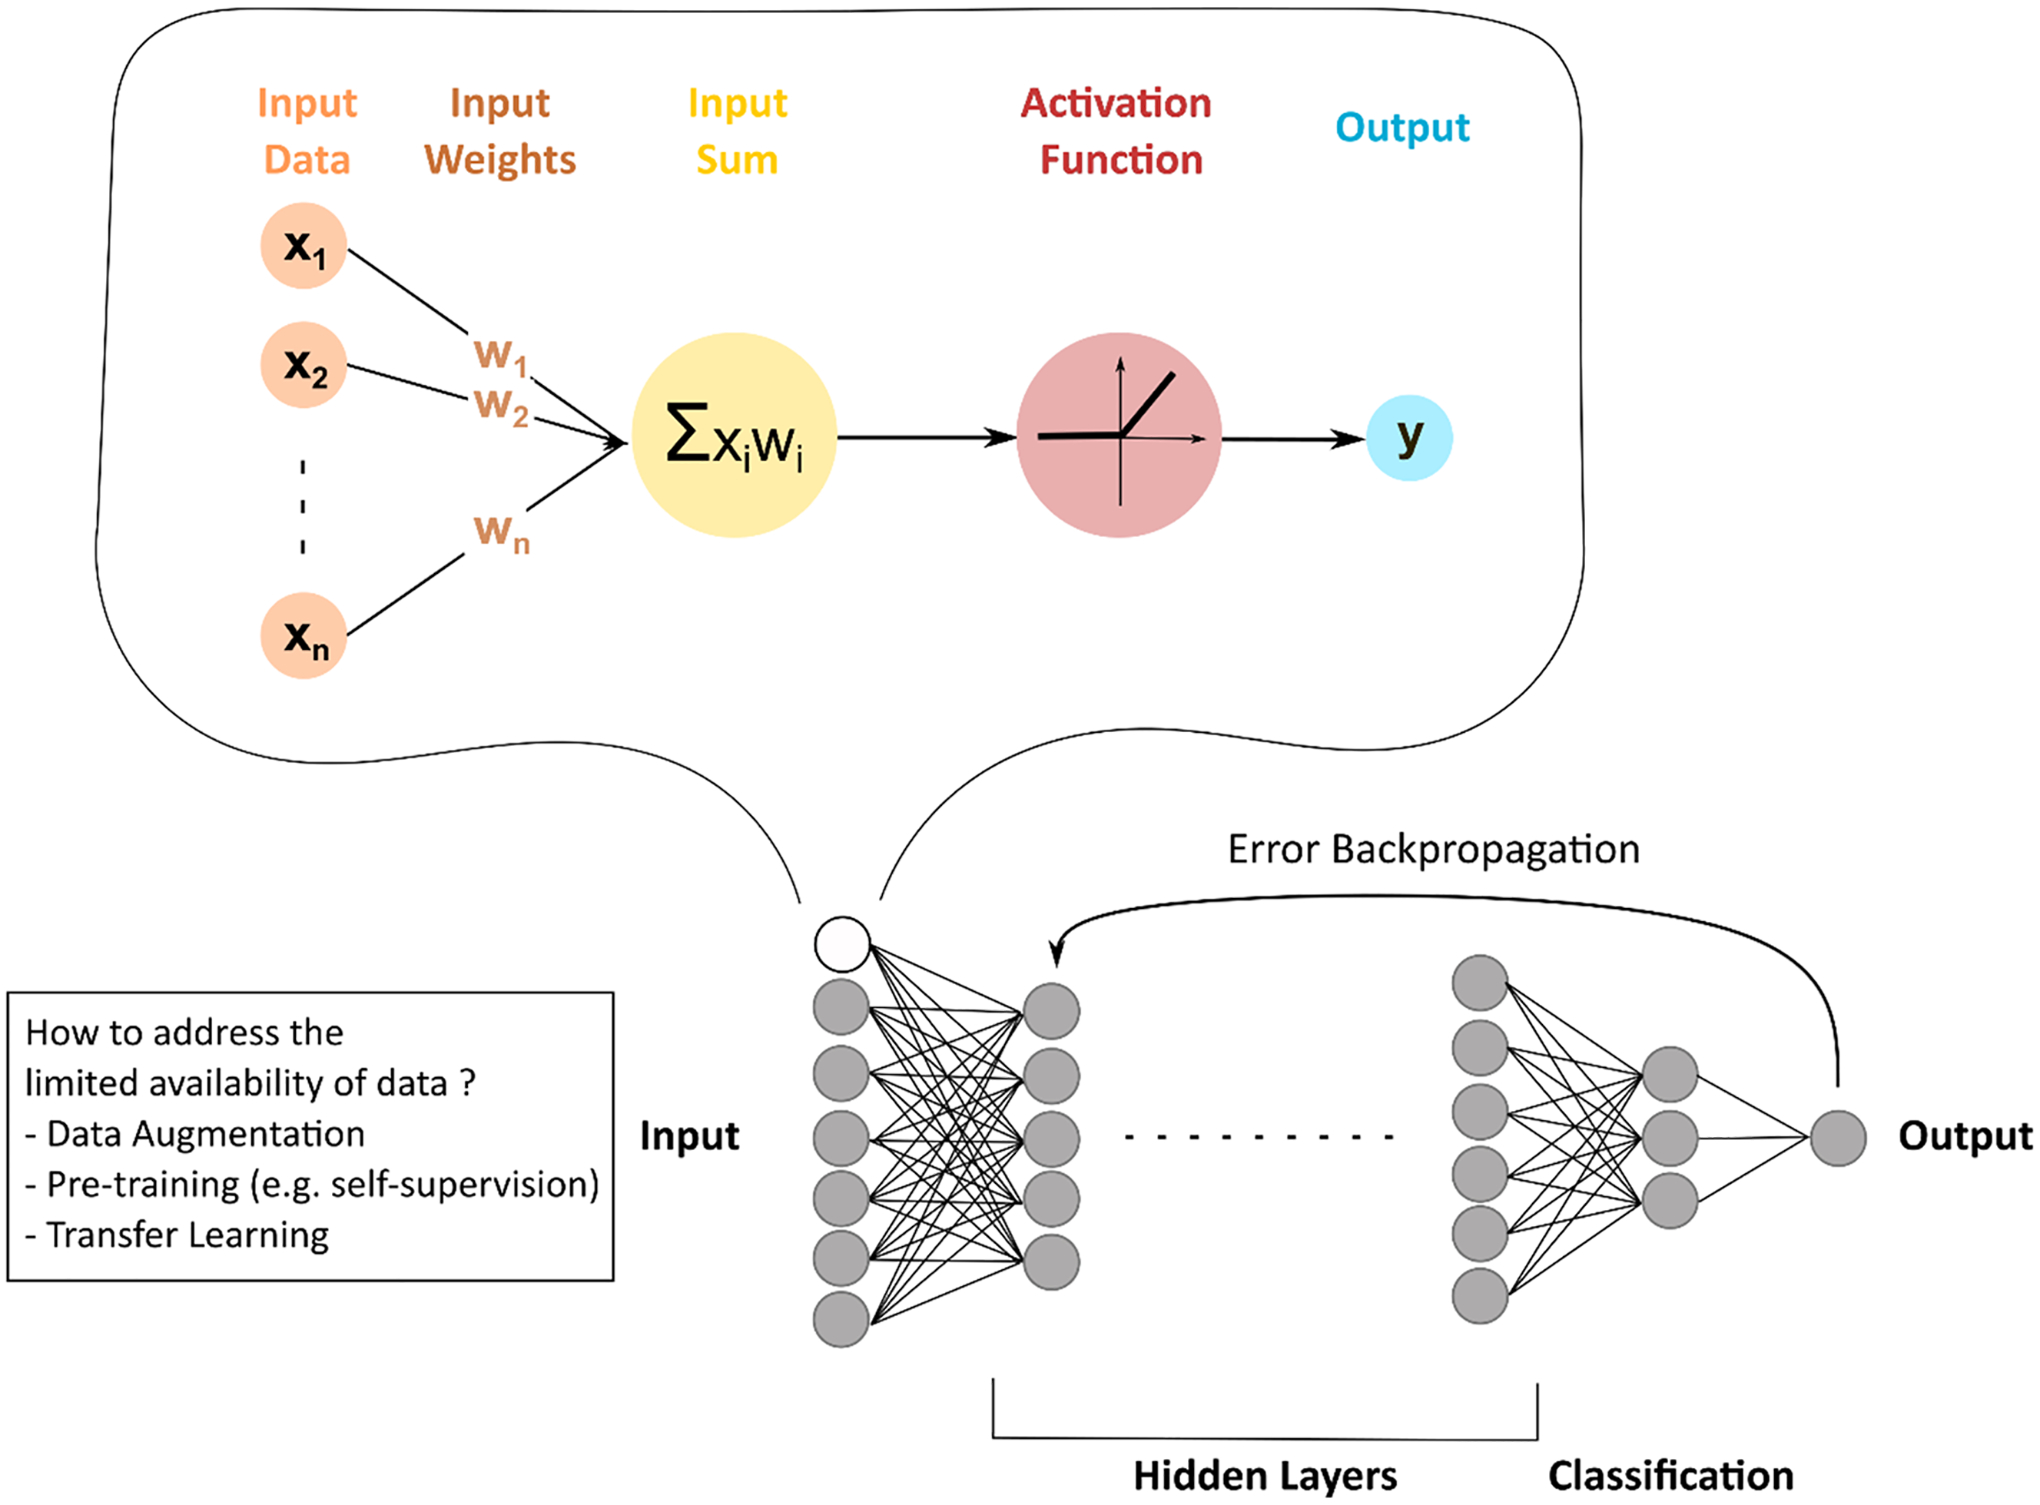
Concepts of deep learning. By analogy to human neurons, deep learning generally refers to neural networks. Input data are weighted based on their importance and undergo a non-linear transformation, called activation function, to result in an output. These input weights, or parameters, are computed and optimized to allow the model to reach the highest diagnostic performances by minimizing the loss error function through a process called back-propagation
It is therefore evident that the quality of data has a major impact on the performance and reliability of AI-based models. First, training datasets should represent the wide spectrum of disease expression. As training datasets are usually built from retrospective data, selection bias should be of critical concern. Because available data in medicine are limited and positive cases of the disease are usually the minority class, techniques of data augmentation (i.e., simple geometric transformations of images or artificial creation of fake data from the original dataset using DL techniques—e.g., generative adversarial network) or transfer learning (i.e., pre-training on larger—not necessarily medical-related— datasets leading to pre-trained model parameters and, faster and more effective training) have been developed. However, techniques of data augmentation should be used with great caution in the field of medical research and only to optimize model training, not to test it. They should be applied by considering disease prevalence and heterogeneity. Furthermore, creating fake images can result in impaired model training. Therefore, samples of such images should be checked by experts. Secondly, testing a model, preferably prospectively, on an independent dataset, as a safety check, is crucial to evaluate its true performance and ensure that there is no overfitting. Moreover, a special focus should be made on the exhaustivity of the representation of the disease spectrum in the testing dataset. These quality steps are of critical importance because machine learning algorithms can be difficult, if not impossible, to understand. To facilitate the quality assessment of AI-related studies, quality scores have been proposed (e.g., radiomics quality score [19], simplified and reproducible AI quality score [20]). Unfortunately, a significant number of research studies does not respect these quality pre-requisites. This explains the limited number of studies cited in this review. However, this cannot fully explain the discrepancy between the considerable number of publications, increasingly following standardized reporting guidelines (e.g., IBSI, CLAIM [16, 21]), and their poor implementation in clinical routine. Multiple obstacles arise. As previously explained, neural networks rely on complex non-linear interactions using hidden factors, making the concepts of transparency, explainability, intelligibility and provability inaccessible, although critical for their acceptability by physicians and patients [22]. The presence of different manufacturers (i.e., vendors), the heterogeneity of imaging acquisition protocols (e.g., different times of contrast injection between centers; use of conventional CT or on dual-energy reconstruction; different T2-weighted MR images depending on the center-specific and non-consensual choice of echo time and repetition time; etc.), and the absence of large and free databases are a direct limitation to the robustness and safety of AI-based models that are even more crucial in medicine. Furthermore, AI-based models should be time-efficient to reach the clinical routine. For instance, manual segmentation cannot be seriously considered and implies developing robust and reproducible automatic segmentation algorithms. Besides these technical limitations, ethical and legal considerations are at stake: how should the patient be informed that medical decisions are enhanced by AI-based algorithms? How can patient privacy be preserved once data are shared with AI developer partners? Who owns the intellectual property of the AI model, computer scientists or data owners? Who will be accountable and responsible for decision-making with AI including potential errors and harm? [23]
Imaging biomarkers for liver fibrosis
Over the past years, significant efforts have been made to develop new quantitative imaging biomarkers, aiming to replace liver biopsy to assess fibrosis, steatosis, iron overload and inflammation (Table 1).
Table 1.
Non-invasive conventional quantitative imaging methods for assessing liver histo-pathological features
| Histo-pathological features | Methods |
|---|---|
| Fibrosis | Elastography: transient elastography, point and 2D shearwave elastography, magnetic resonance elastography Liver surface nodularity Enhancement of liver parenchyma on MR hepatobiliary phase |
| Steatosis | Controlled attenuation parameter (CAP) on transient elastography Ultrasound-based: attenuation coefficient, hepato-renal B-mode ratio, sound speed MRI-based: DIXON method (in/out phase), multi-echo DIXON method (proton density fat fraction), spectroscopy |
| Iron | MRI-based: multi-echo DIXON method |
| Activity | Ultrasound-based: shear wave dispersion MRI-based: damping ratio (complex shear modulus), enhancement of liver parenchyma on hepatobiliary phase, T1 relaxation time, proton-decoupled phosphorus 31 MR spectroscopy |
Fibrosis is the inevitable consequence of all progressive CLD. It is mainly caused by sustained liver insults, resulting in pathological deposition of collagen extracellular matrix and, ultimately, parenchyma and vascular distortion with regenerative nodules [24]. Currently, conventional imaging modalities fail to properly characterize liver fibrosis. Accurate detection of early-stage fibrosis is necessary because appropriate therapeutic management could stop the evolution of fibrosis to cirrhosis. Morphological changes, irregular contours and coarse texture have limited sensitivity to predict significant fibrosis (≥ METAVIR F2) and poorly correlate with fibrosis stages [25]. Quantitative measurement of the liver surface nodularity may improve consistency for the imaging diagnosis of cirrhosis (i.e., METAVIR F4 stage) [26]. This biomarker has also been associated with the detection of portal hypertension and has proven relevant for preoperative assessment of operative risks in patients with resectable hepatocellular carcinoma (HCC) [27, 28]. Gadoxetic acid-enhanced MRI could also be used to estimate fibrosis stages, as relative enhancement on the hepato-biliary phase (at 20 min) negatively correlated with fibrosis [29].
Non-invasive assessment of liver fibrosis has undergone a breakthrough with the rise of elastography techniques (quantitative methods). Liver stiffness, based on the elastic properties of liver tissue, is the non-invasive biomarker of choice for the diagnosis of liver fibrosis, even at an early stage. Elastography techniques demonstrated higher staging performance than serum fibrosis indexes [30], such as the aspartate aminotransferase to platelet index (APRI) or the Fibrosis-4 index (FIB-4), even if their association may be beneficial and complementary [31–33]. Different modalities are available, including vibration-controlled transient elastography (Fibroscan, Echosens, Paris, France), ultrasound-guided elastography [such as point shear wave elastography (pSWE) and 2D shear wave elastography (2D SWE)] and magnetic resonance elastography (MRE) [34, 35]. Transient elastography (TE) estimates the liver stiffness by measuring the speed of a shear wave propagating through the liver parenchyma using pulsed echo ultrasound acquisition. It has been exhaustively evaluated and shown to be effective in predicting advanced fibrosis stages (AUC > 0.72 for ≥ F2 stages and AUC > 0.90 for F4 stage) [36–43]. As it is not associated with any imaging modality, this technique will not be further discussed in this review. However, the same technology has been applied to ultrasound, allowing targeted measurements guided by the imaging abnormalities of the liver parenchyma, with at least equivalent diagnostic performances [44–51]. Unlike pSWE, which only enables a focal measurement of liver stiffness, 2D SWE provides a real-time 2D color mapping of liver stiffness. Unfortunately, each manufacturer providing ultrasound-guided elastography has its specificities, preventing cross-comparison and complexifying the use of cut-off values. In addition, the reproducibility of measurements is affected by the experience of the operator [52]. If 2D SWE is perfectly suited for clinical practice, as it is performed during a conventional ultrasound, its diagnostic performances have been outperformed by MRE, which quickly became the surrogate biomarker of liver fibrosis [53]. This technology is based on shear waves emitted by an external acoustic driver. Indeed, the wave propagation speed and the damping of shear waves are impacted by the frequency vibration due to the dispersion of elastic waves in soft tissues [54]. 3D MRE should be based on multi-frequency excitations because it increases the consistency and reproducibility of the measurements. MRE demonstrated higher accuracy than 2D SWE or TE, especially for early-stage liver fibrosis, with strong reliability for longitudinal follow-up and without inter-observer variability [53, 55–63]. Furthermore, it can be performed in the presence of ascites and measurements are not affected by steatosis [64]. However, MRE is not recommended in routine clinical practice given its cost and limited availability [33]. In addition, 2D SWE also demonstrated high accuracy in predicting first liver-related event, all-cause mortality and infection requiring hospitalization [11].
If the association of conventional imaging and non-invasive assessment of liver stiffness is powerful for grading fibrosis, artificial intelligence can maximize the diagnostic performances of these techniques, by identifying new features (Table 2). In patients at risk of advanced CLD, liver ultrasound is the first imaging modality performed, because of its advantages (i.e., available, non-invasive, radiation-free, less expensive) compared to other techniques (CT or MRI) and the possibility of performing shear wave elastography during the same examination. The same reasons should provide strong relevance for ultrasound-based AI models in clinical routine. A recent study demonstrated high accuracy for the prediction of fibrosis stages using a Deep Convolutional Neural Network trained on B-mode gray-scale ultrasonography images [65]. In an external testing dataset, consistent with acceptable generalizability, the accuracy of the model to predict significant fibrosis (≥ F2) or cirrhosis (F4) was 0.87 and 0.86 respectively. Moreover, applying radiomics analysis to the images of the 2D SWE color mapping could further improve its diagnostic performances. Wang et al. reported increased diagnostic performances of a deep learning model using 2D shear wave elastography (2D SWE) images in predicting liver fibrosis stages [66]. The diagnostic performances of this AI model in predicting significant fibrosis (≥ F2) were higher (AUC = 0.85) than that of 2D SWE alone (AUC = 0.77) or biomarkers, such as APRI (AUC = 0.60) or FIB-4 (AUC = 0.62). Finally, B-mode and 2D SWE images could prove complementary in the training of DL models as suggested by Xue et al. [67].
Table 2.
Artificial intelligence-based biomarkers for grading fibrosis
| Article | Model type | Imaging technique | Reference standards | Sample size (n) | Performance metrics on testing dataset | |||
|---|---|---|---|---|---|---|---|---|
| Training | Validation | Testing | ||||||
| Internal | External | |||||||
| Lee European Radiology 2020 |
Deep learning | B-mode US | METAVIR stages (biopsy or transient elastography) | 3446 | 263 | 266 | 572 | AUC = F4: 0.86 |
| Wang Gut 2019 |
Deep learning | 2D shear wave elastography | METAVIR stages (liver biopsy) | 266 | 132 | AUC = F4: 0.97 ≥ F3: 0.98 ≥ F2: 0.85 |
||
| Xue European Radiology 2020 |
Deep learning | B-mode US and 2D shear wave elastography | Scheuer scoring system (hepatectomy) | 364 | 102 | AUC = F4: 0.95 ≥ F3: 0.93 ≥ F2: 0.93 |
||
| He American Journal of Roentgenology 2019 |
“Traditional” Radiomics |
T2 FSE weighted MRI Clinical factors |
MR elastography Two-class classification (cut-off = 3 kPa) |
225 | 84 | AUC 0.80 |
||
| Hectors European Radiology 2020 |
Deep learning | Gadoxetic acid-enhanced hepatobiliary phase MRI | METAVIR stages (liver biopsy) | 178 | 123 | 54 | AUC = F4: 0.85 ≥ F3: 0.90 ≥ F2: 0.91 |
|
| Yasaka Radiology 2018 |
Deep learning | Gadoxetic acid-enhanced hepatobiliary phase MRI | METAVIR stages (liver biopsy) | 534 | 100 | AUC = F4: 0.84 = F3: 0.84 = F2: 0.85 |
||
| Choi Radiology 2018 |
Deep learning | Portal venous phase CT | METAVIR stages (liver biopsy) | 7461 | 421 | 470 | AUC = F4: 0.95 ≥ F3: 0.97 ≥ F2: 0.96 |
|
For comparative purposes, AUROC values of transient elastography, shear wave elastography and magnetic resonance elastography for detecting advanced fibrosis (≥ stage 3) were 0.88, 0.95 and 0.96 in a meta-analysis published by Xiao et al. [21]
MRI is the most performant, exhaustive and reproducible imaging modality. This explains the predominance of this modality in the AI literature on this problematic. Different studies demonstrated strong diagnostic performances of radiomics [68] and deep learning models [69, 70], either on T2-weighted or on post-contrast sequences. Hectors et al. developed a deep learning model on hepatobiliary phase images, with similar performances to MRE (AUC = 0.91 for predicting significant fibrosis) [69]. However, these encouraging results should be tempered by the constraints of clinical practice. MRI remains a time-consuming and costly technique, especially when compared to the existing efficient ultrasound-based AI models.
Finally, it is interesting to note that the deep learning approach can also be extremely performant using CT images, whereas CT-scan is not the modality of choice in liver imaging. A deep learning algorithm trained on 7461 portal venous phase CT scans with pathologically confirmed liver fibrosis largely outperformed radiologists’ reading and fibrosis biomarkers (APRI and FIB-4) [71]. This model achieved high diagnostic performances, regardless of the etiology of liver disease, with an AUC value of 0.96 for predicting significant fibrosis (≥ F2) in a large testing dataset of 891 patients.
Imaging biomarkers for liver overload
In the context of the increasing prevalence of overweight and type 2 diabetes mellitus, the prevalence of NAFLD is expanding [72]. It covers a wide spectrum of diseases, ranging from isolated liver steatosis to nonalcoholic steatohepatitis, resulting in severe complications including cirrhosis, liver failure, portal hypertension and hepatocellular carcinoma [73–75]. Liver steatosis can be easily assessed. Indeed, steatosis can be evaluated either by TE using the controlled attenuation parameter, ultrasound (e.g., hepato-renal B-mode ratio, attenuation coefficient [76], sound speed [77, 78]) or MRI (e.g., Dixon method with in- and out-of-phases, spectroscopy, proton density fat fraction—PDFF [79]). If the quantification of steatosis on a non-enhanced CT-scan appears easy, as there is a linear correlation between liver attenuation and steatosis, enabling quantitative CT liver fat measurements, CT scan is not a suitable modality for steatosis assessment, due to its poorer diagnostic performance and its ionizing aspect [80]. The controlled attenuation parameter (CAP) and the attenuation coefficient (AC) are the most routinely performed biomarkers with the hepato-renal B-mode ratio. They are based on the same principle of ultrasonic attenuation of the echo wave by the steatotic liver. Measurement of this attenuation allows the estimation of steatosis. The diagnostic performance of CAP and AC in predicting any grade of steatosis, or moderate to severe steatosis (grade 2 and 3), is good, with AUC values of 0.93 versus 0.81 and 0.76 versus 0.89, respectively [77, 81]. The hepato-renal B-mode ratio is defined as the ratio of the echo-genicity of the liver parenchyma to the renal cortex. Moret et al. demonstrated that the diagnostic performances of the B-mode ratio and the CAP were not significantly different in the same population [81]. Lastly, ultrasonic adaptive sound speed estimation, decreased in the presence of steatosis, has been proposed but is still at a preliminary stage of evaluation [77, 78]. Alternatively to the CAP and the AC, MRI offers multiple techniques to estimate steatosis, with unequal diagnostic performances. The Dixon method (1984) is a chemical-shift imaging method using the in-phase/out-of-phase cycling of fat and water, due to different rates of precession. In the presence of steatosis, the signal intensity of the liver drops on the out-of-phase sequence. However, this method is highly subject to inter-reader variability and does not allow quantification of the steatosis. Quantification of steatosis has been achieved by the application of multi-echo Dixon, which compensates for multiple confounders including the T2* relaxation effects and the spectral complexity of fat [82]. This method is named proton density fat fraction (PDFF), defined as the fraction of mobile protons (H1) linked to the triglyceride relative to those of water [e.g., IDEAL IQ (General Electrics), mDixon-Quant (Philips) and Multi-echo VIBE Dixon (Siemens)]. Finally, steatosis can also be assessed by MR spectroscopy, which directly measures the relative proton quantity from water and triglycerides signals. However, this method is limited by the delicate spectral analysis of data and its sampling volume. PDFF-MRI is considered the method of reference, as it allows quantification of steatosis in the entire liver and because it is easy to perform and analyze [82]. It should also be noted that thresholds for grading steatosis differ between PDFF-MRI (6.4%, 17.4%, and 22.1%) and histological analysis (5%, 33%, and 66%). Indeed, the methods of evaluation of steatosis are different [82]. PDFF-MRI considers the proportion of mobile protons within fat molecules in a three-dimensional voxel, whereas histological analysis evaluates the fractions of hepatocytes with fat vacuoles in a two-dimensional plane.
However, if MRI-PDFF is the non-invasive gold standard to assess steatosis, it gathers the limitations of MRI in routine clinical practice (time-consuming and costly technique). The most original and interesting AI-based approach has been published by Han et al. [83]. They developed a one-dimensional deep learning model using raw radiofrequency ultrasound data to diagnose NAFLD and quantify the hepatic fat fraction. If inaccessible to the medical framework, raw radiofrequency ultrasound signals are richer in information than gray-scale B-mode images. It allowed a strong correlation between the ultrasound-based predicted fat fraction and MRI-PDFF (Pearson r = 0.85; p < 0.001), with excellent accuracy (96%) for NAFLD diagnosis in the test cohort. However, the diagnostic performances of the model decreased when MRI-PDFF was greater than 18%.
Besides steatosis, MRI is also the non-invasive gold standard to detect and quantify liver iron concentration [84, 85]. It is a reliable method based on multi-echo gradient-echo sequences, available on every device, either 1.5 or 3-Tesla MRI. Liver iron overload results in lower liver intensity due to T2 and T2* relaxation time shortening. Quantification can be obtained by the computation of T2* (or R2*), by measuring the liver to muscle signal intensity ratio (SIR) or by combining both methods. It can be coupled with that of liver steatosis by the DIXON method. As iron deposition in the liver is responsible for toxicity, monitoring liver iron overload could become a prognostic factor of progression of CLD [86, 87]. Neither ultrasound nor CT scan, whether or not enhanced by AI, has proven valuable for the detection or quantification of iron overload.
Pejorative evolution of chronic liver diseases
The prediction of the risk of progression of CLD is in the spotlight. It is particularly true with the increasing prevalence of NAFLD as its progression to steatohepatitis (NASH) predisposes to cirrhosis and HCC. NASH is characterized by the presence of steatosis with lobular inflammation and hepatocyte ballooning, leading to necrosis, apoptosis, increased collagen extracellular matrix and ultimately, fibrosis. In this field, the development of noninvasive markers is at its preliminary stages. Recently, 2D SWE demonstrated greater capabilities in liver characterization than solely stiffness assessment using shear waves speed. Indeed, shear waves disperse as they pass through the liver. Such dispersion can be estimated using a mathematical parameter called the dispersion slope. Sugimoto et al. suggested that this parameter was indirectly impacted by lobular inflammation, which could be helpful to detect and grade inflammation [88, 89], gold standard but could also be biased as it correlates with liver fibrosis [90, 91]. The combination of this parameter with the assessment of steatosis (using the attenuation coefficient) and fibrosis (using shear wave elasticity) could become an acceptable substitute to the pathology gold standard in NASH. These concepts have also been explored using MR elastography. The damping ratio, derived from the complex shear modulus, could discriminate NASH, even without advanced fibrosis, raising the possibility of reflecting inflammation [92]. Besides fibrosis as mentioned above, Bastati et al. also showed that gadoxetic acid-enhanced MRI could be used to distinguish NAFLD from NASH, as the relative enhancement on the hepato-biliary phase (at 20 min) negatively correlated with the degree of lobular inflammation and ballooning, but not with steatosis [29]. Other MRI-derived parameters, such as the T1 relaxation time, have also proven valuable in identifying NASH when combined with fat fraction and liver stiffness [93, 94]. Proton-decoupled phosphorus 31 MR spectroscopy may also help because of the changes in metabolites concentrations in NASH including NADPH (reduced form of nicotinamide adenine dinucleotide phosphate), a marker of inflammation and fibrinogenic activity in the liver [95]. The relative failure of accurately assessing non-invasively liver inflammation may be overcome by AI-based techniques in future.
In compensated advanced CLD, as the problem is no longer to predict the risk of progression of fibrosis, it is relevant to focus on the patient survival cliff which is characterized by the occurrence of HCC, portal hypertension decompensation or liver failure.
If HCC risk stratification models based on clinical-biological (age, sex, diabetes, AST/ALT, albumin, platelets, etc.) parameters exist [96–102], they cannot consider the direct analysis of the liver parenchyma, which is the pathophysiological substrate of hepato-carcinogenesis. In the 1990s, several authors studied the incidence of HCC according to the liver echostructure [103–105]. They concurred on the excess risk of a nodular heterogeneous echostructure with an estimated relative risk of up to 20 [103]. Unfortunately, this did not lead to the development of reliable imaging risk stratification models.
Clinically significant portal hypertension (CSPH), defined by a hepatic venous pressure gradient (HVPG) ≥ 10 mmHg, is critical for CLD prognosis. If the definition relies on the invasive measurement of the HPVG, different non-invasive liver-based approaches have been developed. As previously discussed, liver stiffness is a robust biomarker of liver fibrosis. It was therefore expected to observe a correlation between liver stiffness and HPVG and a capability to discriminate patients with CSPH [106–110]. Furthermore, liver stiffness was also proven to have a prognostic value for portal hypertension-related complications including clinical decompensation and variceal bleeding [111–113]. As liver surface nodularity is also a biomarker of cirrhosis, it has been shown to have a similar performance to liver stiffness for the detection of CSPH [114]. However, such diagnostic performances are only true in portal hypertension secondary to cirrhosis, not in pre- or post-sinusoidal portal hypertension. In contrast, spleen stiffness could prove to be a promising technique for monitoring HPVG [115]. On the other hand, an innovative approach consisted of the development of a computational model for estimating HVPG based on CT angiographic images [116]. Recently, AI-based models, either traditional radiomics or deep learning, have been developed for CT and/or MRI, with very high diagnostic performances [117–120]. More precisely, Liu et al. developed two DL CNN models (CT- and MRI-based) on liver and spleen images that achieved strong diagnostic performances for identifying patients with CSPH with an AUC value of 0.93 (CT) and 0.94 (MRI) on an independent testing dataset. These models outperformed liver stiffness (AUC = 0.73) [118].
Predicting liver failure is also crucial for patient management, either during the natural course of CLD or preoperatively before major hepatectomy. To this date, the decision of portal vein embolization before major hepatectomy still relies on the simple measurement of the liver volume. Accurate prediction of postoperative liver failure is still not implemented in the clinical routine. This could beneficiate from the development of AI-based models. Indeed, several studies reported performant predictive radiomics models for identifying patients at risk of liver failure after major hepatectomy [121–123].
Future perspectives
To date, reproducible quantitative imaging biomarkers are available to assess liver fibrosis, steatosis, and iron overload. If MR imaging with elastography is the most exhaustive modality to assess CLD, as these biomarkers can be evaluated during a single examination, without the need of contrast agents (Fig. 2), liver ultrasound with the concomitant performance of US-guided elastography during the same examination seems the most relevant and time-efficient first-line technique for clinical routine. Artificial intelligence has already proven valuable to create new biomarkers [124] and/or increase the diagnostic performances of the existing ones [66], but has not integrated routine clinical practice yet. As MRI cannot be extensively recommended in routine clinical practice given its cost and limited availability, AI could help maximize diagnostic performances of ultrasound. AI may also help in automatizing time-consuming tasks such as measurement of the liver volume using deep CNN [125, 126], a simple prognostic biomarker of the pejorative outcome of acute liver failure [127]. But to become clinical tools, AI models should be developed following a high-standard process to achieve generalizability and transferability including training on datasets representing the wide spectrum of the disease expression to avoid selection biases, and independent and prospective testing to avoid overfitting [20].
Fig. 2.
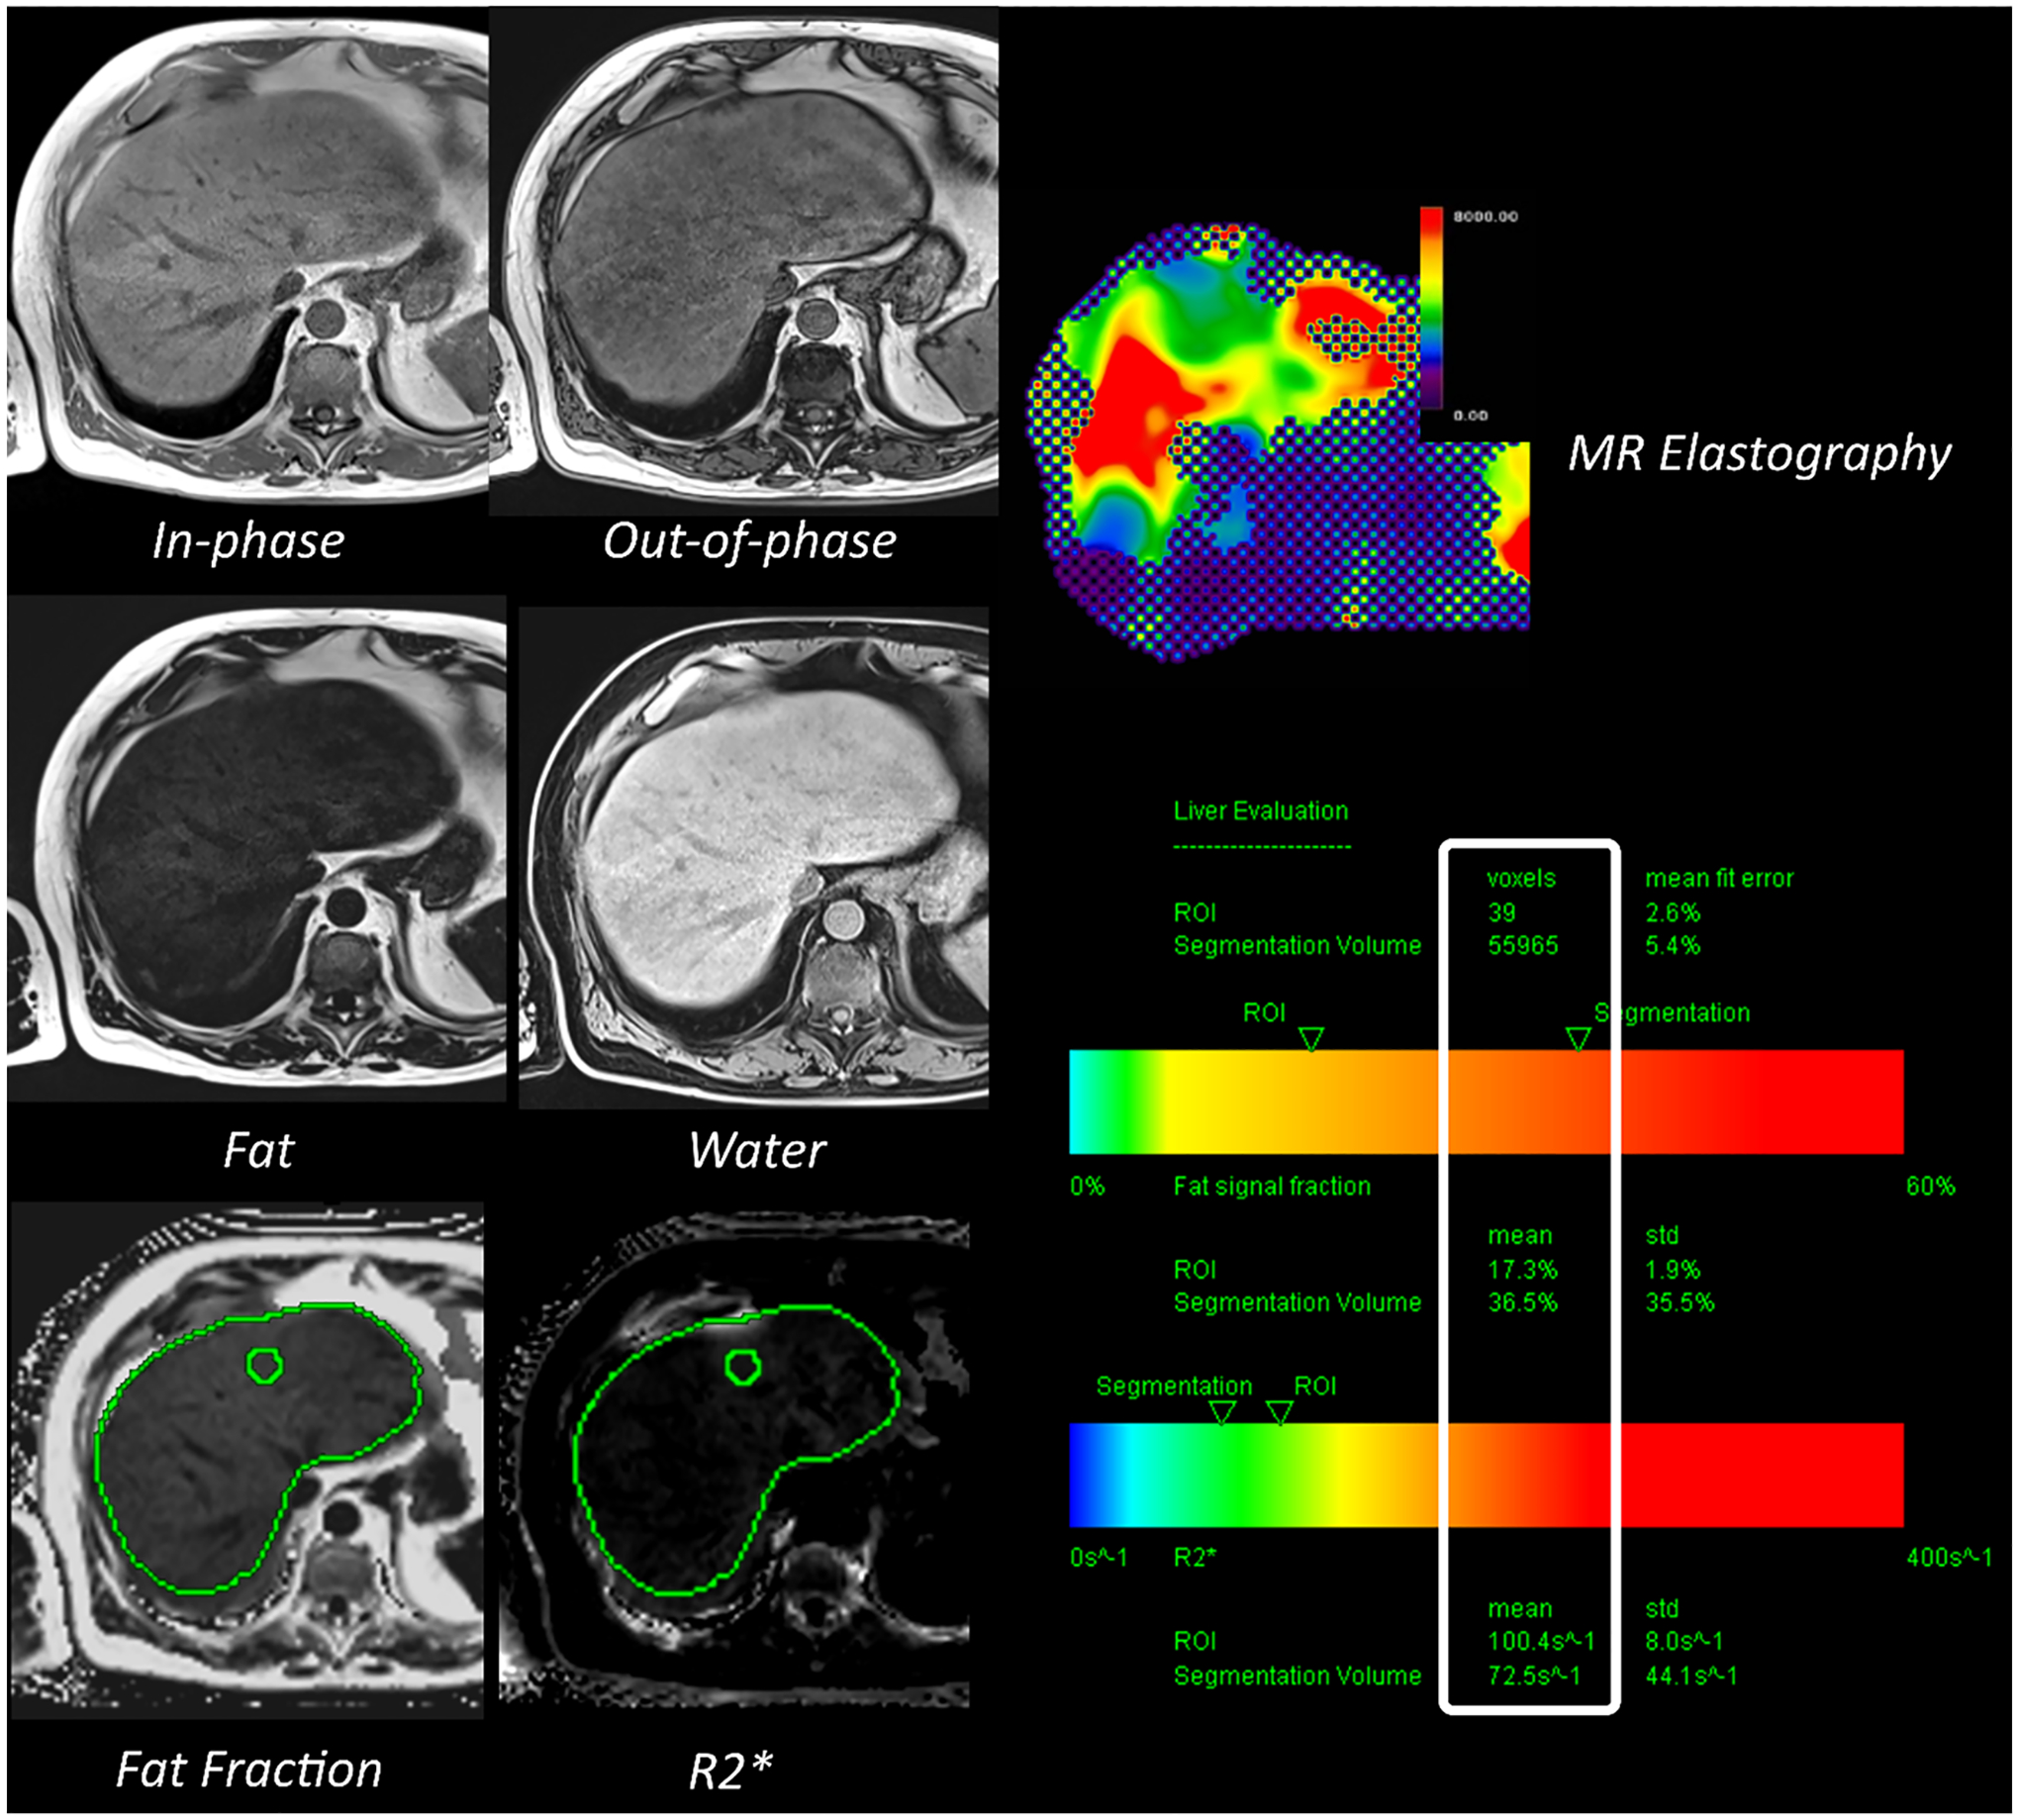
Magnetic resonance imaging-based quantitative biomarkers for steatosis (fat fraction), iron overload (R2*) and fibrosis (MR elastography)
Furthermore, despite the remarkable rise of quantitative imaging biomarkers for the prediction of pathological features, some decisive clinical needs remain unmet. The assessment of the short- and long-term risk of progression of CLD toward a pejorative outcome (e.g., liver failure, portal hypertension decompensation or HCC [96–102]) still requires the development of reliable non-invasive tools. This absence can be explained by the difficulty of implementing studies that would need to be exhaustive and prospective over a long period to collect a large number of pejorative events. If fibrosis and steatosis appear as decisive markers for the characterization of CLD, they fail to accurately predict the progression of early-stage CLD to cirrhosis-related complications. Assessing the disease activity, or inflammation, would better reflect the risk of progressive fibrosis and thus its complications. Refining risk stratification of progressive disease from initial diagnosis would majorly impact therapeutic management. Unfortunately, at the date of this review article, only preliminary research tools exist, without currently clinical transfer and applicability, and none was based on AI techniques. Stratification of the disease progression is crucial for the accurate selection of patients who will most benefit from treatment, therefore avoiding side effects if no benefit is expected, to achieve the best clinical outcome/cost ratio.
Conclusion
As varied as they are, image-based biomarkers can provide a comprehensive representation of the liver parenchyma at the time of initial diagnosis, or at any time during the disease, creating the opportunity to outdate invasive gold standards and impact on clinical management. Artificial intelligence provides opportunities to revolutionize liver imaging, by creating novel reproducible and quantitative imaging biomarkers and augmenting human intelligence to improve decision-making and operational processes. It aims to be part of personalized care, from diagnosis to treatment, as it learns without explicit programming. To achieve this goal, certain limitations need to be overcome. Extensive work is still required to substantiate AI by pathology, molecular and genetic substrate. Precision medicine may ultimately be achieved by integrating clinical, biological (such as single-cell RNA-seq, exome sequencing), serological (such as blood-based biomarkers) and imaging data.
A future challenge for meeting the clinical needs of CLD is the stratification of the risk of disease progression to pejorative outcomes, aiming at identifying patients who will most benefit from treatments. In this regard, it is of paramount importance that AI models will be developed with the concept of a future integration as part of the clinical routine enabling their widespread application.
Funding
This work was supported by French state funds managed within the “Plan Investissements d’Avenir” and by the ANR (ANR-10-IAHU-02 to B.G), by the ARC, Paris and Institut Hospitalo-Universitaire, Strasbourg (TheraHCC1.0 and 2.0 IHUARC IHU201301187 and IHUARC2019 to T.F.B.), the European Union (ERC-AdG-2014-671231-HEPCIR to T.F.B. and Y.H., ERC-AdG-2020-667273-FIBCAN to T.F.B. and Y. H.), ANRS, Paris (ECTZ171594 to J.L., ECTZ131760 to J.L. and P.N., ECTZ160436 and ECTZ103701 to T.F.B), NIH (DK099558 and CA233794 to Y.H., CA209940 and R03AI131066 to T.F.B.), Cancer Prevention and Research Institute of Texas (RR180016 to Y.H), US Department of Defense (W81XWH-16-1-0363 to T.F.B. and Y.H.), the Irma T. Hirschl/Monique Weill-Caulier Trust (Y.H.) and the Foundation of the University of Strasbourg (HEPKIN to T.F.B.) and the Institut Universitaire de France (IUF; T.F.B.). This work has been published under the framework of the LABEX ANR-10-LABX-0028_HEPSYS and Inserm Plan Cancer and benefits from funding from the state managed by the French National Research Agency as part of the Investments for the future program.
Footnotes
Conflict of interest
TFB is founder, shareholder and advisor of Alentis Therapeutics. He is an inventor on patent applications of the University of Strasbourg, Inserm and IHU for liver disease therapeutics and biomarkers. PN has relationships with AstraZeneca, Bayer, Bristol-Myers Squibb, EISAI, Ipsen, Roche. JD, AV, AS, JL, YH, VV, CR and BG declare no conflict of interest with this publication.
References
- 1.WHO | Projections of mortality and causes of death, 2016 to 2060. World Health Organization. World Health Organization; 2016. [Google Scholar]
- 2.D’Amico G, Garcia-Tsao G, Pagliaro L. Natural history and prognostic indicators of survival in cirrhosis: a systematic review of 118 studies. J Hepatol. 2006;44:217–231 [DOI] [PubMed] [Google Scholar]
- 3.Hu K-Q, Tong MJ. The long-term outcomes of patients with compensated hepatitis C virus–related cirrhosis and history of parenteral exposure in the united states. Hepatology. 1999;29:1311–1316 [DOI] [PubMed] [Google Scholar]
- 4.Benvegnù L, Gios M, Boccato S, Alberti A. Natural history of compensated viral cirrhosis: a prospective study on the incidence and hierarchy of major complications. Gut. 2004;53:744–749 [DOI] [PMC free article] [PubMed] [Google Scholar]
- 5.Jepsen P, Ott P, Andersen PK, Sørensen HT, Vilstrup H. Clinical course of alcoholic liver cirrhosis: a Danish population-based cohort study. Hepatology. 2010;51:1675–1682 [DOI] [PubMed] [Google Scholar]
- 6.Regev A, Berho M, Jeffers LJ, Milikowski C, Molina EG, Pyrsopoulos NT, et al. Sampling error and intraobserver variation in liver biopsy in patients with chronic HCV infection. Am J Gastroenterol. 2002;97:2614–2618 [DOI] [PubMed] [Google Scholar]
- 7.Merriman RB, Ferrell LD, Patti MG, Weston SR, Pabst MS, Aouizerat BE, et al. Correlation of paired liver biopsies in morbidly obese patients with suspected nonalcoholic fatty liver disease. Hepatology. 2006;44:874–880 [DOI] [PubMed] [Google Scholar]
- 8.Dana J, Agnus V, Ouhmich F, Gallix B. Multimodality imaging and artificial intelligence for tumor characterization: current status and future perspective. Semin Nucl Med. 2020. http://www.sciencedirect.com/science/article/pii/S000129982030074X. Accessed 2 Aug 2020. [DOI] [PubMed] [Google Scholar]
- 9.Aerts HJWL. The potential of radiomic-based phenotyping in precision medicine: a review. JAMA Oncol. 2016;2:1636–1642 [DOI] [PubMed] [Google Scholar]
- 10.López SA, Manzano ML, Gea F, Gutiérrez ML, Ahumada AM, Devesa MJ, et al. A model based on noninvasive markers predicts very low hepatocellular carcinoma risk after viral response in hepatitis C virus-advanced fibrosis. Hepatology. 2020;72:1924–1934 [DOI] [PubMed] [Google Scholar]
- 11.Rasmussen DN, Thiele M, Johansen S, Kjærgaard M, Lindvig KP, Israelsen M, et al. Prognostic performance of seven biomarkers compared to liver biopsy in early alcohol-related liver disease. J Hepatol. 2021. https://www.sciencedirect.com/science/article/pii/S0168827821004116. Accessed 14 Jul 2021. [DOI] [PMC free article] [PubMed] [Google Scholar]
- 12.Hoshida Y, Villanueva A, Sangiovanni A, Sole M, Hur C, Andersson KL, et al. Prognostic gene expression signature for patients with hepatitis C-related early-stage cirrhosis. Gastroenterology. 2013;144:1024–1030 [DOI] [PMC free article] [PubMed] [Google Scholar]
- 13.Chartrand G, Cheng PM, Vorontsov E, Drozdzal M, Turcotte S, Pal CJ, et al. Deep learning: a primer for radiologists. Radiographics. 2017;37:2113–2131 [DOI] [PubMed] [Google Scholar]
- 14.Savadjiev P, Chong J, Dohan A, Vakalopoulou M, Reinhold C, Paragios N, et al. Demystification of AI-driven medical image interpretation: past, present and future. Eur Radiol. 2019;29:1616–1624 [DOI] [PubMed] [Google Scholar]
- 15.Savadjiev P, Chong J, Dohan A, Agnus V, Forghani R, Reinhold C, et al. Image-based biomarkers for solid tumor quantification. Eur Radiol. 2019;29:5431–5440 [DOI] [PubMed] [Google Scholar]
- 16.Zwanenburg A, Vallières M, Abdalah MA, Aerts HJWL, Andrearczyk V, Apte A, et al. The image biomarker standardization initiative: standardized quantitative radiomics for high-throughput image-based phenotyping. Radiology. 2020;295:328–338 [DOI] [PMC free article] [PubMed] [Google Scholar]
- 17.LeCun Y, Bengio Y, Hinton G. Deep learning. Nature. 2015;521:436–444 [DOI] [PubMed] [Google Scholar]
- 18.Cheng PM, Montagnon E, Yamashita R, Pan I, Cadrin-Chênevert A, Perdigón Romero F, et al. Deep learning: an update for radiologists. Radiographics. 2021;41:1427–1445 [DOI] [PubMed] [Google Scholar]
- 19.Lambin P, Leijenaar RTH, Deist TM, Peerlings J, de Jong EEC, van Timmeren J, et al. Radiomics: the bridge between medical imaging and personalized medicine. Nat Rev Clin Oncol. 2017;14:749–762 [DOI] [PubMed] [Google Scholar]
- 20.Lecointre L, Dana J, Lodi M, Akladios C, Gallix B. Artificial intelligence-based radiomics models in endometrial cancer: a systematic review. Eur J Surg Oncol. 2021;47:2734–2741 [DOI] [PubMed] [Google Scholar]
- 21.Mongan J, Moy L, Kahn CE. Checklist for artificial intelligence in medical imaging (CLAIM): a guide for authors and reviewers. Radiol Artif Intell. 2020;2:e200029. [DOI] [PMC free article] [PubMed] [Google Scholar]
- 22.Hinton G. Deep learning-a technology with the potential to transform health care. JAMA. 2018;320:1101–1102 [DOI] [PubMed] [Google Scholar]
- 23.World Health Organization. Ethics and governance of artificial intelligence for health: WHO guidance. 2021.
- 24.Hernandez-Gea V, Friedman SL. Pathogenesis of liver fibrosis. Annu Rev Pathol. 2011;6:425–456 [DOI] [PubMed] [Google Scholar]
- 25.Vilgrain V, Lagadec M, Ronot M. Pitfalls in liver imaging. Radiology. 2015;278:34–51 [DOI] [PubMed] [Google Scholar]
- 26.Smith AD, Branch CR, Zand K, Subramony C, Zhang H, Thaggard K, et al. Liver surface nodularity quantification from routine CT images as a biomarker for detection and evaluation of cirrhosis. Radiology. 2016;280:771–781 [DOI] [PubMed] [Google Scholar]
- 27.Sartoris R, Rautou P-E, Elkrief L, Pollorsi G, Durand F, Valla D, et al. Quantification of liver surface nodularity at CT: utility for detection of portal hypertension. Radiology. 2018;289:698–707 [DOI] [PubMed] [Google Scholar]
- 28.Hobeika C, Cauchy F, Sartoris R, Beaufrère A, Yoh T, Vilgrain V, et al. Relevance of liver surface nodularity for preoperative risk assessment in patients with resectable hepatocellular carcinoma. Br J Surg. 2020;107:878–888 [DOI] [PubMed] [Google Scholar]
- 29.Bastati N, Feier D, Wibmer A, Traussnigg S, Balassy C, Tamandl D, et al. Noninvasive differentiation of simple steatosis and steatohepatitis by using gadoxetic acid-enhanced MR imaging in patients with nonalcoholic fatty liver disease: a proof-of-concept study. Radiology. 2014;271:739–747 [DOI] [PubMed] [Google Scholar]
- 30.Xiao G, Zhu S, Xiao X, Yan L, Yang J, Wu G. Comparison of laboratory tests, ultrasound, or magnetic resonance elastography to detect fibrosis in patients with nonalcoholic fatty liver disease: a meta-analysis. Hepatology. 2017;66:1486–1501 [DOI] [PubMed] [Google Scholar]
- 31.Calvopina DA, Noble C, Weis A, Hartel GF, Ramm LE, Balouch F, et al. Supersonic shear-wave elastography and APRI for the detection and staging of liver disease in pediatric cystic fibrosis. J Cyst Fibros. 2019;19:449–454 [DOI] [PubMed] [Google Scholar]
- 32.Lewindon PJ, Puertolas-Lopez MV, Ramm LE, Noble C, Pereira TN, Wixey JA, et al. Accuracy of transient elastography data combined with APRI in detection and staging of liver disease in pediatric patients with cystic fibrosis. Clin Gastroenterol Hepatol. 2019;17:2561–2569.e5 [DOI] [PubMed] [Google Scholar]
- 33.Berzigotti A, Tsochatzis E, Boursier J, Castera L, Cazzagon N, Friedrich-Rust M, et al. EASL clinical practice guidelines on non-invasive tests for evaluation of liver disease severity and prognosis – 2021 update. J Hepatol. 2021. https://www.sciencedirect.com/science/article/pii/S0168827821003986. Accessed 22 Jun 2021. [Google Scholar]
- 34.Tang A, Cloutier G, Szeverenyi NM, Sirlin CB. Ultrasound elastography and MR elastography for assessing liver fibrosis: part 1, principles and techniques. Am J Roentgenol. 2015;205:22–32 [DOI] [PMC free article] [PubMed] [Google Scholar]
- 35.Tang A, Cloutier G, Szeverenyi NM, Sirlin CB. Ultrasound elastography and MR elastography for assessing liver fibrosis: part 2, diagnostic performance, confounders, and future directions. Am J Roentgenol. 2015;205:33–40 [DOI] [PMC free article] [PubMed] [Google Scholar]
- 36.Foucher J, Chanteloup E, Vergniol J, Castéra L, Le Bail B, Adhoute X, et al. Diagnosis of cirrhosis by transient elastography (FibroScan): a prospective study. Gut. 2006;55:403–408 [DOI] [PMC free article] [PubMed] [Google Scholar]
- 37.Poynard T, Vergniol J, Ngo Y, Foucher J, Munteanu M, Merrouche W, et al. Staging chronic hepatitis C in seven categories using fibrosis biomarker (FibroTest™) and transient elastography (FibroScan®). J Hepatol. 2014;60:706–714 [DOI] [PubMed] [Google Scholar]
- 38.Rajakannu M, Coilly A, Adam R, Samuel D, Vibert E. Prospective validation of transient elastography for staging liver fibrosis in patients undergoing hepatectomy and liver transplantation. J Hepatol. 2018;68:199–200 [DOI] [PubMed] [Google Scholar]
- 39.Castéra L, Vergniol J, Foucher J, Le Bail B, Chanteloup E, Haaser M, et al. Prospective comparison of transient elastography, Fibrotest, APRI, and liver biopsy for the assessment of fibrosis in chronic hepatitis C. Gastroenterology. 2005;128:343–350 [DOI] [PubMed] [Google Scholar]
- 40.Ziol M, Handra-Luca A, Kettaneh A, Christidis C, Mal F, Kazemi F, et al. Noninvasive assessment of liver fibrosis by measurement of stiffness in patients with chronic hepatitis C. Hepatology. 2005;41:48–54 [DOI] [PubMed] [Google Scholar]
- 41.Ganne-Carrié N, Ziol M, de Ledinghen V, Douvin C, Marcellin P, Castera L, et al. Accuracy of liver stiffness measurement for the diagnosis of cirrhosis in patients with chronic liver diseases. Hepatology. 2006;44:1511–1517 [DOI] [PubMed] [Google Scholar]
- 42.de Lédinghen V, Douvin C, Kettaneh A, Ziol M, Roulot D, Marcellin P, et al. Diagnosis of hepatic fibrosis and cirrhosis by transient elastography in HIV/hepatitis C virus-coinfected patients. J Acquir Immune Defic Syndr. 2006;41:175–179 [DOI] [PubMed] [Google Scholar]
- 43.Castera L, Forns X, Alberti A. Non-invasive evaluation of liver fibrosis using transient elastography. J Hepatol. 2008;48:835–847 [DOI] [PubMed] [Google Scholar]
- 44.Cassinotto C, Boursier J, Paisant A, Guiu B, Irles‐Depe M, Canivet C, et al. Transient versus 2-dimensional shear-wave elastography in a multistep strategy to detect advanced fibrosis in NAFLD. Hepatology. http://aasldpubs.onlinelibrary.wiley.com/doi/abs/10.1002/hep.31655. Accessed 14 May 2021. [DOI] [PubMed] [Google Scholar]
- 45.Gao Y, Zheng J, Liang P, Tong M, Wang J, Wu C, et al. Liver fibrosis with two-dimensional US shear-wave elastography in participants with chronic hepatitis B: a prospective multicenter study. Radiology. 2018;289:407–415 [DOI] [PubMed] [Google Scholar]
- 46.Yoneda M, Thomas E, Sclair SN, Grant TT, Schiff ER. Supersonic shear imaging and transient elastography with the XL probe accurately detect fibrosis in overweight or obese patients with chronic liver disease. Clin Gastroenterol Hepatol. 2015;13:1502–1509.e5 [DOI] [PubMed] [Google Scholar]
- 47.Leung VY, Shen J, Wong VW, Abrigo J, Wong GL, Chim AM, et al. Quantitative elastography of liver fibrosis and spleen stiffness in chronic hepatitis B carriers: comparison of shear-wave elastography and transient elastography with liver biopsy correlation. Radiology. 2013;269:910–918 [DOI] [PubMed] [Google Scholar]
- 48.Friedrich-Rust M, Lupsor M, de Knegt R, Dries V, Buggisch P, Gebel M, et al. Point shear wave elastography by acoustic radiation force impulse quantification in comparison to transient elastography for the noninvasive assessment of liver fibrosis in chronic hepatitis C: a prospective international multicenter study. Ultraschall Med. 2015;36:239–247 [DOI] [PubMed] [Google Scholar]
- 49.Ferraioli G, Tinelli C, Bello BD, Zicchetti M, Filice G, Filice C. Accuracy of real-time shear wave elastography for assessing liver fibrosis in chronic hepatitis C: a pilot study. Hepatology. 2012;56:2125–2133 [DOI] [PubMed] [Google Scholar]
- 50.Zhuang Y, Ding H, Zhang Y, Sun H, Xu C, Wang W. Two-dimensional shear-wave elastography performance in the noninvasive evaluation of liver fibrosis in patients with chronic hepatitis B: comparison with serum fibrosis indexes. Radiology. 2016;283:873–882 [DOI] [PubMed] [Google Scholar]
- 51.Zheng J, Guo H, Zeng J, Huang Z, Zheng B, Ren J, et al. Two-dimensional shear-wave elastography and conventional US: the optimal evaluation of liver fibrosis and cirrhosis. Radiology. 2015;275:290–300 [DOI] [PubMed] [Google Scholar]
- 52.Ferraioli G, Tinelli C, Zicchetti M, Above E, Poma G, Di Gregorio M, et al. Reproducibility of real-time shear wave elastography in the evaluation of liver elasticity. Eur J Radiol. 2012;81:3102–3106 [DOI] [PubMed] [Google Scholar]
- 53.Lefebvre T, Wartelle-Bladou C, Wong P, Sebastiani G, Giard J-M, Castel H, et al. Prospective comparison of transient, point shear wave, and magnetic resonance elastography for staging liver fibrosis. Eur Radiol. 2019;29:6477–6488 [DOI] [PubMed] [Google Scholar]
- 54.Asbach P, Klatt D, Hamhaber U, Braun J, Somasundaram R, Hamm B, et al. Assessment of liver viscoelasticity using multifrequency MR elastography. Magn Reson Med. 2008;60:373–379 [DOI] [PubMed] [Google Scholar]
- 55.Dyvorne HA, Jajamovich GH, Bane O, Fiel MI, Chou H, Schiano TD, et al. Prospective comparison of magnetic resonance imaging to transient elastography and serum markers for liver fibrosis detection. Liver Int. 2016;36:659–666 [DOI] [PMC free article] [PubMed] [Google Scholar]
- 56.Chen J, Yin M, Talwalkar JA, Oudry J, Glaser KJ, Smyrk TC, et al. Diagnostic performance of MR elastography and vibration-controlled transient elastography in the detection of hepatic fibrosis in patients with severe to morbid obesity. Radiology. 2016;283:418–428 [DOI] [PMC free article] [PubMed] [Google Scholar]
- 57.Imajo K, Kessoku T, Honda Y, Tomeno W, Ogawa Y, Mawatari H, et al. Magnetic resonance imaging more accurately classifies steatosis and fibrosis in patients with nonalcoholic fatty liver disease than transient elastography. Gastroenterology. 2016;150:626–637.e7 [DOI] [PubMed] [Google Scholar]
- 58.Loomba R, Wolfson T, Ang B, Hooker J, Behling C, Peterson M, et al. Magnetic resonance elastography predicts advanced fibrosis in patients with nonalcoholic fatty liver disease: a prospective study. Hepatology. 2014;60:1920–1928 [DOI] [PMC free article] [PubMed] [Google Scholar]
- 59.Shi Y, Guo Q, Xia F, Dzyubak B, Glaser KJ, Li Q, et al. MR elastography for the assessment of hepatic fibrosis in patients with chronic hepatitis B infection: does histologic necroinflammation influence the measurement of hepatic stiffness? Radiology. 2014;273:88–98 [DOI] [PMC free article] [PubMed] [Google Scholar]
- 60.Chang W, Lee JM, Yoon JH, Han JK, Choi BI, Yoon JH, et al. Liver fibrosis staging with MR elastography: comparison of diagnostic performance between patients with chronic hepatitis B and those with other etiologic causes. Radiology. 2016;280:88–97 [DOI] [PubMed] [Google Scholar]
- 61.Cui J, Heba E, Hernandez C, Haufe W, Hooker J, Andre MP, et al. Magnetic resonance elastography is superior to acoustic radiation force impulse for the diagnosis of fibrosis in patients with biopsy-proven nonalcoholic fatty liver disease: a prospective study. Hepatology. 2016;63:453–461 [DOI] [PMC free article] [PubMed] [Google Scholar]
- 62.Yin M, Talwalkar JA, Glaser KJ, Manduca A, Grimm RC, Ross-man PJ, et al. Assessment of hepatic fibrosis with magnetic resonance elastography. Clin Gastroenterol Hepatol. 2007;5:1207–1213.e2 [DOI] [PMC free article] [PubMed] [Google Scholar]
- 63.Huwart L, Sempoux C, Vicaut E, Salameh N, Annet L, Danse E, et al. Magnetic resonance elastography for the noninvasive staging of liver fibrosis. Gastroenterology. 2008;135:32–40 [DOI] [PubMed] [Google Scholar]
- 64.Venkatesh SK, Yin M, Ehman RL. Magnetic resonance elastography of liver: technique, analysis, and clinical applications. J Magn Reson Imaging. 2013;37:544–555 [DOI] [PMC free article] [PubMed] [Google Scholar]
- 65.Lee JH, Joo I, Kang TW, Paik YH, Sinn DH, Ha SY, et al. Deep learning with ultrasonography: automated classification of liver fibrosis using a deep convolutional neural network. Eur Radiol. 2020;30:1264–1273 [DOI] [PubMed] [Google Scholar]
- 66.Wang K, Lu X, Zhou H, Gao Y, Zheng J, Tong M, et al. Deep learning Radiomics of shear wave elastography significantly improved diagnostic performance for assessing liver fibrosis in chronic hepatitis B: a prospective multicentre study. Gut. 2019;68:729–741 [DOI] [PMC free article] [PubMed] [Google Scholar]
- 67.Xue L-Y, Jiang Z-Y, Fu T-T, Wang Q-M, Zhu Y-L, Dai M, et al. Transfer learning radiomics based on multimodal ultrasound imaging for staging liver fibrosis. Eur Radiol. 2020;30:2973–2983 [DOI] [PMC free article] [PubMed] [Google Scholar]
- 68.He L, Li H, Dudley JA, Maloney TC, Brady SL, Somasundaram E, et al. Machine learning prediction of liver stiffness using clinical and T2-weighted MRI radiomic data. AJR Am J Roentgenol. 2019;213:592–601 [DOI] [PubMed] [Google Scholar]
- 69.Hectors SJ, Kennedy P, Huang K-H, Stocker D, Carbonell G, Greenspan H, et al. Fully automated prediction of liver fibrosis using deep learning analysis of gadoxetic acid-enhanced MRI. Eur Radiol. 2020;31:3805–3814 [DOI] [PubMed] [Google Scholar]
- 70.Yasaka K, Akai H, Kunimatsu A, Abe O, Kiryu S. Liver fibrosis: deep convolutional neural network for staging by using gadoxetic acid-enhanced hepatobiliary phase MR images. Radiology. 2018;287:146–155 [DOI] [PubMed] [Google Scholar]
- 71.Choi KJ, Jang JK, Lee SS, Sung YS, Shim WH, Kim HS, et al. Development and validation of a deep learning system for staging liver fibrosis by using contrast agent-enhanced CT images in the liver. Radiology. 2018;289:688–697 [DOI] [PubMed] [Google Scholar]
- 72.Younossi ZM. Non-alcoholic fatty liver disease – a global public health perspective. J Hepatol. 2019;70:531–544 [DOI] [PubMed] [Google Scholar]
- 73.Nguyen VH, Le MH, Cheung RC, Nguyen MH. Differential clinical characteristics and mortality outcomes in persons with NAFLD and/or MAFLD. Clin Gastroenterol Hepatol. 2021. https://www.sciencedirect.com/science/article/pii/S154235652100567X. Accessed 25 Aug 2021. [DOI] [PubMed] [Google Scholar]
- 74.Natarajan Y, Kramer JR, Yu X, Li L, Thrift AP, El-Serag HB, et al. Risk of cirrhosis and hepatocellular cancer in patients with NAFLD and normal liver enzymes. Hepatology. 2020;72:1242–1252 [DOI] [PMC free article] [PubMed] [Google Scholar]
- 75.Mendes FD, Suzuki A, Sanderson SO, Lindor KD, Angulo P. Prevalence and indicators of portal hypertension in patients with nonalcoholic fatty liver disease. Clin Gastroenterol Hepatol. 2012;10:1028–1033.e2 [DOI] [PMC free article] [PubMed] [Google Scholar]
- 76.Zhang B, Ding F, Chen T, Xia L-H, Qian J, Lv G-Y. Ultrasound hepatic/renal ratio and hepatic attenuation rate for quantifying liver fat content. World J Gastroenterol. 2014;20:17985–17992 [DOI] [PMC free article] [PubMed] [Google Scholar]
- 77.Dioguardi Burgio M, Ronot M, Reizine E, Rautou P-E, Castera L, Paradis V, et al. Quantification of hepatic steatosis with ultrasound: promising role of attenuation imaging coefficient in a biopsy-proven cohort. Eur Radiol. 2020;30:2293–2301 [DOI] [PubMed] [Google Scholar]
- 78.Imbault M, Burgio MD, Faccinetto A, Ronot M, Bendjador H, Deffieux T, et al. Ultrasonic fat fraction quantification using in vivo adaptive sound speed estimation. Phys Med Biol. 2018;63:215013. [DOI] [PubMed] [Google Scholar]
- 79.Runge JH, Smits LP, Verheij J, Depla A, Kuiken SD, Baak BC, et al. MR spectroscopy–derived proton density fat fraction is superior to controlled attenuation parameter for detecting and grading hepatic steatosis. Radiology. 2017;286:547–556 [DOI] [PubMed] [Google Scholar]
- 80.Guo Z, Blake GM, Li K, Liang W, Zhang W, Zhang Y, et al. Liver fat content measurement with quantitative CT validated against MRI proton density fat fraction: a prospective study of 400 healthy volunteers. Radiology. 2020;294:89–97 [DOI] [PubMed] [Google Scholar]
- 81.Moret A, Boursier J, Debry PH, Riou J, Crouan A, Dubois M, et al. Evaluation of the hepatorenal B-mode ratio and the “controlled attenuation parameter” for the detection and grading of steatosis. Ultraschall Med. 2020. http://www.thieme.connect.de/DOI/DOI?10.1055/a-1233-2290. Accessed 15 May 2021. [DOI] [PubMed] [Google Scholar]
- 82.Tang A, Tan J, Sun M, Hamilton G, Bydder M, Wolfson T, et al. Nonalcoholic fatty liver disease: MR imaging of liver proton density fat fraction to assess hepatic steatosis. Radiology. 2013;267:422–431 [DOI] [PMC free article] [PubMed] [Google Scholar]
- 83.Han A, Byra M, Heba E, Andre MP, Erdman JW, Loomba R, et al. Noninvasive diagnosis of nonalcoholic fatty liver disease and quantification of liver fat with radiofrequency ultrasound data using one-dimensional convolutional neural networks. Radiology. 2020;295:342–350 [DOI] [PMC free article] [PubMed] [Google Scholar]
- 84.d’Assignies G, Paisant A, Bardou-Jacquet E, Boulic A, Bannier E, Lainé F, et al. Non-invasive measurement of liver iron concentration using 3-Tesla magnetic resonance imaging: validation against biopsy. Eur Radiol. 2018;28:2022–2030 [DOI] [PubMed] [Google Scholar]
- 85.Henninger B, Alustiza J, Garbowski M, Gandon Y. Practical guide to quantification of hepatic iron with MRI. Eur Radiol. 2020;30:383–393 [DOI] [PMC free article] [PubMed] [Google Scholar]
- 86.Czaja AJ. Iron disturbances in chronic liver diseases other than haemochromatosis – pathogenic, prognostic, and therapeutic implications. Aliment Pharmacol Ther. 2019;49:681–701 [DOI] [PubMed] [Google Scholar]
- 87.Pietrangelo A. Hereditary hemochromatosis: pathogenesis, diagnosis, and treatment. Gastroenterology. 2010;139:393–408.e2 [DOI] [PubMed] [Google Scholar]
- 88.Sugimoto K, Moriyasu F, Oshiro H, Takeuchi H, Abe M, Yoshimasu Y, et al. The role of multiparametric US of the liver for the evaluation of nonalcoholic steatohepatitis. Radiology. 2020;296:532–540 [DOI] [PubMed] [Google Scholar]
- 89.Sugimoto K, Moriyasu F, Oshiro H, Takeuchi H, Yoshimasu Y, Kasai Y, et al. Viscoelasticity measurement in rat livers using shear-wave US elastography. Ultrasound Med Biol. 2018;44:2018–2024 [DOI] [PubMed] [Google Scholar]
- 90.Deffieux T, Gennisson J-L, Bousquet L, Corouge M, Cosconea S, Amroun D, et al. Investigating liver stiffness and viscosity for fibrosis, steatosis and activity staging using shear wave elastography. J Hepatol. 2015;62:317–324 [DOI] [PubMed] [Google Scholar]
- 91.Chen S, Sanchez W, Callstrom MR, Gorman B, Lewis JT, Sanderson SO, et al. Assessment of liver viscoelasticity by using shear waves induced by ultrasound radiation force. Radiology. 2013;266:964–970 [DOI] [PMC free article] [PubMed] [Google Scholar]
- 92.Allen AM, Shah VH, Therneau TM, Venkatesh SK, Mounajjed T, Larson JJ, et al. The role of three-dimensional magnetic resonance elastography in the diagnosis of nonalcoholic steatohepatitis in obese patients undergoing bariatric surgery. Hepatology. 2020;71:510–521 [DOI] [PMC free article] [PubMed] [Google Scholar]
- 93.Kim JW, Lee Y-S, Park YS, Kim B-H, Lee SY, Yeon JE, et al. Multiparametric MR index for the diagnosis of non-alcoholic steatohepatitis in patients with non-alcoholic fatty liver disease. Sci Rep. 2020;10:2671. [DOI] [PMC free article] [PubMed] [Google Scholar]
- 94.Ding Y, Rao S-X, Meng T, Chen C, Li R, Zeng M-S. Usefulness of T1 mapping on Gd-EOB-DTPA-enhanced MR imaging in assessment of non-alcoholic fatty liver disease. Eur Radiol. 2014;24:959–966 [DOI] [PubMed] [Google Scholar]
- 95.Sevastianova K, Hakkarainen A, Kotronen A, Cornér A, Arkkila P, Arola J, et al. Nonalcoholic fatty liver disease: detection of elevated nicotinamide adenine dinucleotide phosphate with in vivo 3.0-T 31P MR spectroscopy with proton decoupling. Radiology. 2010;256:466–473 [DOI] [PubMed] [Google Scholar]
- 96.Ioannou GN. HCC surveillance after SVR in patients with F3/F4 fibrosis. J Hepatol. 2021;74:458–465 [DOI] [PubMed] [Google Scholar]
- 97.Ioannou GN, Green P, Kerr KF, Berry K. Models estimating risk of hepatocellular carcinoma in patients with alcohol or NAFLD-related cirrhosis for risk stratification. J Hepatol. 2019;71:523–533 [DOI] [PMC free article] [PubMed] [Google Scholar]
- 98.Ioannou GN, Tang W, Beste LA, Tincopa MA, Su GL, Van T, et al. Assessment of a deep learning model to predict hepatocellular carcinoma in patients with hepatitis C cirrhosis. JAMA Netw Open. 2020;3:e2015626–e2015626 [DOI] [PMC free article] [PubMed] [Google Scholar]
- 99.Sharma SA, Kowgier M, Hansen BE, Brouwer WP, Maan R, Wong D, et al. Toronto HCC risk index: a validated scoring system to predict 10-year risk of HCC in patients with cirrhosis. J Hepatol. 2018;68:92–99 [DOI] [PubMed] [Google Scholar]
- 100.Papatheodoridis G, Dalekos G, Sypsa V, Yurdaydin C, Buti M, Goulis J, et al. PAGE-B predicts the risk of developing hepatocellular carcinoma in Caucasians with chronic hepatitis B on 5-year antiviral therapy. J Hepatol. 2016;64:800–806 [DOI] [PubMed] [Google Scholar]
- 101.Fan R, Papatheodoridis G, Sun J, Innes H, Toyoda H, Xie Q, et al. aMAP risk score predicts hepatocellular carcinoma development in patients with chronic hepatitis. J Hepatol. 2020;73:1368–1378 [DOI] [PubMed] [Google Scholar]
- 102.Audureau E, Carrat F, Layese R, Cagnot C, Asselah T, Guyader D, et al. Personalized surveillance for hepatocellular carcinoma in cirrhosis – using machine learning adapted to HCV status. J Hepatology. 2020. https://www.journal-of-hepatology.eu/article/S0168-8278(20)30394-9/abstract. Accessed 30 Jun 2020. [DOI] [PubMed] [Google Scholar]
- 103.Kitamura S, Iishi H, Tatsuta M, Ishikawa H, Hiyama T, Tsukuma H, et al. Liver with hypoechoic nodular pattern as a risk factor for hepatocellular carcinoma. Gastroenterology. 1995;108:1778–1784 [DOI] [PubMed] [Google Scholar]
- 104.Tarao K, Hoshino H, Shimizu A, Ohkawa S, Harada M, Nakamura Y, et al. Patients with ultrasonic coarse-nodular cirrhosis who are anti-hepatitis C virus-positive are at high risk for hepatocellular carcinoma. Cancer. 1995;75:1255–1262 [DOI] [PubMed] [Google Scholar]
- 105.Caturelli E, Castellano L, Fusilli S, Palmentieri B, Niro GA, del Vecchio-Blanco C, et al. Coarse nodular US pattern in hepatic cirrhosis: risk for hepatocellular carcinoma. Radiology. 2003;226:691–697 [DOI] [PubMed] [Google Scholar]
- 106.Kitson MT, Roberts SK, Colman JC, Paul E, Button P, Kemp W. Liver stiffness and the prediction of clinically significant portal hypertension and portal hypertensive complications. Scand J Gastroenterol. 2015;50:462–469 [DOI] [PubMed] [Google Scholar]
- 107.Elkrief L, Rautou P-E, Ronot M, Lambert S, Dioguardi Burgio M, Francoz C, et al. Prospective comparison of spleen and liver stiffness by using shear-wave and transient elastography for detection of portal hypertension in cirrhosis. Radiology. 2015;275:589–598 [DOI] [PubMed] [Google Scholar]
- 108.Elkrief L, Ronot M, Andrade F, Dioguardi Burgio M, Issoufaly T, Zappa M, et al. Non-invasive evaluation of portal hypertension using shear-wave elastography: analysis of two algorithms combining liver and spleen stiffness in 191 patients with cirrhosis. Aliment Pharmacol Ther. 2018;47:621–630 [DOI] [PubMed] [Google Scholar]
- 109.Ronot M, Lambert S, Elkrief L, Doblas S, Rautou P-E, Castera L, et al. Assessment of portal hypertension and high-risk oesophageal varices with liver and spleen three-dimensional multifrequency MR elastography in liver cirrhosis. Eur Radiol. 2014;24:1394–1402 [DOI] [PubMed] [Google Scholar]
- 110.Choi S-Y, Jeong WK, Kim Y, Kim J, Kim TY, Sohn JH. Shear-wave elastography: a noninvasive tool for monitoring changing hepatic venous pressure gradients in patients with cirrhosis. Radiology. 2014;273:917–926 [DOI] [PubMed] [Google Scholar]
- 111.Grgurević I, Bokun T, Mustapić S, Trkulja V, Heinzl R, Banić M, et al. Real-time two-dimensional shear wave ultrasound elastography of the liver is a reliable predictor of clinical outcomes and the presence of esophageal varices in patients with compensated liver cirrhosis. Croat Med J. 2015;56:470–481 [DOI] [PMC free article] [PubMed] [Google Scholar]
- 112.Merchante N, Rivero-Juárez A, Téllez F, Merino D, Ríos-Villegas MJ, Ojeda-Burgos G, et al. Liver stiffness predicts variceal bleeding in HIV/HCV-coinfected patients with compensated cirrhosis. AIDS. 2017;31:493–500 [DOI] [PubMed] [Google Scholar]
- 113.Robic MA, Procopet B, Métivier S, Péron JM, Selves J, Vinel JP, et al. Liver stiffness accurately predicts portal hypertension related complications in patients with chronic liver disease: a prospective study. J Hepatol. 2011;55:1017–1024 [DOI] [PubMed] [Google Scholar]
- 114.Souhami A, Sartoris R, Rautou P-E, Cauchy F, Bouattour M, Durand F, et al. Similar performance of liver stiffness measurement and liver surface nodularity for the detection of portal hypertension in patients with hepatocellular carcinoma. JHEP Rep. 2020;2:100147. [DOI] [PMC free article] [PubMed] [Google Scholar]
- 115.Takuma Y, Nouso K, Morimoto Y, Tomokuni J, Sahara A, Takabatake H, et al. Portal hypertension in patients with liver cirrhosis: diagnostic accuracy of spleen stiffness. Radiology. 2016;279:609–619 [DOI] [PubMed] [Google Scholar]
- 116.Qi X, An W, Liu F, Qi R, Wang L, Liu Y, et al. Virtual hepatic venous pressure gradient with CT angiography (CHESS 1601): a prospective multicenter study for the noninvasive diagnosis of portal hypertension. Radiology. 2019;290:370–377 [DOI] [PubMed] [Google Scholar]
- 117.Lin Y, Li L, Yu D, Liu Z, Zhang S, Wang Q, et al. A novel radiomics-platelet nomogram for the prediction of gastroesophageal varices needing treatment in cirrhotic patients. Hepatol Int. 2021;15:995–1005 [DOI] [PubMed] [Google Scholar]
- 118.Liu Y, Ning Z, Örmeci N, An W, Yu Q, Han K, et al. Deep convolutional neural network-aided detection of portal hypertension in patients with cirrhosis. Clin Gastroenterol Hepatol. 2020;18:2998–3007.e5 [DOI] [PubMed] [Google Scholar]
- 119.Tseng Y, Ma L, Li S, Luo T, Luo J, Zhang W, et al. Application of CT-based radiomics in predicting portal pressure and patient outcome in portal hypertension. Eur J Radiol. 2020;126:108927. [DOI] [PubMed] [Google Scholar]
- 120.Meng D, Wei Y, Feng X, Kang B, Wang X, Qi J, et al. CT-based radiomics score can accurately predict esophageal variceal rebleeding in cirrhotic patients. Front Med. 2021;8:745931. [DOI] [PMC free article] [PubMed] [Google Scholar]
- 121.Zhu W-S, Shi S-Y, Yang Z-H, Song C, Shen J. Radiomics model based on preoperative gadoxetic acid-enhanced MRI for predicting liver failure. World J Gastroenterol. 2020;26:1208–1220 [DOI] [PMC free article] [PubMed] [Google Scholar]
- 122.Chen Y, Liu Z, Mo Y, Li B, Zhou Q, Peng S, et al. Prediction of post-hepatectomy liver failure in patients with hepatocellular carcinoma based on radiomics using Gd-EOB-DTPA-enhanced MRI: the liver failure model. Front Oncol. 2021;11:605296. [DOI] [PMC free article] [PubMed] [Google Scholar]
- 123.Cai W, He B, Hu M, Zhang W, Xiao D, Yu H, et al. A radiomics-based nomogram for the preoperative prediction of posthepatectomy liver failure in patients with hepatocellular carcinoma. Surg Oncol. 2019;28:78–85 [DOI] [PubMed] [Google Scholar]
- 124.Xu X, Zhang H-L, Liu Q-P, Sun S-W, Zhang J, Zhu F-P, et al. Radiomic analysis of contrast-enhanced CT predicts microvascular invasion and outcome in hepatocellular carcinoma. J Hepatol. 2019;70:1133–1144 [DOI] [PubMed] [Google Scholar]
- 125.Chlebus G, Schenk A, Moltz JH, van Ginneken B, Hahn HK, Meine H. Automatic liver tumor segmentation in CT with fully convolutional neural networks and object-based postprocessing. Sci Rep. 2018;8:15497. [DOI] [PMC free article] [PubMed] [Google Scholar]
- 126.Chlebus G, Meine H, Thoduka S, Abolmaali N, van Ginneken B, Hahn HK, et al. Reducing inter-observer variability and interaction time of MR liver volumetry by combining automatic CNN-based liver segmentation and manual corrections. PLoS One. 2019;14:e0217228. [DOI] [PMC free article] [PubMed] [Google Scholar]
- 127.Zabron A, Quaglia A, Fatourou E, Peddu P, Lewis D, Heneghan M, et al. Clinical and prognostic associations of liver volume determined by computed tomography in acute liver failure. Liver Int. 2018;38:1592–1601 [DOI] [PubMed] [Google Scholar]