

Abstract
Introduction:
The clinical examination for laxity has been considered a mainstay in evaluation of the painful knee replacement, especially for the diagnosis of instability. More than 10 mm of anterior-posterior (AP) translation in flexion has been described as important in the diagnosis of flexion instability. The inter-observer reliability of varus/valgus and AP laxity testing has not been tested.
Methods:
10 subjects with prior total knee arthroplasty (TKA) were examined by four fellowship-trained orthopaedic knee replacement surgeons. Each surgeon evaluated each subject in random order and was blinded to the results of the other surgeons. Each surgeon performed an anterior drawer test at 30 and 90 degrees of flexion and graded the instability as 0–5mm, 5–10mm or >10 mm. Varus-valgus testing was also graded. Motion capture was used during the examination to determine joint position and estimate joint reaction force during the examination.
Results:
Inter-rater reliability (IRR) was poor at 30 and 90 degrees for both the subjective rater score and the measured AP laxity in flexion (k=018–0.22). Varus-valgus testing similarly had poor reliability. Force applied by the rater also had poor IRR.
Conclusion:
Clinical testing of knee laxity after TKA has poor reliability between surgeons using motion analysis. It is unclear if this is from differences in examiner technique or from differences in pain or quadriceps function of the subjects. Instability after TKA should not be diagnosed strictly by clinical testing and should involve a complete clinical assessment of the patient.
Keywords: Flexion instability, painful TKA, clinical examination, knee laxity
Introduction
Laxity or looseness of a knee joint can lead to clinical dysfunction after total knee arthroplasty (TKA) termed instability. Flexion instability (FI) exists when the flexion gap is larger than the extension gap, resulting in looseness of the knee with bending. Mid-flexion instability occurs if the knee displays laxity at 30 degrees of flexion. FI may be the underlying cause of 7.5–34% of knee revision cases[1–3] and is diagnosed by a constellation of clinical findings including difficulty in ascending stairs, giving way, recurrent effusions and tenderness around the pes anserine area[4,5]. Clinical examination of the knee using anteroposterior testing and varus-valgus testing in both extension and flexion are thought to be important in the diagnosis of instability patterns after TKA. The anterior drawer test in 90 degrees of flexion is used as an aid in the diagnosis of FI. The examiner grades the translation as either 0–5mm, 5–10mm or >10mm, where>10 mm motion is indicative of marked flexion instability[5]. In the original study by Schwab et al., 8 of 10 patients with flexion instability were noted to have >10 mm translation and two had 5–10 mm translation[4].The diagnosis of mid-flexion instability is less clear, but anteroposterior (AP) instability at 30 degrees of flexion is a hallmark of this diagnosis. Unlike the anterior drawer test for anterior cruciate ligament deficiency in native knees, no quantifiable testing supplement, such as the KT1000 machine, are available to quantify measurements in 90 degrees of flexion.
Patients may tolerate various levels of laxity of their knee arthroplasty and have no clinical symptoms. While significant laxity may be found in some patients who are highly satisfied with the outcome of their TKA, other patients may report clinical symptoms of FI with similar laxity[6]. The difficulty in diagnosis may be one factor contributing to the relatively poor results of revision knee arthroplasty for FI compared to other diagnosis, such as aseptic component loosening or infection[1]. To date, the reliability of clinical laxity testing has not been validated. The intent of our study is to determine the interobserver reliability between surgeons of the AP drawer test at 30 and 90 degrees as well as varus-valgus testing. Secondary goals of our study include evaluation of the reliability of the knee joint angle in which a surgeon performs the test and the variability of the force applied by the raters during the examination.
Methods
We conducted this prospective study after obtaining Institutional Board Review. Written informed consent was obtained from each patient. We recruited ten community-dwelling participants who had a previous TKA at least one year prior and walked without a gait aid. Exclusion criteria included patients with a BMI > 35 kg/m2 or having undergone a revision procedure. Demographics, KOOS Jr score and implant types are listed in Table 1.
Table 1:
Study participant demographics
| Age (years) | Gender | BMI | KOOS Jr | Years from surgery | Bearing type | Knee type | |
|---|---|---|---|---|---|---|---|
| 1 | 63 | F | 28 | 63.8 | 5 | CR | Zimmera |
| 2 | 72 | F | 31.1 | 47.5 | 13 | CR | Biometb |
| 3 | 69 | M | 31.3 | 84.6 | 1 | LP | DJOc |
| 4 | 62 | F | 25 | 100 | 2 | MP | MicroPortd |
| 5 | 65 | F | 26.7 | 44.9 | 13 | CR | Strykere |
| 6 | 72 | F | 23.7 | 84.6 | 2 | MP | MicroPort |
| 7 | 87 | M | 29.6 | 54.8 | 3 | PS | Biomet |
| 8 | 71 | F | 32.7 | 76.3 | 2 | LP | DJO |
| 9 | 56 | F | 34.1 | 61.6 | 2 | LP | DJO |
| 10 | 81 | F | 32.9 | 76.3 | 1 | LP | DJO |
|
| |||||||
| Mean | 69.8 | 29.5 | 70.3 | 4.4 | |||
|
| |||||||
| SD | 9.2 | 3.5 | 18.7 | 4.7 | |||
Abbreviations: BMI body mass index, KOOS JR Knee injury and Osteoarthritis Outcome Score Junior, CR cruciate retaining, LP lateral pivot, MP medial pivot, PS posterior stabilized
Zimmer Biomet (Warsaw, IN) Nexgen Knee Solutions
Zimmer Biomet (Warsaw, IN) Vanguard Knee system
DJO Global Inc (Lewisville TX) EMPOWR 3D knee
MicroPort Orthopaedics Inc (Arlington, TN) Evolution medial pivot knee system
Stryker (Kalamazoo, MI) Triathlon, SD standard deviation
The experimental portion of the study was performed in a single setting on one day at our institution’s motion capture human performance laboratory. Participants were fitted with eight 13 mm reflective markers on the study limb at the following locations: greater trochanter, medial and lateral femoral condyles, fibular head, medial and lateral malleolus, and 5 mm marker clusters on the lateral thigh, and medial and lateral shank (Figure 1). A 10-camera Vicon motion capture system (Vicon, Oxford, UK) tracked the spatial coordinates during the experiment. Marker data were captured at 100 Hz, and noise was reduced with a fourth-order, low-pass Butterworth filter at a cutoff frequency of 6 Hz. Each participant first performed a standing static trial.
Figure 1.
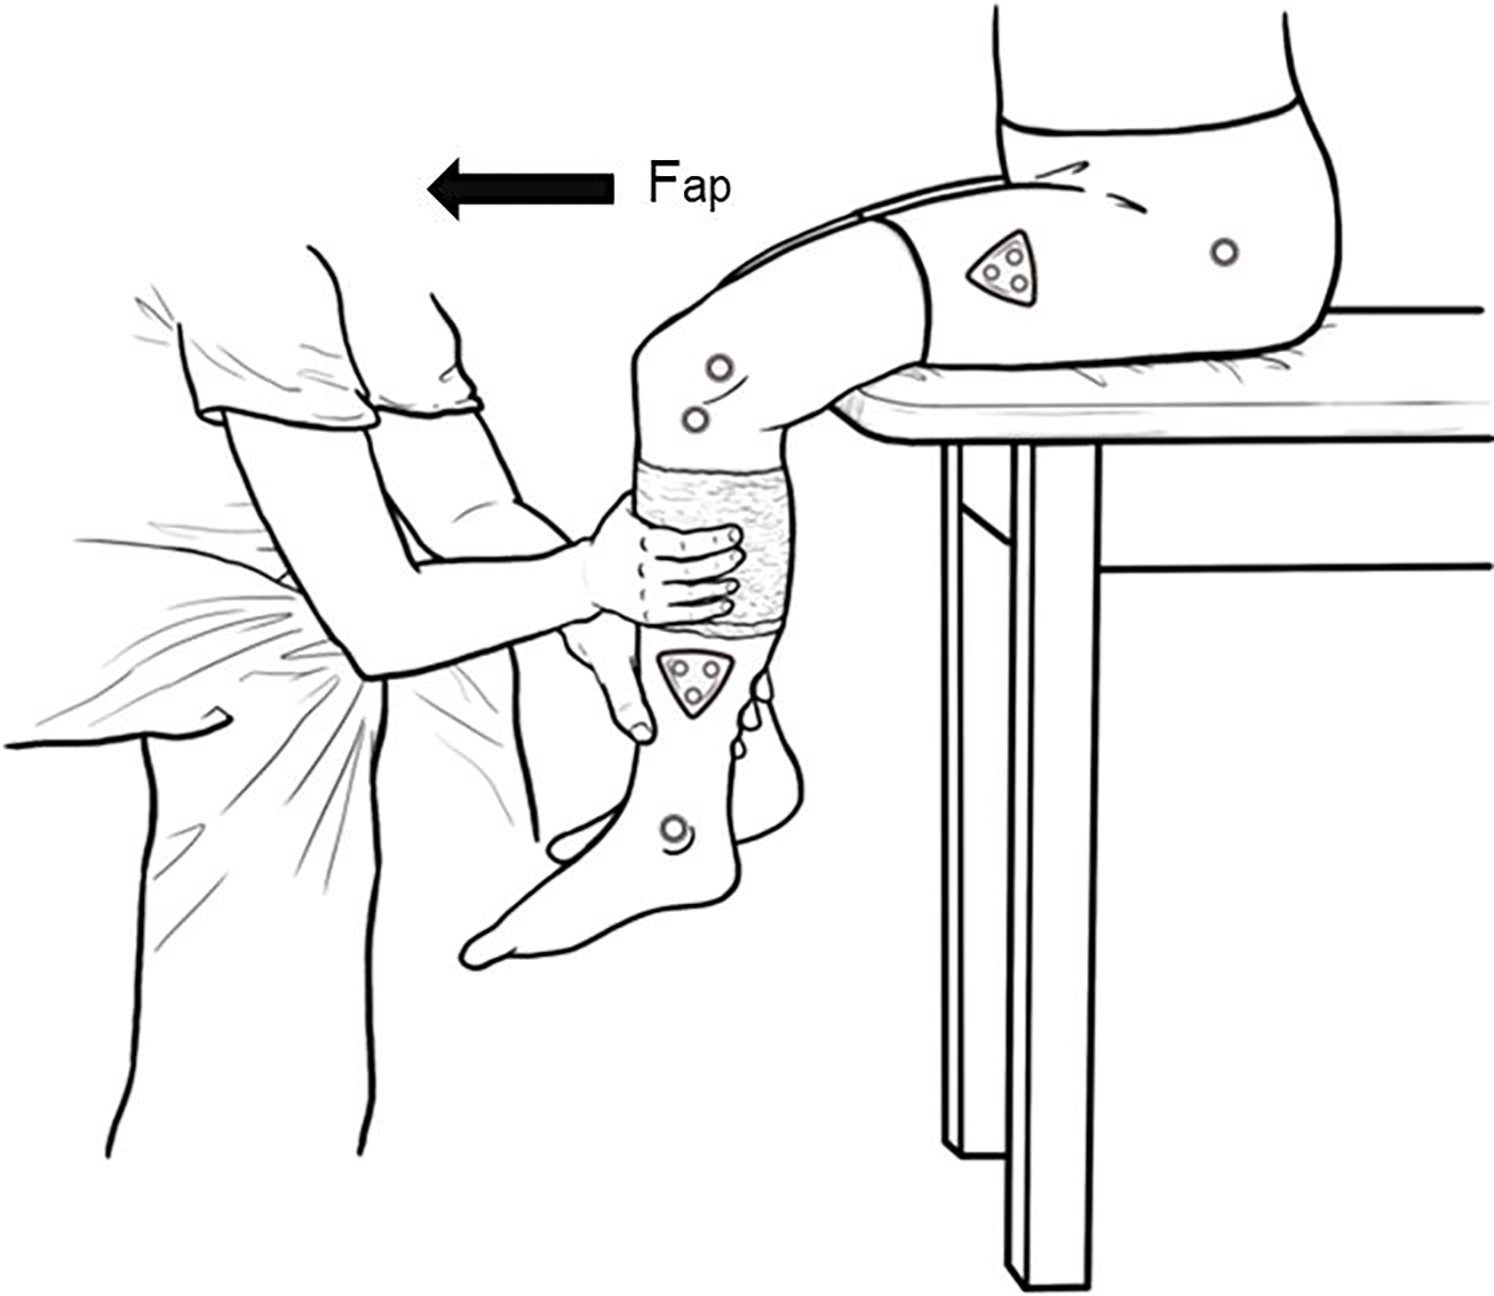
Experimental setup
Each subject was examined by 4 fellowship-trained orthopedic adult reconstruction knee surgeons. The order of examination of each of the raters was randomized and the surgeons did not speak to each other about the results of each examination during the study.
Each participant was first seated on a standard height exam table with both limbs hanging unsupported (Figure 1). Four exams were performed by each surgeon: (1) anterior tibial translation of the knee at 30 degrees and (2) 90 degrees of knee flexion, and varus valgus stability at (3) 10 degrees and (4) 90 degrees of knee flexion. Knee flexion angles for each exam were estimated by the rater during the testing, and later measured using motion capture.
The anterior tibial translation exams were performed by each surgeon according to the methodology of Schwab etal. The rater placed one hand around the calf and produced a cyclical anterior posterior force against the tibia. The exams were performed in open chain format, with the leg hanging from the exam table and not resting against the floor (Figure 1). The examiners all tried to relax the patient to achieve maximal motion. While individual technique varied between raters, at least three cycles of translation or rotation were recorded for each exam. At the end of each exam, the rater gave a subjective score with his estimated amount of AP laxity: “1” was 0 to 5 mm (mild), “2” was 5 to 10 mm (moderate), and “3” was >10 mm (marked). Varus-valgus testing of the knee was then conducted in both slight (10 degrees) of flexion and 90 degrees of flexion. Varus-valgus testing was rated by the observers as stable (1), moderate instability (2) or severe instability (3).
Custom Matlab code (Mathworks, Natick, MA) was written to extract the following parameters from the motion capture data during anterior posterior testing: AP displacement defined as the AP motion between the femoral and tibial segments, knee flexion angle and the sagittal plane thigh angle compared to global coordinate system. Motion in the varus-valgus testing was measured as the total arc of medial-lateral motion in degrees.
Peak AP reaction force in the knee joint was determined during testing according to De Leva’s anthropometric model[7]. The knee joint center was determined by a midpoint between lateral and medial tibial condyles (two lower knee markers) and the ankle joint center was determined by a midpoint between medial and lateral malleoli (two ankle markers). The location of calf center of mass was calculated using the calf length (between knee joint center and ankle joint center) and a percentage of the total mass (43.95% for male/ 43.52% for female from the proximal joint)[7]. The linear acceleration of the calf was calculated at the calf center of mass. Via Newton’s second law (ΣFx = max), we determined the forces acting at the calf segment by using acceleration and mass of each segment (foot and shank; Figure 1). The AP reaction force was calculated using the equation (ΣFap = (mfoot + mcalf) × acalf ap). (mfoot: foot mass (body mass * 0.0137 for male; body mass * 0.0129 for female), mcalf:calf mass (body mass * 0.0433 for male; body mass * 0.0481 for female), anterior-posterior linear acceleration of the calf). All calculations were performed using a custom Matlab code (Mathworks, Natick, MA).
Statistical analyses were conducted in SAS v9.4 (SAS Institute, Cary, NC). Repeated measure models with effects of rater and order were used to model the effects of surgeon examination order and measurements during anterior posterior testing at 30 and 90 degrees of knee flexion and varus valgus testing at 10 and 90 degrees of knee flexion. Interactions, linear and quadratic effects were examined but final models were simply categorical main effects of rater and order. Residuals were inspected for normality and constant variance and passed. Similar modeling was performed to evaluate agreement between surgeon for knee joint reaction force, and between force and displacement by category. Kappa statistics for multiple raters were calculated and interpreted according to Green (kappa<0.40: poor or low agreement, 0.40<kappa<0.75: fair to good agreement, 0.75<kappa: high agreement)[8].
Results
AP laxity scores and AP displacement measures (mm) from the motion capture for each observer and subject are shown in Table 2 for recordings at both 30 and 90 degrees. At 30 degrees, the agreement between AP laxity rater score and measured AP displacement was poor for 3 of the 4 raters (κ for observer A,B,C,D: 0.00, 0.0256, 0.5263, 0.3103). At 90 degrees, the agreement between AP laxity rater score and measured AP displacement was also poor for 3 of the 4 raters (κ for observer A,B,C,D: 0.0843, 0.6552, 0.2187, 0.0385). Rater C showed fair agreement with motion capture at 30 degrees flexion and Rater B showed good agreement in 90 degrees of flexion. Overall inter-rater reliability (IRR) was poor at 30 degrees for both the subjective rater score (κ= 0.21, SE = 0.12, p = 0.0337) and the measured AP displacement (κ=0.18, SE=0.1, p=0.0427) and at 90 degrees for both the subjective rater score (κ = 0.04, SE = 0.10, p = 0.3568) and the measured AP displacement (κ= 0.05, SE = 0.09, p = 0.2906).The order of each surgeon’s examination (1,2,3,4) had low correlation with displacement at 30 and 90 degrees using a mixed model (R=0.173).
Table 2:
AP laxity scores from each rater for each participant at 30 and 90 degrees
| Observer, 30 degree AP testing | ||||||||
| Subject | A | B | C | D | ||||
| laxity | mm | laxity | mm | laxity | mm | laxity | mm | |
|
| ||||||||
| 1 | 2 | 4.9 | 3 | 4.9 | 2 | 5.2 | 2 | 5.4 |
| 2 | 2 | 7.9 | 2 | 4.8 | 1 | * | 1 | 7.4 |
| 3 | 2 | 3.8 | 2 | 2.5 | 1 | 3.2 | 1 | 4.7 |
| 4 | 1 | 6.7 | 1 | 3.8 | 2 | 7 | 2 | 6.4 |
| 5 | 1 | 7.1 | 2 | 6.2 | 1 | 7.8 | 2 | 7.3 |
| 6 | 1 | 3.1 | 2 | 3.7 | 1 | 5.2 | 2 | 11.5 |
| 7 | 1 | 2.2 | 2 | 2.2 | 1 | 2.8 | 1 | 3.8 |
| 8 | 2 | 4.8 | 3 | 5.5 | 2 | 5 | 1 | 6.4 |
| 9 | 2 | 6.3 | 3 | 5 | 2 | 9.1 | 1 | 5.8 |
| 10 | 2 | 6.1 | 3 | 5.8 | 2 | 5.6 | 1 | 4.8 |
| Observer, 90 degree AP testing | ||||||||
|
| ||||||||
| Subject | A | B | C | D | ||||
| laxity | mm | laxity | mm | laxity | mm | laxity | mm | |
|
| ||||||||
| 1 | 1 | 7.9 | 2 | 6.1 | 2 | 9.2 | 3 | 9.1 |
| 2 | 1 | 9.8 | 2 | 9.4 | 1 | 10.5 | 1 | 13.3 |
| 3 | 1 | 3.9 | 1 | 4.4 | 1 | 7.5 | 1 | 6.9 |
| 4 | 2 | 11 | 1 | 4.9 | 3 | 9.3 | 3 | 9.4 |
| 5 | 1 | 7.2 | 1 | 3.8 | 2 | 5.3 | 2 | 7.6 |
| 6 | 1 | 7.8 | 2 | 5.9 | 3 | 8.8 | 2 | 8.1 |
| 7 | 1 | 6 | 3 | 4.2 | 3 | 8.4 | 3 | 8.6 |
| 8 | 1 | 6.4 | 3 | 6.2 | 2 | 6 | 2 | 9.5 |
| 9 | 1 | 7.8 | 2 | 5.5 | 3 | 10.6 | 2 | 6.9 |
| 10 | 1 | 6.3 | 2 | 5.3 | 3 | 11.3 | 2 | 6.6 |
Laxity: subjective grading of AP translation (1: 0–5 mm, 2:5–10mm, 3>10 mm)
mm: Measured AP displacement (mm)
Table 3 shows the calculated knee flexion angle in which each observer performed the AP tests for each subject. For the 30° knee flexion angle test, the mean and standard deviations of all raters for all participants was 37°±6°. Rater D (33°±9°) was the only rater who performed the exams at a knee flexion angle with a confidence interval that included 30°, indicating that Raters A, B, and C performed the exam at a knee flexion angle significantly larger than the 30° target (by 8° to 9°). Rater D also exhibited the largest standard deviation of knee flexion angles across the participants, indicating less consistency across participants (range 24° to 55°).
Table 3:
Calculated knee flexion angles for Exams 1 and 2 at 30 and 90 degrees
| Anterior Posterior Stress Measurement Angle | ||||||||
|---|---|---|---|---|---|---|---|---|
| 30 degree test | 90 degree test | |||||||
| Subject | ||||||||
|
|
||||||||
| A | B | C | D | A | B | C | D | |
|
|
||||||||
| 1 | 34.0 | 42.2 | 33.3 | 40.9 | 66.6 | 72.3 | 63.2 | 68.6 |
| 2 | 39.2 | 40.2 | 54.7 | 71.2 | 67.9 | 63.6 | 74.4 | |
| 3 | 39.5 | 38.9 | 37.5 | 31.5 | 62.1 | 72.6 | 64.2 | 66.7 |
| 4 | 44.6 | 43.4 | 41.6 | 28.9 | 66.5 | 71.9 | 65.1 | 81.1 |
| 5 | 39.0 | 43.2 | 40.5 | 29.5 | 73.5 | 72.7 | 67.0 | 75.3 |
| 6 | 34.3 | 30.4 | 37.9 | 24.0 | 64.3 | 62.8 | 65.0 | 77.1 |
| 7 | 34.0 | 36.9 | 39.2 | 32.5 | 68.5 | 66.4 | 62.1 | 71.0 |
| 8 | 37.5 | 37.8 | 40.8 | 27.5 | 65.0 | 66.5 | 61.8 | 69.6 |
| 9 | 38.2 | 35.4 | 36.8 | 27.1 | 58.7 | 65.9 | 61.7 | 67.2 |
| 10 | 47.1 | 40.0 | 42.1 | 34.1 | 73.4 | 73.0 | 65.6 | 79.3 |
|
|
||||||||
| Average | 38.7 | 38.8 | 38.9 | 33.1 | 67.0 | 69.2 | 63.9 | 73.0 |
| SD | 4.4 | 4.0 | 2.8 | 8.9 | 4.8 | 3.7 | 1.8 | 5.1 |
For the 90° test, the mean and standard deviations of all raters for all participants was 68°±5°. All raters performed the exam at significantly less knee flexion compared to the 90° target (ranging from 17° to 26° less flexion).
Pearson (parametric) and Spearman (non-parametric) correlations of Force and Displacement were calculated for each angle/rater combination from data on 10 subjects/examinations. None of the correlations had a p-value<0.05 (Table 4). Thus, none are statistically significantly different from a correlation of 0.0. Rater D at 90 degrees had the strongest correlation of 0.55 with a p-value of 0.1014. Most of the correlations do show a positive relationship of force and displacement increasing together.
Table 4:
Correlation of AP joint reaction force to PA translation:
| Testing Angle | Rater | PC | PC p-value | SC | SC p-value |
|---|---|---|---|---|---|
| 30 | a | −0.31 | 0.376 | −0.26 | 0.467 |
| b | 0.31 | 0.380 | 0.16 | 0.652 | |
| c | 0.24 | 0.529 | 0.07 | 0.865 | |
| d | 0.35 | 0.321 | 0.47 | 0.174 | |
|
| |||||
| 90 | a | 0.02 | 0.945 | 0.13 | 0.726 |
| b | 0.22 | 0.545 | −0.03 | 0.934 | |
| c | 0.49 | 0.147 | 0.49 | 0.150 | |
| d | 0.55 | 0.101 | 0.53 | 0.117 | |
PC Pearson Correlation, SC Spearman Correlation
Interobserver relationships of AP displacement and force was examined. At each angle (30 and 90 degrees), the intraclass correlation coefficient (ICC) was calculated for force and displacement. ICC is a measure of agreement between multiple raters of a continuous measure, similar to a kappa statistic for categorical measures. Poor agreement was found for both AP displacement (ICC 30 degrees 0.34, 90 degree 0.29) and for AP joint reaction force (ICC 30 degrees 0.09, 90 degree 0.02).
Varus-valgus stress measurements are shown in Table 5. IRR was poor for all four observers for the measured angle at both 10 degrees (ICC 0.019) and at 90 degrees (ICC 0.15) and observer subjective laxity measurements at both 10 degrees (Intraclass Correlation −.059) and at 90 degrees (ICC 0.15). The angle at which the raters performed their observations for the 10 degree group was 37.3 degrees (SD 5.9) and for the 90 degree varus valgus measurements at 68.3 degrees (SD 5.2). These are shown in Table 6.
Table 5:
Subjective laxity and measured laxity in varus valgus testing
| Observer, 10 degree VV testing | ||||||||
|
| ||||||||
| Subject | A | B | C | D | ||||
| laxity | degrees | laxity | degrees | laxity | degrees | laxity | degrees | |
|
| ||||||||
| 1 | 1 | 22.4 | 1 | 9.3 | 1 | 13.7 | 2 | 6.9 |
| 2 | 2 | 22.0 | 2 | 6.0 | 1 | 7.4 | 2 | 8.5 |
| 3 | 3 | 13.0 | 1 | 5.5 | 1 | 9.1 | 1 | 4.9 |
| 4 | 2 | 23.8 | 1 | 5.9 | 1 | 11.8 | 2 | 8.0 |
| 5 | 2 | 13.7 | 2 | 5.9 | 2 | 15.4 | 3 | 9.7 |
| 6 | 2 | 17.6 | 1 | 5.1 | 2 | 14.6 | 2 | 7.8 |
| 7 | 2 | 15.5 | 1 | 8.3 | 1 | 6.6 | 1 | 4.9 |
| 8 | 2 | 18.1 | 2 | 8.5 | 2 | 13.4 | 2 | 5.7 |
| 9 | 2 | 18.2 | 2 | 6.0 | 2 | 12.0 | 2 | 6.7 |
| 10 | 3 | 18.0 | 1 | 6.6 | 2 | 11.3 | 2 | 6.4 |
| Observer, 90 degree VV testing | ||||||||
|
| ||||||||
| Subject | A | B | C | D | ||||
| laxity | degrees | laxity | degrees | laxity | degrees | laxity | degrees | |
|
| ||||||||
| 1 | 2 | 23.2 | 2 | 10.1 | 1 | 15.1 | 2 | 10.1 |
|
| ||||||||
| 2 | 2 | 3 | 11.6 | 1 | 12.8 | 2 | 13.0 | |
|
| ||||||||
| 3 | 2 | 14.1 | 3 | 10.1 | 1 | 6.3 | 2 | 7.3 |
|
| ||||||||
| 4 | 1 | 30.3 | 1 | 14.9 | 2 | 11.1 | 2 | 13.4 |
|
| ||||||||
| 5 | 2 | 20.7 | 2 | 12.2 | 1 | 8.1 | 2 | 16.1 |
|
| ||||||||
| 6 | 2 | 20.5 | 1 | 13.3 | 2 | 19.5 | 2 | 14.5 |
|
| ||||||||
| 7 | 2 | 17.4 | 3 | 10.9 | 1 | 10.8 | 2 | 14.4 |
|
| ||||||||
| 8 | 2 | 11.6 | 3 | 7.9 | 2 | 11.6 | 1 | 12.2 |
|
| ||||||||
| 9 | 2 | 24.5 | 3 | 13.4 | 3 | 13.9 | 1 | 16.8 |
|
| ||||||||
| 10 | 2 | 24.2 | 3 | 2 | 12.4 | 3 | 12.0 | |
Table 6:
Mean flexion angle for VV measurements
| Varus Valgus Stress Measurement Angle | ||||||||
|---|---|---|---|---|---|---|---|---|
| 10 degree test | 90 degree test | |||||||
| Subject | ||||||||
|
|
||||||||
| A | B | C | D | A | B | C | D | |
|
|
||||||||
| 1 | 13.4 | 7.4 | 25 | 47.3 | 72.3 | 52.2 | 51.7 | |
|
|
||||||||
| 2 | 19.9 | 9.2 | 23.9 | 22.1 | 69.5 | 69 | 60 | |
|
|
||||||||
| 3 | 26.9 | 16.4 | 30.7 | 10.1 | 53 | 68.2 | 63.2 | 53.4 |
|
|
||||||||
| 4 | 25.3 | 17.5 | 30.9 | 20 | 66.2 | 67.2 | 62.5 | 68 |
|
|
||||||||
| 5 | 23.8 | 31.3 | 28.8 | 13.8 | 55.3 | 73.8 | 66 | 64.2 |
|
|
||||||||
| 6 | 12.4 | 10.6 | 29.3 | 17.2 | 55.3 | 63 | 64.1 | 55.7 |
|
|
||||||||
| 7 | 31.9 | 11.8 | 26.4 | 19.5 | 62.4 | 64.7 | 60.7 | 46.9 |
|
|
||||||||
| 8 | 20.8 | 22.2 | 26.8 | 62.6 | 67.3 | 62.2 | 55.5 | |
|
|
||||||||
| 9 | 25.2 | 2.2 | 29.5 | 13.4 | 52.1 | 63.4 | 65 | 54.6 |
|
|
||||||||
| 10 | 22.8 | 9.2 | 25.6 | 14 | 61.8 | 64.1 | 57.8 | |
|
|
||||||||
| Average | 22.2 | 12.8 | 27.2 | 17.4 | 57.3 | 67.7 | 62.9 | 56.8 |
| SD | 5.9 | 8.3 | 3.0 | 5.2 | 6.2 | 3.7 | 4.4 | 6.1 |
Discussion
Poor inter rater reliability was found between four joint replacement surgeons for the clinical examination of prosthetic knee laxity. Consistency was poor for both AP and varus-valgus laxity testing measures. It is unclear from our methodology whether this is due to differences in examination techniques of the surgeons or from differences in the patient’s reaction to the various examinations during testing. The joint reaction force during each examination was not consistent between observers, and it is possible that variations in the surgeon technique, such as speed or force applied during testing, may play a role in the non-specificity of the test. Furthermore, muscle contracture or pain during testing may also lead to guarding and an increase in baseline patient muscle tone.
It is well established that the diagnosis of flexion instability after TKA relies on a constellation of signs and symptoms, but the lack of consistency we demonstrated with the clinical examination is concerning. Schwabet al laid out common clinical findings denoting flexion instability, including the patient’s history, exam and aspiration results[4]. Instability alone, however, does not necessarily mean that the patient has a painful or dysfunctional knee replacement. Our study may indicate that the perceived absence of laxity on exam can not necessarily rule out FI as a diagnosis. It is possible that multiple examinations over time may help the surgeon in the clinical diagnosis of FI.
Multiple factors in the clinical exam were inconsistent despite attempts to standardize these across the raters. Observers in this study incorrectly estimated the angle at which to examine the knees. For the 30-degree test, the observers measured the knee motion at a mean of 37.3 degrees. For the 90-degree test, this was calculated at a mean of 68 degrees using traditional motion capture techniques. Some of the miscalculation may be related to the investigator not accounting for the femoral shank angle. During this study, examination of the patients occurred with them sitting on the edge of an exam table with both lower legs hanging over the edge of the table. It is likely the raters assumed the axis of the femur was parallel to the exam table, and hence parallel to the floor, and thereby measured the knee angle based on this inaccurate assumption. However, an individual with more buttock adipose tissue or a very robust gluteus maximus musculature will have a proximal femur that is elevated from the exam table compared to a thin individual. The measurement angle with the use of a goniometer during testing scenarios may improve the accuracy of the goal of testing angle. The inaccuracy in correctly performing the exam at a given knee flexion angle in this study highlights the difficulties orthopedic surgeons encounter when determining knee angles without measurement tools. If an accurate knee angle is critical for any given exam, we suggest that examiners use a goniometer to position the patient more accurately.
Soft tissue artifact may also play a role in the discrepancy between estimated and measured angle. The greater trochanter marker was place during quiet standing, and the marker was not moved after patients were seated for examination. Particularly for patients with higher BMIs, the soft tissue artifact from this single marker during sitting likely introduces some error. For this study, observers were not provided feedback during the testing from the laboratory staff. The observers were blinded to the observations and testing set up of the other surgeons.
We also demonstrated that joint reaction force of the knee during the AP exams between observers was not consistent. There was also poor correlation between the joint reaction force and the motion measured on the motion capture. Further work is required to determine if a clinical exam test alone can be made more reliable. In the ACL deficient native knee, a mechanical device (KT-1000 arthrometer, MEDmetric Corp., San Diego, CA) has been used to quantitatively measure ACL insufficiency. Prior attempts of applying the KT1000 to patients with replaced knees found that >7mm of motion to be indicative of instability when measured at 30 degrees of flexion[9]. The KT-1000, however, cannot be used to determine instability of a knee in 90 degrees of flexion due to inherent device application restrictions, limiting its potential application to assess TKA stability. Accelerometers have also been used in patients while walking but have been unable to determine instability[10]. Further modification of a KT-1000 type device or development of another accelerometer may allow for more quantitative measurements of FI in knee replacement patients in the future[11]. Another potential option is stress radiograph evaluation[12]. This study tool has determined cutoff values for instability that may be an additional tool to determine which knees may benefit from revision surgery[13].
The inherent difficulty diagnosing FI and its role in creating a painful TKA create challenges for surgeons when selecting when revision surgery is appropriate. While it is believed that there is a correlation between coronal plane stability and clinical results[14–16], prior work has demonstrated that there are patients who are unstable in flexion and are satisfied with their knee replacement[6]. The results of revision for FI does not demonstrate as much improvement as revision for aseptic loosening and other etiologies[17,18]. It is unclear if this is due to difficulty in establishing the correct diagnosis, differences in pre-revision patient pain and function scores, or variables in the surgical technique for revision. Generally, the tenant of revision surgery is to create a neutral slope on the tibia and increase the size of the femoral implant to decrease the flexion gap[19,20]. In some cases increasing overall constraint, such as rotating hinge bearing, may improve results[21].
Limitations
Our study has several limitations. There were differences in technique even though each surgeon is fellowship trained in arthroplasty and specializes in hip and knee replacement. Significant differences in actual force applied, duration of the test, and testing mechanics were observed. Muscle activation and inhibition from pain may further contribute to variability between testers. Muscle strengthening has been shown to improve results of patients with FI and it is possible that quadriceps contraction may limit AP translation of a knee replacement[22]. We did not have EMG data to determine the level of muscle activation throughout the testing. This may have provided additional data points for which to control. We utilized skin markers for our motion capture based kinematic analysis. Certainly, skin artifact may cause some degree of error particularly in patients with larger skin envelopes. However, the marker placement we utilized is commonly used in the evaluation of knee flexion angle, and motion capture offered the best measurement tool we had available for this non-invasive study. Furthermore, markers were not removed between each surgeon’s examination, meaning that errors that may have occurred in one patient were consistent across each examiner.
Our anterior-posterior laxity testing was performed in an open chain manner. It is possible that a closed chain testing with the foot on the ground may have been a superior method to generate more uniform testing conditions. It is also plausible that patients could guard differently during one examination versus another. Each subject was a patient of one of the four examiners. It is possible that this could create recall bias to that individual examiner. Future studies should standardize how the AP test is performed. However, it is likely that differences may still exist in clinical practice by surgeons as compared to the tests described in the orthopaedic literature. Lastly, skin artifact impacts accuracy of motion capture, markers are not directly on the bone and may be prone to motion on the skin especially when a patient has large amounts of adipose tissue.
Conclusion
The clinical laxity examination of patients with TKA does not seem to be consistent between trained observers. The diagnosis of flexion instability should be based not only on clinical exam but patient history and other clinical studies.
Supplementary Material
Acknowledgements
Research reported in this publication was supported by the National Institute of General Medical Sciences of the National Institutes of Health under Award Number P20GM125503. The content is solely the responsibility of the authors and does not necessarily represent the official views of the National Institutes of Health. In addition, the Bill and Betty Petty Research Fund at the University of Arkansas for Medical Sciences supported this work.
Abbreviations:
- (TKA)
Total knee arthroplasty
- (FI)
Flexion instability
Footnotes
Publisher's Disclaimer: This is a PDF file of an unedited manuscript that has been accepted for publication. As a service to our customers we are providing this early version of the manuscript. The manuscript will undergo copyediting, typesetting, and review of the resulting proof before it is published in its final form. Please note that during the production process errors may be discovered which could affect the content, and all legal disclaimers that apply to the journal pertain.
References
- [1].Grayson CW, Warth LC, Ziemba-Davis MM, Michael Meneghini R. Functional Improvement and Expectations Are Diminished in Total Knee Arthroplasty Patients Revised for Flexion Instability Compared to Aseptic Loosening and Infection. J Arthroplasty 2016. 10.1016/j.arth.2016.03.001. [DOI] [PubMed] [Google Scholar]
- [2].Sharkey PF, Lichstein PM, Shen C, Tokarski AT, Parvizi J. Why are total knee arthroplasties failing today--has anything changed after 10 years? J Arthroplasty 2014;29:1774–8. 10.1016/j.arth.2013.07.024. [DOI] [PubMed] [Google Scholar]
- [3].Le DH, Goodman SB, Maloney WJ, Huddleston JI. Current modes of failure in TKA: infection, instability, and stiffness predominate. Clin Orthop Relat Res 2014;472:2197–200. 10.1007/s11999-014-3540-y. [DOI] [PMC free article] [PubMed] [Google Scholar]
- [4].Schwab JH, Haidukewych GJ, Hanssen AD, Jacofsky DJ, Pagnano MW. Flexion instability without dislocation after posterior stabilized total knees. Clin. Orthop. Relat. Res, 2005. 10.1097/01.blo.0000185449.51246.d6. [DOI] [PubMed] [Google Scholar]
- [5].Pagnano MW, Hanssen AD, Lewallen DG, Stuart MJ. Flexion instability after primary posterior cruciate retaining total knee arthroplasty. Clin Orthop Relat Res 1998:39–46. [DOI] [PubMed] [Google Scholar]
- [6].McAuliffe MJ, O’Connor PB, Major LJ, Garg G, Whitehouse SL, Crawford RW. Highly Satisfied Total Knee Arthroplasty Patients Display a Wide Range of Soft Tissue Balance. J Knee Surg 2020;33:247–54. 10.1055/s-0039-1677873. [DOI] [PubMed] [Google Scholar]
- [7].De Leva P Adjustments to zatsiorsky-seluyanov’s segment inertia parameters. J Biomech 1996;29:1223–30. 10.1016/0021-9290(95)00178-6. [DOI] [PubMed] [Google Scholar]
- [8].Green A Kappa Statistics for Multiple Raters Using Categorical Classifications. SAS Glob Forum Proc 1997. [Google Scholar]
- [9].Mochizuki T, Tanifuji O, Sato T, Hijikata H, Koga H, Watanabe S, et al. Association between anteroposterior laxity in mid-range flexion and subjective healing of instability after total knee arthroplasty. Knee Surgery, Sport Traumatol Arthrosc 2017;25:3543–8. 10.1007/s00167-016-4375-8. [DOI] [PubMed] [Google Scholar]
- [10].Soeno T, Mochizuki T, Tanifuji O, Koga H, Murayama T, Hijikata H, et al. No differences in objective dynamic instability during acceleration of the knee with or without subjective instability post-total knee arthroplasty. PLoS One 2018;13:e0194221. 10.1371/journal.pone.0194221. [DOI] [PMC free article] [PubMed] [Google Scholar]
- [11].Khan H, Walker PS, Zuckerman JD, Slover J, Jaffe F, Karia RJ, et al. The Potential of Accelerometers in the Evaluation of Stability of Total Knee Arthroplasty. J Arthroplasty 2013. 10.1016/j.arth.2012.07.025. [DOI] [PubMed] [Google Scholar]
- [12].Kappel A, Mortensen JF, Nielsen PT, Odgaard A, Laursen M. Reliability of stress radiography in the assessment of coronal laxity following total knee arthroplasty. Knee 2020;27:221–8. 10.1016/j.knee.2019.09.013. [DOI] [PubMed] [Google Scholar]
- [13].Murer M, Falkowski AL, Hirschmann A, Amsler F, Hirschmann MT. Threshold values for stress radiographs in unstable knees after total knee arthroplasty. Knee Surgery, Sport Traumatol Arthrosc 2021;29:422–8. 10.1007/s00167-020-05964-z. [DOI] [PubMed] [Google Scholar]
- [14].Kappel A, Laursen M, Nielsen PT, Odgaard A. Relationship between outcome scores and knee laxity following total knee arthroplasty: a systematic review. Acta Orthop 2019;90:46–52. 10.1080/17453674.2018.1554400. [DOI] [PMC free article] [PubMed] [Google Scholar]
- [15].Seah RB, Pang HN, Lo NN, Chong HC, Chin PL, Chia SL, et al. Evaluation of the relationship between anteroposterior translation of a posterior cruciate ligament-retaining total knee replacement and functional outcome. J Bone Jt Surg Br 2012;94:1362–5. 10.1302/0301-620X.94B10. [DOI] [PubMed] [Google Scholar]
- [16].Matsumoto K, Ogawa H, Yoshioka H, Akiyama H. Postoperative Anteroposterior Laxity Influences Subjective Outcome After Total Knee Arthroplasty. J Arthroplasty 2017;32:1845–9. 10.1016/j.arth.2016.12.043. [DOI] [PubMed] [Google Scholar]
- [17].Rajgopal A, Panjwani TR, Rao A, Dahiya V. Are the Outcomes of Revision Knee Arthroplasty for Flexion Instability the Same as for Other Major Failure Mechanisms? J Arthroplasty 2017. 10.1016/j.arth.2017.05.010. [DOI] [PubMed] [Google Scholar]
- [18].Grayson CW, Warth LC, Ziemba-Davis MM, Michael Meneghini R. Functional Improvement and Expectations Are Diminished in Total Knee Arthroplasty Patients Revised for Flexion Instability Compared to Aseptic Loosening and Infection. J Arthroplasty 2016;31:2241–6. 10.1016/j.arth.2016.03.001. [DOI] [PubMed] [Google Scholar]
- [19].Abdel MP, Pulido L, Severson EP, Hanssen AD. Stepwise surgical correction of instability in flexion after total knee replacement. Bone Jt J 2014. 10.1302/0301-620X.96B12.34821. [DOI] [PubMed] [Google Scholar]
- [20].Vince KG. Diagnosis and management of patients with instability of the knee. Instr Course Lect 2012;61:515–24. [PubMed] [Google Scholar]
- [21].Luttjeboer JS, Bénard MR, Defoort KC, van Hellemondt GG, Wymenga AB. Revision Total Knee Arthroplasty for Instability—Outcome for Different Types of Instability and Implants. J Arthroplasty 2016;31:2672–6. 10.1016/j.arth.2016.06.062. [DOI] [PubMed] [Google Scholar]
- [22].Stambough JB, Majors IB, Oholendt CK, Edwards PK, Mears SC, Barnes CL. Improvements in Isokinetic Quadriceps and Hamstring Strength Testing After Focused Therapy in Patients With Flexion Instability. J Arthroplasty 2020. 10.1016/j.arth.2020.03.052. [DOI] [PubMed] [Google Scholar]
Associated Data
This section collects any data citations, data availability statements, or supplementary materials included in this article.