

SUMMARY
Phospholipase A2, Group VII (PLA2G7) is widely recognized as a secreted, lipoprotein-associated PLA2 in plasma that converts phospholipid platelet-activating factor (PAF) to a biologically inactive product Lyso-PAF during inflammatory response. We report that intracellular PLA2G7 is selectively important for cell proliferation and tumor growth potential of melanoma cells expressing mutant NRAS but not cells expressing BRAF V600E. Mechanistically, PLA2G7 signals through its product Lyso-PAF to contribute to RAF1 activation by mutant NRAS, which is bypassed by BRAF V600E. Intracellular Lyso-PAF promotes p21-activated kinase 2 (PAK2) activation by binding to its catalytic domain and altering ATP kinetics, while PAK2 significantly contributes to S338-phosphorylation of RAF1 in addition to PAK1. Furthermore, the PLA2G7-PAK2 axis is also required for full activation of RAF1 in cells stimulated by epidermal growth factor (EGF) or cancer cells expressing mutant KRAS. Thus, PLA2G7 and Lyso-PAF exhibit intracellular signaling functions as a key element of RAS-RAF1 signaling.
Keywords: Phospholipases A2 (PLA2s); Phospholipase A2, Group VII (PLA2G7); plateletactivating factor (PAF); Lyso-PAF; RAS; RAF1; MEK; ERK; p21-activated kinase 2 (PAK2); BRAF-V600E
Graphical Abstract
eTOC Blurb
PLA2G7 is widely recognized as a secreted enzyme that converts phospholipidplatelet-activating factor (PAF) to a biologically inactive product Lyso-PAF. Gao et. al. report that PLA2G7 and Lyso-AF exhibit intracellular signaling functions as a key element of RAS-RAF1 signaling.
INTRODUCTION
Phospholipases A2 (PLA2s) are a large family of enzymes that hydrolyze phospholipids at the sn-2 position to release lysophospholipid products and free fatty acids, which can be further divided into six subfamilies, including cytosolic PLA2s (cPLA2s), calcium-independent PLA2s (iPLA2s), secreted PLA2s (sPLA2s), lysosomal PLA2s, adipose-specific PLA2s and lipoprotein-associated PLA2s (lp-PLA2s) (Peng et al., 2021). Plasma lp-PLA2 is also known as platelet activating factor (PAF) acetylhydrolase (PAF-AH), which is an enzyme encoded by PLA2G7 gene in human. PLA2G7 is a secreted enzyme produced by leukocytes including macrophages, T cells, and mast cells, which catalyzes the degradation of PAF and production of the biologically inactive products Lyso-PAF and acetate (Arai et al., 2002; Karasawa et al., 2003). PAF is a circulating phospholipid produced by a variety of cell types, in particular leukocytes, which, among multiple physiological functions, is a potent mediator of inflammation through extracellularly binding to and activating PAF receptors on endothelial cells and leukocytes (McIntyre et al., 2009). PLA2G7 converts PAF to Lyso-PAF, which is a biologically inactive form of phospholipid, blocking PAF-induced inflammation and vascular permeability (Vittos et al., 2012). Thus, plasma PLA2G7 plays an important role in the control of acute inflammation and modulation of chronic inflammatory disease (McIntyre et al., 2009). Recently, plasma PLA2G7 has been suggested to participate in cellular processes related to tumorigenesis and tumor progression by regulating the levels of lipid mediators (Stafforini, 2015).For example, PLA2G7 is upregulated in prostate cancer and knockdown of PLA2G7 reduces prostate cancer cell proliferation (Vainio et al., 2011). However, the detailed functions of PLA2G7, PAF or Lyso-PAF in cell proliferation as well as the underlying intracellular mechanisms remain unclear.
Melanoma is one of the most common human cancers. More than 50% of melanomas express oncogenic BRAF V600E mutant, while NRAS mutations are found in 15-20% of melanoma patients. Notably NRAS and BRAF mutations are mutually exclusive in melanoma patients (Bollag et al., 2012; Gibney et al., 2013; Johnson and Sosman, 2013; Munoz-Couselo et al., 2017). We performed a systematic RNAi-based screen using a metabolism-targeted shRNA library to identify metabolic vulnerabilities specifically required by oncogenic BRAF V600E mutant, but not other oncogenes such as NRAS Q61R/K, in human melanoma (Kang et al., 2015). We found that a ketogenic enzyme HMG-CoA lyase (HMGCL) is selectively essential by signaling through its product acetoacetate in melanoma cells expressing BRAF V600E, where acetoacetate specifically promotes BRAF V600E-dependent MEK1 activation (Kang et al., 2015; Xia et al., 2017). In addition, we demonstrated that a circulating dietary supplement, chondroitin-4-sulfate (CHSA), exhibits intracellular signaling function and enhances casein kinase II (CKII)-PTEN binding, leading to PTEN inhibition and subsequent AKT activation, which is crucial for cancers expressing BRAF V600E (Lin et al., 2018).
Hereby we report that reanalysis of the screen results (Kang et al., 2015) revealed that PLA2G7 is selectively important for human melanoma cells expressing mutant NRAS, but not melanoma cells expressing BRAF V600E.
RESULTS
Intracellular PLA2G7 is selectively important for MEK-ERK activation and consequent cell proliferative and tumor growth potential of melanoma cells expressing mutant NRAS, but not cells expressing BRAF V600E.
We reanalyzed the screen results (Kang et al., 2015) by comparing NRAS mutant-expressing melanoma cells (NRASM) to cells expressing wild type NRAS and BRAF (WT), or BRAF V600E (BRAFM) (Figure S1A). The top 33 candidates, knockdown of which inhibited only melanoma cells expressing mutant NRAS but not control cells expressing BRAF V600E or wild type (WT) NRAS and BRAF are shown in Supplemental Table S1. We chose PLA2G7 (plasma PAF-AH) for initial evaluation due to its important biological function. Interestingly, PLA2G7 protein expression levels do not correlate with the mutational status of NRAS in diverse human melanoma cells (Figure S1B). In addition, TCGA data analysis shows no correlation between NRAS mutation and PLA2G7 mRNA levels in melanoma patients (Figure S1C). These results suggest that PLA2G7 is likely involved in a common, “house-keeping” mechanism that is important for cells expressing mutant NRAS but dispensable in BRAF V600E-expressing cells.
We confirmed the screening result by showing that transient knockdown of PLA2G7 by siRNA selectively attenuated cell proliferation rates of NRAS mutant-expressing melanoma HMCB (Q61K) and VMM39 (Q61R) cells (Figure 1A, left), but not control human A375 and A2058 melanoma cells expressing BRAF V600E (Figure 1B, left). Similar results were obtained using cells with PLA2G7 deficiency mediated through stable knockdown by shRNA (Figure S1D), or stable knockout by CRISPR/Cas9using sgRNA (Figure 1C, left). Furthermore, we found that PLA2G7-deficieny induced by different approaches all resulted in a significant decrease in the phosphorylation levels of MEK and ERK, but not AKT in mutant NRAS-expressing melanoma cells, whereas PLA2G7-deciency did not affect phosphorylation levels of MEK, ERK or AKT in control cells expressing BRAF V600E (Figures 1A–1C, right panels; S1E).
Figure 1. Intracellular PLA2G7 is selectively important for cell proliferative potential of melanoma cells expressing mutant NRAS.

(A-B) Effects of knockdown of endogenous PLA2G7 by siRNA on cell proliferation rates were examined in human melanoma cells expressing mutant NRAS (A, left) or BRAF V600E (B, left). Representative western blot results to detect phosphorylation and protein expression levels of MEK1/2, ERK1/2 and ART in melanoma cells expressing mutant NRAS (A, middle) or BRAF V600E (B, middle) are shown. Histogram shows western blot quantification result of three independently repeated experiments (A-B, right).
(C) Effects of stable knockout of endogenous PLA2G7 by CRISPR/Cas9 using sgRNA on cell proliferation rates were examined in human melanoma cells expressing mutant NRAS or BRAF V600E (left). Representative western blot results to detect phosphorylation and protein expression levels of MEK1/2, ERK1/2 and AKT are shown (middle). Histogram shows western blot quantification result of three independently repeated experiments (right).
The fold changes of the intensity ratios between phosphor-MEK and total MEK or phosphor-ERK and total ERK were indicated. The data are represented as mean ± SD (n=3). p values were obtained by a two-tailed Student’s t test except a two-way ANOVA test for cell proliferation assay (***p<0.001; **0.001 < p< 0.01; *0.01 <p< 0.05; ns, not significant).
Also see Figures S1–S2 and Table S1.
Consistent with these findings, stable knockdown of PLA2G7 by shRNA resulted in significantly decreased tumor growth rates, weights and sizes of xenografts derived from HMCB cells inoculated in nude mice (Figures 2A, left; S1F), with reduced phosphorylation levels of MEK and ERK, but not AKT, in tumor tissue samples (Figures 2A, right). In contrast, PLA2G7 knockdown did not significantly affect tumor growth potential of A375 cells in xenograft mice (Figures 2B, left; S1G), nor phosphorylation levels of MEK, ERK or AKT in tumor lysates (Figures 2B, right).
Figure 2. Knockdown of PLA2G7 selective attenuates tumor growth potential of human melanoma cells expressing mutant NRAS.
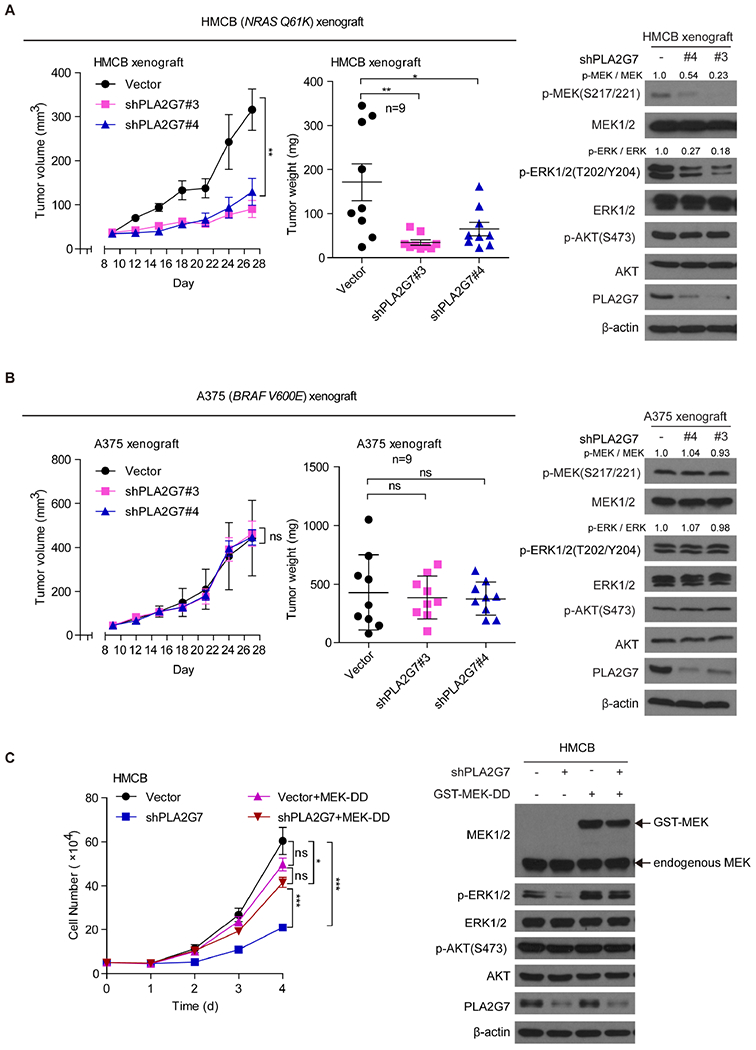
(A-B) Effects of stable knockdown of endogenous PLA2G7 on tumor growth and tumor weight (left two panels) and phosphorylation and protein expression levels of MEK1/2, EKR1/2, and AKT in tumor lysates assessed by western blot (right) in nude mice inoculated with human melanoma NRAS-Q61K HMCB (A) or BRAF V600E-positive A375cells (B).
(C) Effects of expression of GST-tagged MEK-DD (S217D/S221D), a MEK1 constitutively active form, on cell proliferation rates (left), and phosphorylation and protein expression levels ofEKR1/2and AKT assessed by western blot (right) in NRAS-Q61K HMCB melanoma cells with or without stable knockdown of endogenous PLA2G7.
The fold changes of the intensity ratios between phosphor-MEK and total MEK or phosphor-ERK and total ERK were indicated. The data are represented as mean ± SD except mean ± SEM for tumor growth (n≥3). p values were obtained by a two-tailed Student’s t test except a two-way ANOVA test for cell proliferation assay and tumor growth rates (***p<0.001; **0.001 <p< 0.01; *0.01 <p< 0.05; ns, not significant).
Also see Figures S1–S3.
Moreover, expression of GST-tagged MEK1 DD (S217D/S221D), a constitutively active form of MEK1, in HMCB cells with stable knockdown of PLA2G7 reversed not only the attenuated cell proliferative potential (Figure 2C, left) but also the reduced ERK1/2 phosphorylation (Figure 2C, right) due to PLA2G7 deficiency. These results together suggest that, mechanistically, PLA2G7 is selectively important for cell proliferation of NRAS mutant-expressing melanoma cells by primarily contributing to activation of MEK-ERK signaling pathway.
To determine whether extracellular or intracellular PLA2G7 is functionally important, we collected the culture media of HMCB cells to treat cells with transient knockdown of endogenous PLA2G7, where conditioned media did not rescue the decreased cell proliferation (Figure S2A). Similarly, conditioned media did not rescue the decreased cell proliferation of HMCB cells with stable knockdown of endogenous PLA2G7 (Figure S2B). Moreover, we detected PLA2G7 protein in culture media in a much lower level compared to the intracellular PLA2G7 protein level in HMCB cells, while transient knockdown of endogenous PLA2G7 drastically reduced intracellular but not extracellular PLA2G7 protein levels (Figure S2C, left). In addition, adding increasing concentrations of purified PLA2G7 protein in the culture media did not affect cell proliferation of control HMCB cells, or rescue the decreased cell proliferation in cells with transient knockdown of endogenous PLA2G7 (Figure S2C, right). Similar results were obtained using HMCB cells and cells with stable knockdown of endogenous PLA2G7 (Figure S2D). These results together suggest that PLA2G7 protein is secreted to culture media but extracellular PLA2G7 has no effects on HMCB cell proliferation, supporting our hypothesis that intracellular PLA2G7 is important for mutant NRAS-expressing melanoma cell proliferation.
Importance of PLA2G7 depends on the oncogenic “driver” role of mutant NRAS in isogenic melanoma cell lines.
We next tested whether switching expression of oncogenic “driver” mutants in melanoma cells would switch the reliance on PLA2G7 in melanoma cells. Commercial NRAS (061K) mutant-A375 isogenic cell line (ATCC® CRL-1619IG-2™) was created by CRISPR/Cas9 gene editing to generate an antibiotic-resistant NRAS 061K mutation within the BRAF V600E-expressing A375 melanoma cells. Thus, CRL-1619IG-2 line expresses both BRAF V600E and NRAS Q61R mutants, which thus demonstrates drug resistance to BRAF inhibitors Dabrafineb and Vemurafenib.
Consistent with these findings, transient knockdown of PLA2G7 by siRNA did not affect cell proliferation potential (Figure S3A, left) or phosphorylation levels of MEK1/2 or ERK1/2 (Figure S3A, right) in parental A375, or CRL-1619IG-2 cells expressing both mutant BRAF and NRAS. In contrast, in our newly generated isogenic CRL-1619IG-2 cell line with stable knockdown of BRAF by shRNA to allow the cells switch to NRAS Q61K mutant as the oncogenic “driver”, transient knockdown of PLA2G7 by siRNA resulted in reduced cell proliferation (Figure S3A, left) and MEK/ERK phosphorylation (Figure S3A, right). Moreover, stable knockdown of PLA2G7 by shRNA did not significantly affect the tumor growth rates, weights and sizes of xenografts derived from CRL-1619IG-2 cells expressing both mutant BRAF and NRAS inoculated in nude mice (Figure S3B). In contrast, PLA2G7 knockdown significantly reduced tumor growth potential of isogenic CRL-1619IG-2 cells with stable knockdown of BRAF in xenograft mice (Figure S3C). Thus, these results together suggest that the mutational status of NRAS but not BRAF confers the selective reliance of PLA2G7 to melanoma cells.
PLA2G7 signals through its biologically inactive product Lyso-PAF to regulate MEK-ERK signaling.
Since knockdown or CRISPR/Cas9-mediate knockout of PLA2G7 manipulates PLA2G7 expression levels in cells, it remains unclear whether PLA2G7 enzyme activity is required for its selective importance in mutant NRAS-expressing melanoma cells. We thus generated PLA2G7 S273A mutant (Figure 3A, left), an enzyme-deficient form of PLA2G7 (Nagano et al., 2013). We found that “rescue” expression of GST-tagged PLA2G7 wild type (WT), but not the PLA2G7 S273A mutant, effectively reversed the reduced cell proliferation potential in HMCB cells with stable knockdown of PLA2G7 (Figure 3A, right). In addition, knockdown of PLA2G7 resulted in intracellular accumulation of its substrate PAF (40μM → 72μM) but reduced intracellular levels of its product Lyso-PAF (30μM → 4μM), which were measured by NMR analysis, compared to control parental cells (Figure 3B). We thus hypothesized that the altered PAF or Lyso-PAF levels might affect activation of MEK-ERK pathway in melanoma cells.
Figure 3. PLA2G7 signals through its biologically inactive product Lyso-PAF to regulate MEK-ERK signaling.
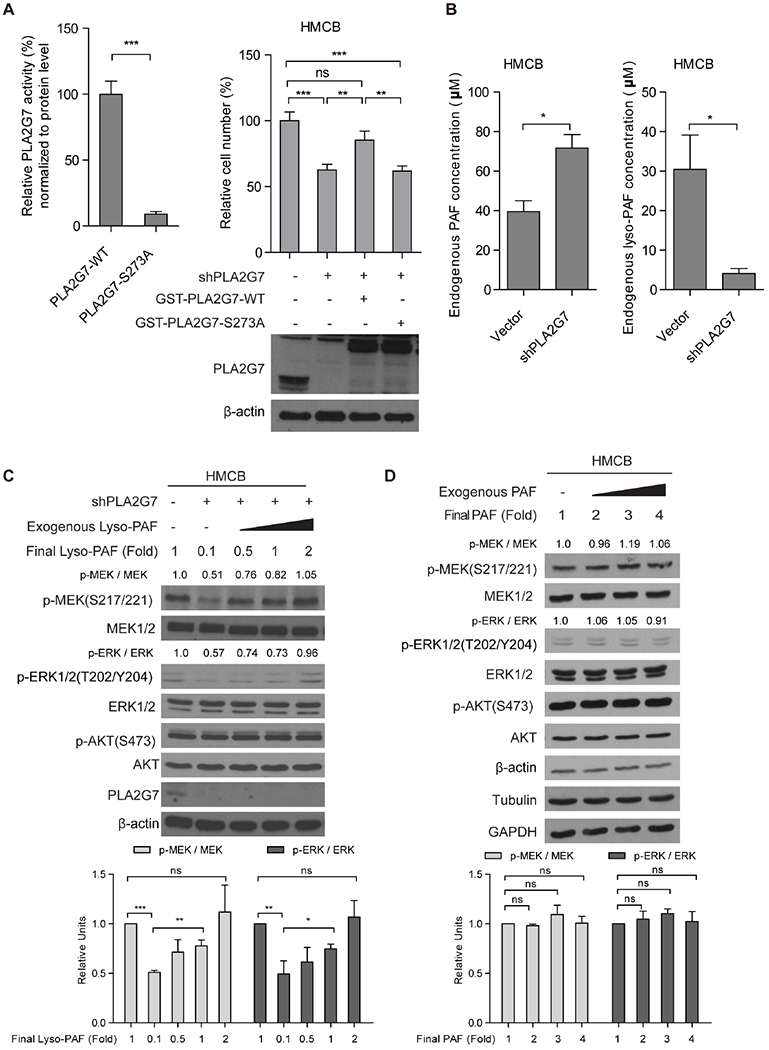
(A) Left. Results of in vitro enzyme assay using purified proteins of PLA2G7 wild type (WT) or S273A mutant, an “enzyme-deficient” form. Right: Effects of “rescue” expression ofRNAi-resistantPLA2G7 WT or S273A mutant on cell proliferation of HMCB cells with stable knockdown of endogenous PLA2G7 by shRNA.
(B) Results of NMR analysis assessing effects of stable knockdown of PLA2G7 by shRNA on intracellular levels of its substrate PAF (left) and product Lyso-PAF (right).
(C) Representative western blot results to detect effects of supplement of increasing concentrations of Lyso-PAF to “rescue” the reduced Lyso-PAF levels on phosphorylation levels of MEK1/2 and ERK1/2 in lysates of HMCB cells with or without stable PLA2G7 knockdown (upper). Histogram shows western blot quantification result of three independently repeated experiments (lower).
(D) Representative western blot results to detect effects of elevating concentrations of PAF to mimic PAF accumulation in PLA2G7-knockdown cells on phosphorylation levels of MEK1/2 and ERK1/2 in HMCB cell lysates (upper). Histogram shows western blot quantification result of three independently repeated experiments (lower).
The fold changes of the intensity ratios between phosphor-MEK and total MEK or phosphor-ERK and total ERK were indicated. The data are represented as mean ± SD (n=3). p values were obtained by a two-tailed Student’s t test except a one-way ANOVA test for cell proliferation assay in Figure 3A (***p<0.001; **0.001 <p< 0.01; *0.01 <p< 0.05; ns, not significant).
Further studies using a cell-free system revealed that supplement with increasing concentrations of exogenous Lyso-PAF to “rescue” the reduced endogenous Lyso-PAF levels in HMCB cell lysates reversed the decreased phosphorylation levels of MEK and ERK in cells with stable knockdown of PLA2G7 (Figure 3C). In contrast, mimicking accumulation of PAF in cells with PLA2G7 knockdown by adding increasing concentrations of PAF to parental HMCB cell lysates did not affect phosphorylation levels of MEK or ERK (Figure 3D). These results suggest that the biologically inactive Lyso-PAF may have intracellular signaling function and regulate MEK-ERK pathway.
PLA2G7-Lyso-PAF axis contributes to S338 phosphorylation of RAF1.
We next found that expression of BRAF V600E in HMCB cells with stable knockdown of PLA2G7 reversed not only the attenuated cell proliferative potential (Figure S3D, left) but also the reduced MEK1/2 and ERK1/2 phosphorylation (Figure S3D, right). Since the difference of MEK activation lies in that RAF1 activates MEK in cells expressing mutant NRAS, whereas BRAF V600E “bypasses” RAF1by directly activating MEK, we reasoned that PLA2G7 may contribute to RAF1 activation. We found that stable knockdown of PLA2G7 in HMCB cells significantly reduced endogenous RAF1 kinase activity, which was assessed in an in vitro kinase assay using immunoprecipitated RAF1 incubated with purified, recombinant MEK1 as a substrate (Figure 4A). However, increasing concentrations of Lyso-PAF (Figure S4A, left) or PAF (Figure S4A, right) did not affect kinase activity levels of immunoprecipitated RAF1 from HMCB cells in an in vitro kinase assay using MEK1 as a substrate. These data suggest that the PLA2G7-Lyso-PAF axis is involved in RAF1 activation but does not affect RAF1 directly.
Figure 4. PLA2G7-Lyso-PAF axis contributes to S338 phosphorylation of RAF1.

(A) Kinase activity of immunoprecipitated RAF1 from HMCB cells with or without PLA2G7 knockdown assessed by western blot in an in vitro kinase assay using recombinant, purified MEK1 as a substrate (left). Histogram shows western blot quantification result of three independently repeated experiments (right).
(B-C) Effects of PLA2G7 knockdown on S338 and S259 phosphorylation levels of immunoprecipitated RAF1 and phosphorylation and protein expression levels of endogenous RAF1, MEK1/2, ERK1/2 and AKT in lysates of human melanoma cells expressing mutant NRAS (B) and control cells expressing BRAF V600E (C) were assessed by western blot (left). Histogram shows western blot quantification result of three independently repeated experiments (right).
(D) Left upper: Representative western blot results to detect effects of supplement with increasing concentrations of Lyso-PAF to “rescue” the reduced Lyso-PAF levels on S338 phosphorylation levels of RAF1 in lysates of HMCB cells with stable PLA2G7 knockdown. Left lower: Representative western blot results to detect effects of elevating concentrations of PAF to mimic PAF accumulation in PLA2G7-knockdown cells on phosphorylation levels of RAF1 in HMCB cell lysates. Histogram shows western blot quantification result of three independently repeated experiments (right).
The fold changes of the intensity ratios between phosphor-MEK and total MEK or phosphor-RAF1 and total RAF1 were indicated. The data are represented as mean ± SD (n=3). p values were obtained by a two-tailed Student’s t test (***p<0.001; **0.001 <p< 0.01; ns, not significant).
Also see Figure S4.
In addition, we found that PLA2G7 knockdown in melanoma HMCB and VMM39 cells expressing mutant NRAS resulted in decreased S338 phosphorylation, but not S259 phosphorylation levels of RAF1 proteins, along with consequently reduced phosphorylation levels of MEK and ERK (Figure 4B). S338 phosphorylation is crucial for RAF1 activation, and RAF1 S338A is a “kinase-dead” mutant (Barnard et al., 1998; Diaz et al., 1997). In contrast, although PLA2G7 knockdown similarly reduced S338 but not S259 phosphorylation levels of RAF1 in control A375 and A2058 cells expressing BRAF V600E, phosphorylation levels of MEK and ERK were not altered (Figure 4C). In addition, reduced S338 but not S259 phosphorylation levels of RAF1 were also detected in HMCB cells with sgRNA-mediated knockout of PLA2G7 (Figure S4B), and tumor lysates from xenografts derived from HMCB (Figure S4C) or A375 cells (Figure S4D) with stable knockdown of PLA2G7. Moreover, supplement with increasing concentrations of Lyso-PAF to “rescue” the reduced Lyso-PAF levels reversed the decreased S338 phosphorylation levels of RAF1 in lysates of HMCB cells with stable PLA2G7 knockdown (Figure 4D, upper), whereas elevating concentrations of PAF to mimic PAF accumulation in PLA2G7-knockdown cells did not significantly affect S338-phosphorylation levels of RAF1 in HMCB cell lysates (Figure 4D, lower).
Thus, these data together support our hypothesis that the PLA2G7-Lyso-PAF axis represents a common mechanism that is important for RAF1 and subsequent MEK activation, which, however, is dispensable for MEK activation in BRAF V600E-expressing cells because BRAF mutant bypasses RAF1 and activates MEK directly.
Lyso-PAF enhances PAK2 activation, which contributes to S338 phosphorylation and activation of RAF1.
It has been reported that the group I family members of p21-activated kinases (PAKs) can phosphorylate RAF1 at S338 (reviewed in (Molli et al., 2009; Rane and Minden, 2014; Ye and Field, 2012)). Since PAK3 protein level is almost undetectable in melanoma cells (Figure S5A), and was reported not involved in S338 phosphorylation of RAF1 (Chiloeches et al., 2001), we thus focused on whether PLA2G7 affects PAK1 and/or PAK2 for RAF1 S338 phosphorylation.
We found that the kinase activity of immunoprecipitated PAK1 from HMCB cells was not affected by PLA2G7 knockdown in an in vitro kinase assay using purified RAF1 as a substrate (Figure 5A, left), whereas PLA2G7 knockdown resulted in reduced kinase activity of immunoprecipitated PAK2 (Figure 5A, right). Moreover, we found that knockdown of either PAK1 or PLA2G7 resulted in reduced S338 phosphorylation levels of RAF1 to 69% or 68%, respectively, in HMCB cells, while simultaneous knockdown of both PAK1 and PLA2G7 led to an “add-on” effect on attenuation of S338 phosphorylation level of RAF1, which was further decreased to 38% (Figure 5B, left), suggesting that PLA2G7 contributes to RAF1 S338 phosphorylation through a PAK1-independent manner. In contrast, knockdown of either PAK2 or PLA2G7 also resulted in reduced S338 phosphorylation levels of RAF1 to 61% or 63%, respectively, in HMCB cells; however, simultaneous knockdown of both PAK2 and PLA2G7 did not further attenuate S338 phosphorylation levels of RAF1 (59%; Figure 5B, right), suggesting that PLA2G7 functions through regulation of PAK2-dependent S338 phosphorylation of RAF1. Moreover, knockdown of PLA2G7 on top of double knockdown of PAK1 and PAK2 did not further attenuate S338 phosphorylation level of RAF1 in HMCB cells (Figure S5B).
Figure 5. Lyso-PAF enhances PAK2 activation, which contributes to S338 phosphorylation and activation of RAF1.

(A) Kinase activity of immunoprecipitated PAK1 (upper left) and PAK2 (upper right) from HMCB cells with or without PLA2G7 knockdown were assessed by western blot in an in vitro kinase assay using recombinant, purified RAF1 as a substrate. Histogram shows western blot quantification result of three independently repeated experiments, respectively (lower).
(B) Effects of PLA2G7 knockdown and/or PAK1 knockdown (upper left) or PAK2 knockdown (upper right) on S338 phosphorylation levels of immunoprecipitated RAF1 from HMCB cells were assessed by western blot. Histogram shows western blot quantification result of three independently repeated experiments, respectively (lower).
(C) Effects of increasing concentrations of Lyso-PAF on the autokinase activity levels of purified, recombinant PAK2 in the presence of ATP in an in vitro kinase assay, were assessed by western blot to detect S141 and T402 autophosphorylation levels of PAK2 (left). Histogram shows western blot quantification result of three independently repeated experiments (right).
(D) Effects of increasing concentrations of Lyso-PAF (left two panels) or PAF (right two panels) on the trans-kinase activity levels of purified, recombinant PAK2 in the presence of ATP in an in vitro kinase assay using recombinant, purified RAF1 as a substrate, were assessed by western blot to detect S338 phosphorylation levels of RAF1. Histogram shows western blot quantification result of three independently repeated experiments.
The fold changes of the intensity ratios between phosphor-RAF1 and total RAF1 or phosphor-PAK2 and total PAK2 were indicated. The data are represented as mean ± SD (n=3). p values were obtained by a two-tailed Student’s t test (***p<0.001; **0.001 <p< 0.01; *0.01 <p< 0.05; ns, not significant).
These data together suggest that both PAK1 and PAK2 are required to act in concert to achieve full scale S338 phosphorylation, leading to maximal activation of RAF1, where PLA2G7 is required for PAK2-, but not PAK1-dependent S338 phosphorylation and activation of RAF1. Consistent with these findings, knockdown of either PAK1 or PAK2 resulted in decreased cell proliferation potential in NRAS mutant-expressing HMCB and VMM39 cells but not in control cells expressing BRAF V600E which bypasses RAF1 for MEK1 activation (Figure S5C).
Lyso-PAF binds to PAK2 and alters ATP kinetics.
CDC42 was reported to be able to activate PAK2 in vitro or in HEK293T or 3T3 cells when cooverexpressed with PAK2 (Huang et al., 2020; Jakobi et al., 1996; Jung and Traugh, 2005; Renkema et al., 2002). However, we found that knockdown of endogenous CDC42 in HMCB cells (Figure S5D), A375 cells (Figure S5E), or EGF-stimulated HEK293T cells with serum deprivation (Figure S5F) reduced only PAK1 but not PAK2 enzyme activity determined by incubating immunoprecipitated PAK1 or PAK2 with RAF1as a substrate in anin vitro kinase assay. These data suggested that under physiological conditions, CDC42 primarily regulates activation of PAK1, but not PAK2. Consistent with these findings, we found PAK2 slowly undergoes autophosphorylation (Figure S6A) or achieves trans-phosphorylation of RAF1 (Figure S6B) in a time-dependent manner in the presence of ATP but absence of cofactors. In contrast, increasing concentrations of Lyso-PAF enhanced the auto-kinase activity of PAK2 assessed by auto-phosphorylation levels at residues S141, T402 and S192/197 in an in vitro kinase assay using purified recombinant PAK2 in the presence of ATP (Figure 5C). Moreover, incubation with Lyso-PAF (Figure 5D, left), but PAF (Figure 5D, right), also resulted in enhanced trans-kinase activity of PAK2 in an in vitro kinase assay using purified recombinant PAK2 with purified RAF1 as a substrate. In contrast, Lyso-PAF changed neither the auto-kinase activity (Figure S6C, upper) nor the trans-kinase activity of PAK1 (Figure S6C, lower) in an in vitro kinase assay using purified PAK1 in the presence of ATP with or without purified RAF1 as a substrate, whereas incubation with a well-known PAK1 activator sphingosine (Molli et al., 2009; Ye and Field, 2012) resulted in PAK1 activation in the same kinase assay (Figure S6D).
We next sought to explore the underlying mechanism. We found that 3H-labeled Lyso-PAF bound to purified PAK2 directly, and such binding increased when PAK2 was pre-activated by ATP in a time-dependent manner (Figure 6A, left). Given that autophosphorylation of PAK2 increases in a time-dependent manner in the presence of ATP (Figure S6E), these data suggest that binding of Lyso-PAF correlates with auto-phosphorylation of PAK2. In contrast, 3H-labeled PAF bound to PAK2 was not affected by ATP pre-treatment (Figure 6A, right). In addition, incubation with increasing concentrations of Lyso-PAF (Figure 6B, left), but not PAF (Figure 6B, right) resulted in enhanced binding of [α-32P]-ATP to purified PAK2 that was pre-incubated with ATP for 2.5 hours in an in vitro binding assay. Consistent with these findings, further kinetics studies confirmed that, in the presence of increasing concentrations of ATP, incubation with Lyso-PAF resulted in increased Vmax value with decreased Km value for ATP in the presence or absence of RAF1 as a substrate (Figure 6C; left and right, respectively), suggesting that Lyso-PAF enhances PAK2 activation in the presence of ATP, likely by promoting ATP recruitment and turnover.
Figure 6. Lyso-PAF binds to PAK2 and alters ATP kinetics.
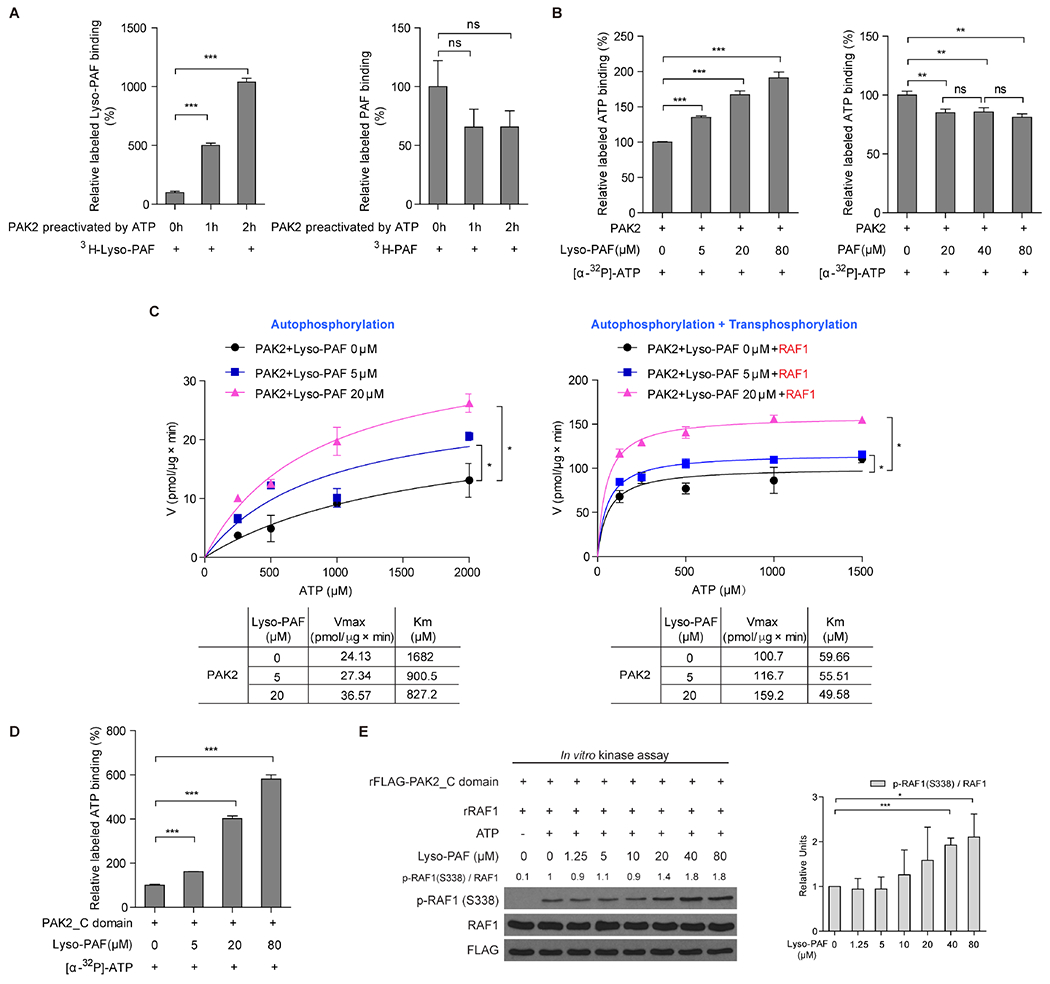
(A) Purified PAK2 proteins were pre-incubated with ATP for indicated 0, 1 or 2 hours, followed by incubation with 3H-labeled Lyso-PAF (left) or 3H-labeled PAF (right) in an in vitro binding assay. The amount of 3H-labeled Lyso-PAF or PAF bound to PAK2 proteins was assessed by liquid scintillation counting.
(B) Purified PAK2 protein was pre-incubated with ATP for 2.5 hours, followed by incubation with [α-32P]-ATP in the presence of increasing concentrations of Lyso-PAF (left) or PAF (right) in an in vitro binding assay. The amount of [α-32P]-ATP bound to PAK2 proteins was assessed by liquid scintillation counting.
(C) Vmax and Km of PAK2 autokinase activity were measured using purified PAK2 proteins that were incubated with increasing concentrations of Lyso-PAF, followed by an in vitro kinase assay in the presence of increasing concentrations of ATP (left). Vmax and Km of PAK2 autokinase activity plus trans-kinase were measured using purified PAK2 proteins that were incubated with substrate purified RAF1 and increasing concentrations of Lyso-PAF, followed by an in vitro kinase assay in the presence of increasing concentrations of ATP (right).
(D) Purified GST-rFLAG-PAK2_C domain containing the catalytic domain (aa 229-524) were incubated with [α-32P]-ATP in the presence of increasing concentrations of Lyso-PAF in an in vitro binding assay. The amount of [α-32P]-ATP bound to GST-rFLAG-PAK2_C domain proteins was assessed by liquid scintillation counting.
(E) Effects of increasing concentrations of Lyso-PAF on the trans-kinase activity levels of purified, recombinant His-rFLAG-PAK2_C domain in the presence of ATP in an in vitro kinase assay using purified RAF1 as a substrate, assessed by western blot to detect S 338 phosphorylation levels of RAF1(left). Histogram shows western blot quantification result of three independently repeated experiments (right).
The fold changes of the intensity ratios between phosphor-RAF1 and total RAF1 were indicated. The data are represented as mean ± SD (n=3). p values were obtained by a two-tailed Student’s t test except a two-way ANOVA test in Figure 6C (***p<0.001; **0.001 <p< 0.01; *0.01 <p< 0.05; ns, not significant).
Also see Figure S6.
Consistent with these findings, increasing concentrations of Lyso-PAF enhanced binding of [α-32P]-ATP to purified PAK2 C-terminal catalytic domain (aa 229-524; PAK2_C domain) in an in vitro binding assay (Figure 6D). In addition, incubation with Lyso-PAF resulted in enhanced trans-kinase activity of PAK2_C domain in an in vitro kinase assay using purified recombinant PAK2_C domain with either purified RAF1 as a physiological substrate (Figure 6E), or myelin basic protein (MBP) as a non-specific substrate (Figure S6F). Note that the purity of GST-PAK2, GST-rFLAG-PAK2_C domain, and His- rFLAG-PAK2_C domain was determined as >95% by western blot and Coomassie blue staining (Figure S6G). Thus, these data together suggest that Lyso-PAF binds to the exposed C-terminal catalytic domain of auto-phosphorylated PAK2, leading altered ATP kinetics to enhance auto-kinase and trans-kinase activities of PAK2.
The PLA2G7-PAK2 axis is required for full activation of RAF1 in cancer cells expressing mutant KRAS or normal cells stimulated by EGF.
We next examined whether the PLA2G7-PAK2 axis represents a common mechanism for RAF1 activation that is required by oncogenic mutants of other RAS family members, such as KRAS, or normal cells stimulated by growth factors for proliferation. We found that CRISPR/Cas9-mediated knockout of PLA2G7 by sgRNA selectively attenuated cell proliferation rates of KRAS mutant-expressing colorectal cancer HCT116 cells (Figure 7A, left), but not control colorectal cancer HT29 cells expressing BRAF V600E (Figure 7A, right). Similar results were obtained using cells with stable knockdown of PLA2G7 by shRNA (Figure S7A). Furthermore, we found that PLA2G7-deficieny induced by different approaches resulted in a significant decrease in the phosphorylation levels of MEK and ERK, but not AKT in mutant KRAS-expressing HCT116 cells, whereas PLA2G7-deciency did not affect phosphorylation levels of MEK, ERK or AKT in control HT29 cells expressing BRAF V600E (Figures 7B and S7B).
Figure 7. PLA2G7-PAK2 axis is required for full activation of RAF1 in cells stimulated by EGF or cancer cells expressing mutant KRAS.
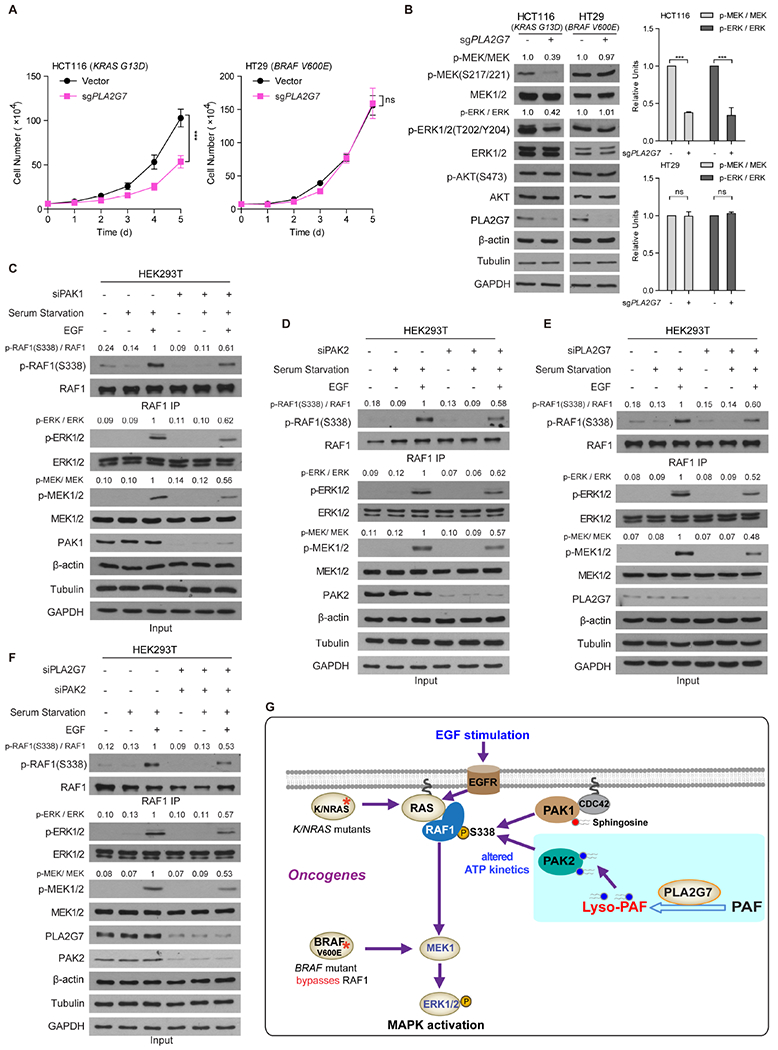
(A-B) Effects of stable knockout of endogenous PLA2G7by CRISPR/Cas9 using sgRNA on cell proliferation rates were examined in human colorectal cancer HCT116 cells expressing mutant KRAS or HT29 cells expressing BRAF V600E (A). Representative western blot results to detect phosphorylation and protein expression levels of MEK1/2, ERK1/2 and AKT are shown (B, left panels). Histogram shows western blot quantification result of three independently repeated experiments (B, right panels).
(C-F) Effects of siRNA-mediated knockdown of PAK1 (C), PAK2 (D), or PLA2G7 (E), or double knockdown of PAK2 and PLA2G7 (F) on S338 phosphorylation levels of immunoprecipitated RAF1 and phosphorylation levels of endogenous MEK1/2 and ERK1/2 in HEK293T cells treated with serum starvation followed by EGF stimulation were assessed by western blot.
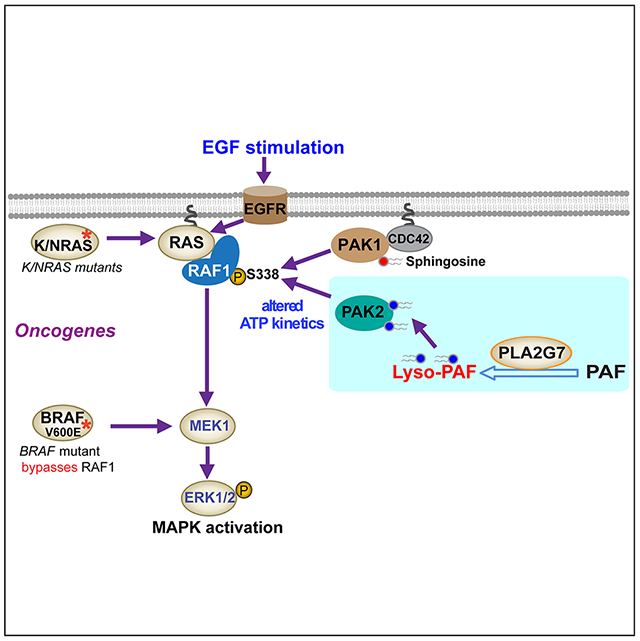
(G) Proposed working model.
The fold changes of the intensity ratios between phosphor-MEK and total MEK, phosphor-ERK and total ERK or phosphor-RAF1 and total RAF1 were indicated. The data are represented as mean ± SD (n=3). p values were obtained by a two-tailed Student’s t test except a two-way ANOVA test in Figure7A (***p<0.001; ns, not significant).
See also Figure S7.
Furthermore, we found that stimulation of HEK293T cells treated with serum starvation by EGF treatment resulted in increased S338 phosphorylation levels of RAF1 and subsequent phosphorylation levels of MEK and ERK (Figures 7C–7F, left three lanes), while individual knockdown of PAK1, PAK2, or PLA2G7 (Figures 7C–7E, right three lanes, respectively) attenuated EGF-stimulated phosphorylation of RAF1, MEK and ERK to comparable levels. Moreover, simultaneous knockdown of both PAK2 and PLA2G7 did not further attenuate EGF-stimulated S338-phosphorylation of RAF1 or phosphorylation of MEK and ERK (Figure 7F, right three lanes), which further support that PLA2G7 and PAK2 exist in the same signal pathway to regulate RAF1 activation. Statistical analysis of western blot results is shown (Figures S7C–S7F), while knockdown of PLA2G7 on top of double knockdown of PAK1 and PAK2 did not further attenuate S338 phosphorylation level of RAF1 in EGF-stimulated HEK293T cells (Figure S7G).
DISCUSSION
Our findings for the first time revealed a novel intracellular signaling function of PLA2G7, which has been widely recognized as an extracellular, lipoprotein-associated PLA2 in plasma to control PAF-dependent inflammatory response. In addition, our results elucidate that Lyso-PAF, a “functionless” and biological inactive phospholipid, functions as a signaling molecule that enhances PAK2 activation and consequently contributes to PAK2-dependent phosphorylation and activation of RAF1. These data together demonstrate that the PLA2G7-Lyso-PAF axis is a key element of RAS-RAF1 signaling that is commonly important in stimulated cells and cancer cells transformed by oncogenic mutants of RAS family members (Figure 7G).
Moreover, our findings also revealed that, in addition to the well-known PAK1-dependent S338 phosphorylation of RAF1(Baker et al., 2014), PAK2-dependent S338 phosphorylation, which requires the PLA2G7-Lyso-PAF axis, is crucial for full-scale activation of RAF1 and consequently essential for MEK-ERK pathway activation in normal cells stimulated by growth factors such as EGF and cancer cells expressing mutant NRAS or KRAS (Figure 7G). However, this mechanism is dispensable for MEK-ERK activation by oncogenic BRAF V600E mutant, which “bypasses” RAF1 and directly phosphorylates MEK1 (Figure 7G). Thus, these findings advance our understanding of the signaling mechanism underlying MEK-ERK pathway activation that is crucial for not only cell proliferation in normal cells stimulated by growth factors but also cancer cell transformation induced by oncogenes includingmutant NRAS or KRAS in human cancers.
PAK2 activation is associated with auto-phosphorylation at multiple sites including S141, S192, S197 and T402, which releases the auto-inhibitory domain from the catalytic domain (Chong et al., 2001). Given that purified PAK2 exhibits auto-kinase activity in a time-dependent manner in the presence of ATP (Figure S6A and S6E), and that binding of Lyso-PAF to PAK2 also increases when PAK2 is pre-activated by ATP in a time-dependent manner (Figure 6A), Lyso-PAF likely contributes to PAK2 kinase activation by directly binding to the exposed catalytic domain of auto-phosphorylated PAK2, and consequently enhances PAK2 kinase activation by altering ATP kinetics. Since pre-incubation with ATP should result in a fully occupied PAK2 catalytic site with non-radioactive ATP, an increase in the amount of [α-32P]-ATP binding to purified PAK2 and PAK2_C domain (Figures 6B and 6D, respectively) indicates that more of the non-radioactive-ATP at the catalytic site is being displaced by [α-32P]-ATP in the presence of Lyso-PAF, suggesting that Lyso-PAF activates PAK2 by promoting ATP recruitment and turnover. These data also suggest that PAK2 activation in the presence of ATP may not always require cofactors, which is different from PAK1 activation that requires cofactors such as CDC42/Rac1 or sphingosine in the presence of ATP (Figures S6C–S6D) (Molli et al., 2009; Ye and Field, 2012). Thus, our study suggests that a “two-step model” for PAK2 activation, where PAK2 initially undergoes slow autophosphorylation in the absence of cofactors. This “early” autophosphorylation of PAK2 is evidenced by that the kinetic curve shows non-linear lag at the onset of the reaction, which then becomes linear (Figure S6A). Consequently, such a basal level of PAK2 autophosphorylation (Step 1) promotes Lyso-PAF binding that consequently enhances ATP binding for further autophosphorylation to achieve a full-scale activation of PAK2 (Step 2).
Limitations of the Study
Future studies are warranted to elucidate the structural and molecular mechanisms underlying Lyso-PAF-enhanced PAK2 activation, determine subcellular localization of PLA2G7 and whether this correlates with the distribution of its substrate PAF and product Lyso-PAF, and decipher the mechanisms underlying differential ability to secret PLA2G7 between leukocytes and cancer cells. Targeting PLA2G7 may represent a therapeutic strategy in treatment of mutant NRAS or KRAS-expressing human cancers. However, targeting PLA2G7 may cause symptoms similar as plasma PAF-AH (PLA2G7)-deficiency, which occurs due to a missense mutation V279F of the mature enzyme protein that is found in more than 30% of Japanese population (Karasawa et al., 2003). Since plasma PAF levels are increased in patients with ischemic stroke (Satoh et al., 1992), therapy-induced PAF-AH deficiency may be a risk factor for stroke. These concerns warrant further detailed toxicity and pharmacokinetics studies to evaluate potential therapies targeting PLA2G7 in cancer treatment.
STAR+METHODS
RESOURCE AVAILABILITY
Lead contact
Further information and requests for resources and reagents should be directed to and will be fulfilled by Jing Chen (jingchen@medicine.bsd.uchicago.edu).
Materials availability
All reagents generated in this study are available from the Lead Contact with a completed Materials Transfer Agreement.
Data and code availability
Original western blot images have been deposited on Mendeley at https://data.mendeley.com/datasets/g6nfy3hnzf/draft?a=40ef7051-f2e5-4658-8f5b-ef7e008dcd3f and are publicly available as of the date of publication. The DOI is also listed in the key resources table.
This paper does not report original code.
Any additional information required to reanalyze the data reported in this paper is available from the lead contact upon request.
KEY RESOURCES TABLE
| REAGENT or RESOURCE | SOURCE | IDENTIFIER |
|---|---|---|
| Antibodies | ||
| Rabbit polyclonalanti-PAFAcetylhydrolase (human) antibody | Cayman Chemical | Cat#160603; Clone#N/A; RRID:AB_10077761. |
| Rabbit polyclonalanti-PAFAcetylhydrolase (human) antibody (used for IP) | SHANGHAI GENOMICS,INC. | Cat# N/A; Clone# N/A; RRID:N/A |
| Rabbit monoclonal anti-AKT1 antibody | Cell Signaling Technology | Cat#75692; Clone#D9R8K; RRID: AB_2716309. |
| Rabbit monoclonal anti-P-AKT (S473) antibody | Cell Signaling Technology | Cat#4060S; Clone#D9E; RRID: AB_2315049. |
| Rabbit monoclonal anti-P-MEK1/2 (S217/221) antibody | Cell Signaling Technology | Cat# 9154S; Clone# 41G9; RRID: AB_2138017. |
| Rabbit monoclonal anti-MEK1/2 antibody | Cell Signaling Technology | Cat# 8727S; Clone# D1A5; RRID: AB_10829473. |
| Rabbit polyclonal anti-p44/42 MAP kinase (phosphorylated ERK1/2) antibody | Cell Signaling Technology | Cat# 9101L; Clone# N/A; RRID: AB_331646. |
| Rabbit polyclonal anti-ERK1/2 antibody | Cell Signaling Technology | Cat# 9102S; Clone# N/A; RRID: AB_330744. |
| Mouse monoclonal anti-β-actin antibody | Sigma-Aldrich | Cat# A1978; Clone# AC-15; RRID: AB_476692. |
| Rabbit monoclonal anti-BRAFantibody | Cell Signaling Technology | Cat# 14814S; Clone# D9T6S; RRID:AB_2750887. |
| Rabbit monoclonal anti-RAF1 antibody | Cell Signaling Technology | Cat# 53745S; Clone# D4B3J; RRID:AB_2799444. |
| Rabbit polyclonal anti-Phospho-RAF1(Ser259) antibody | Cell Signaling Technology | Cat# 9421S; Clone# N/A; RRID: AB_330759. |
| Rabbit monoclonalanti-Phospho-RAF1 (Ser338) antibody | Cell Signaling Technology | Cat# 9427S; Clone# 56A6; RRID:AB_2067317. |
| Rabbit polyclonal anti-PAK1 antibody | Cell Signaling Technology | Cat# 2602S; Clone#N/A; RRID: AB_330222. |
| Rabbit polyclonal anti-PAK2 antibody | Cell Signaling Technology | Cat# 2608S; Clone# N/A; RRID:AB_2283388. |
| Rabbit polyclonal anti-PAK3 antibody | Cell Signaling Technology | Cat# 2609S; Clone#N/A; RRID:AB_2225298. |
| Mouse monoclonal anti-rabbit IgG (Conformation Specific) (HRP Conjugate) antibody | Cell Signaling Technology | Cat# 5127; Clone# L27A9; RRID:AB_10892860. |
| Rabbit polyclonal anti-Phospho-PAK1 (Thr423)/PAK2 (Thr402)antibody | Cell Signaling Technology | Cat# 2601; Clone# N/A; RRID:AB_330220. |
| Rabbit polyclonal anti-Phospho-PAK1 (Ser144)/PAK2 (Ser141) antibody | Cell Signaling Technology | Cat# 2606S; Clone# N/A; RRID:AB_2299279. |
| Rabbit polyclonal anti-Phospho-PAK1 (Ser199/204)/PAK2 (Ser192/197) antibody | Cell Signaling Technology | Cat# 2605S; Clone# N/A; RRID:AB_2160222. |
| Rabbit monoclonal anti-FLAG antibody | Cell Signaling Technology | Cat# 14793S; Clone# N/A; RRID: AB_2572291. |
| anti-FLAG(R) M2 Affinity Gel antibody | Sigma- Aldrich | Cat# A2220-5ML; Clone#N/A; RRID: AB_10063035. |
| Rabbit polyclonal Anti-Phospho-(Ser/Thr) Phe antibody | Abcam | Cat# ab17464; Clone# N/A; RRID: AB_443891. |
| Goat anti-Mouse IgG (H+L) Secondary Antibody, HRP | Thermo Fisher Scientific | Cat# 31430; Clone# N/A; RRID: AB_228307 |
| Goat anti-Rabbit IgG (H+L) Secondary Antibody, HRP | Thermo Fisher Scientific | Cat# 31460; Clone# N/A; RRID: AB_ 228341 |
| Rabbit monoclonal anti-CDC42 antibody | Cell Signaling Technology | Cat# 2466S; Clone# 11A11; RRID: AB_2078082. |
| Rabbit polyclonal anti-alpha-Tubulin antibody | Cell Signaling Technology | Cat# 2144S; Clone# N/A; RRID: AB_2210548 |
| Rabbit monoclonal anti-GAPDH antibody | Cell Signaling Technology | Cat# 2118S; Clone# 14C10; RRID: AB_561053 |
| Bacterial and Virus Strains | ||
| BL21(DE3) Chemically Competent Cells | Sigma-Aldrich | Cat# CMC0014 |
| DH10B Competent Cells | Thermo Fisher Scientific | Cat#EC0113 |
| One Shot™ ccdB Survival Cells | Thermo Fisher Scientific | Cat#11828029 |
| Biological Samples | ||
| N/A | ||
| Chemicals, Peptides, and Recombinant Proteins | ||
| Platelet-activating factor (PAF) | AVANTI | Cat# 840009C CAS: 65154-06-5 |
| Lyso-PAF | AVANTI | Cat# 840008C CAS: 52691-62-0 |
| D-Sphingosine | Sigma-Aldrich | Cat#S7049-CAS: 123-78-4 |
| Trypan Blue | Sigma-Aldrich | Cat# T8154-100ML |
| Adenosine 5’-triphosphate (ATP) disodium salt hydrate | Sigma-Aldrich | Cat# A1852 CAS: 34369-07-8 |
| POLYBRENE | American Bioanalytical | Cat#AB01643-00001 |
| Puromycin dihydrochloride | Sigma-Aldrich | Cat# P8833 CAS: 58-58-2 |
| Hygromycin B | emdmillipore | Cat# 400052 CAS: 31282-04-9 |
| [3H]-PAF | ARC | Cat#ART 0727-50 μ;Ci |
| [3H]-Lyso-PAF | ARC | Cat#ART 1741-250 uCi |
| [α-32P]-ATP | PerkinElmer | Cat#BLU003X250UC |
| Recombinant human PAK1 protein | Abcam | Cat#ab125805 |
| Recombinant human PLA2G7 protein | Sigma-Aldrich | Cat#SRP3136 |
| Myelin Basic Protein bovine | Sigma-Aldrich | Cat# M1891 |
| COMPLETE, EDTA-FREE, 20 TABLETS | Sigma-Aldrich | Cat#11873580001 |
| EDTA-free protease and phosphatase inhibitor Cocktail | Thermo Fisher Scientific | Cat# A32961 |
| L-GLUTATHIONE REDUCED | Sigma-Aldrich | Cat#G4251-10G |
| Critical Commercial Assays | ||
| TransIT®-LT1 Transfection Reagent | Mirus | Cat# MIR 2305 |
| PAF Acetylhydrolase Assay Kit | Cayman Chemical | Cat#760901 |
| Human PLA2G7 SimpleStep ELISAKit | Abcam | Cat#ab235643 |
| Lipofectamine® 3000 | Life Technologies | Cat#L3000015 |
| Lipofectamine® RNAiMAX Transfection Reagent | Life Technologies | Cat#13778030 |
| Phusion® High-Fidelity DNA Polymerase | New England Biolabs | Cat#M0530S |
| QIAquick Gel Extraction Kit | Qiagen | Cat# 28704 |
| QIAprep Spin Miniprep Kit | Qiagen | Cat#27106 |
| pENTER/D-TOPO CLONING KIT | Invitrogen | Cat#45-021-8 |
| Gateway™ LR Clonase™ II Enzyme Mix | Invitrogen | Cat#11791020 |
| AccuPrime™ Pfx DNA Polymerase | Invitrogen | Cat#12-344-024 |
| Protein G Sepharose® 4 Fast Flow | Sigma-Aldrich | Cat# GE17-0618-01 |
| Glutathione Sepharose® 4B | GE Healthcare, | Cat#17-0756-01 |
| ADP-Glo™ Kinase Assay Kit | Promega | Cat#V9101 |
| ProBond™ Resin | Life Technologies | Cat#460019 |
| Disposable PD-10 Desalting Columns | GE Healthcare | Cat#95017-001 (PK) |
| Pierce™ Rapid Gold BCA Protein Assay Kit | Thermo Fisher Scientific | Cat#A53225 |
| Coomassie Brilliant Blue R-250 Staining Solution | Bio-rad | Cat# 1610436 |
| Deposited Data | ||
| Original images were deposited to Mendeley data | This paper | https://data.mendeley.com/datasets/g6nfy3hnzf/draft?a=40ef7051-f2e5-4658-8f5b-ef7e008dcd3f |
| Experimental Models: Cell Lines | ||
| Human: HEK293T cells | ATCC | Cat# CRL-3216; RRID:CVCL_0063 |
| Human: A375 cells | ATCC | Cat# CRL-1619; RRID: CVCL_0132 |
| Human: A2058 cells | ATCC | Cat# CRL-11147; RRID: CVCL_1059 |
| Human: SK-MEL-5 cells | ATCC | Cat# HTB-70; RRID: CVCL_0527 |
| Human: WM266-4 cells | ROCKLAND IMMUNOCHEMICALS | Cat#WM266-4-01-0001; RRID: N/A |
| Human: SK-MEL-2 cells | ATCC | Cat# HTB-68; RRID: CVCL_0069 |
| Human: HMCB cells | ATCC | Cat# CRL-9607; RRID: CVCL_3317 |
| Human:VMM39 | ATCC | Cat# CRL-3230; RRID: CVCL_A739 |
| Human:VMM1cells | ATCC | Cat# CRL-3225; RRID: CVCL_A732 |
| Human:NRAS mutant-A375 Isogenic Cell Line | ATCC | Cat# CRL-1619IG-2; RRID: CVCL_JF22 |
| Human: PMWK cells | ATCC | Cat# CRL-2624; RRID: CVCL_A665 |
| Human: CHL-1 cells | ATCC | Cat# CRL-9446; RRID: CVCL_1122 |
| Human: Mel-ST cells | Kang et al., 2015 (KHB MC paper) | Cat# N/A; RRID: N/A |
| Human: WM1985 cells | ROCKLAND IMMUNOCHEMICALS | Cat# WM1985-01-0001; RRID: N/A |
| Human: WM164 cells | ROCKLAND IMMUNOCHEMICALS | Cat# WM164-01-0001; RRID: N/A |
| Human: WM2032 cells | ROCKLAND IMMUNOCHEMICALS | Cat# WM2032-01-0001; RRID: N/A |
| Human: HCT116 cells | ATCC | Cat# CCL-247; RRID:CVCL_0291 |
| Human: HT-29 cells | ATCC | Cat# HTB-38; RRID: CVCL_0320 |
| Experimental Models: Organisms/Strains | ||
| Mouse: Heterozygous Hsd:Athymic Nude-Foxn1nu/Foxn1+ | Envigo/Harlan | Cat# 069(nu)/070(nu/+) |
| Oligonucleotides | ||
| shRNA targeting PLA2G7 sequence #3: 5’-TCAGGACACTTTATTCTGCTA -3’ | This paper | N/A |
| shRNA targeting PLA2G7 sequence #4: 5’-CACCCTTTGGATCCCAAATAA -3’ | This paper | N/A |
| Control siRNA sequence: 5’-UUCUCCGAACGUGUCACGUdTdT-3’ | Qiagen | Cat# 1022076 |
| siRNA targeting PLA2G7 sequence #3: 5’- TCAGGACACTTTATTCTGCTA -3’ | Qiagen | Cat# SI00072191 |
| siRNA targeting PLA2G7 sequence #4: 5’- CACCCTTTGGATCCCAAATAA -3’ | Qiagen | Cat# SI00072198 |
| shRNA targeting BRAF sequence: 5’-GCTGGTTTCCAAACAGAGGAT-3’ | BROAD Institute/Open Biosystems | N/A |
| siRNA targeting PAK1 sequence: 5’-CAUCAAAUAUCACUAAGUC-3’ | Dharmacon | Cat# D-003521-03-0002 |
| siRNA targeting PAK2 sequence: 5’-AGAAGGAACUGAUCAUUAA-3’ | Dharmacon | Cat# D-003597-05-0002 |
| siRNA targeting CDC42 | Sigma-Aldrich | Cat#EHU117241 |
| Primer: PLA2G7, Forward: 5’-CACCATGGTGCCACCCAAATTGCATG-3’ | This paper | N/A |
| Primer: PLA2G7, Reverse:5’-TTACTTGTCATCGTCGTCCTTGTAGTCATTGTATTTCTCTATTCCTG-3’ | This paper | N/A |
| Primers: PLA2G7 S273A mutation, Forward: 5’-GCAGTAATTGGACATGCTTTTGGTGGAGCAAC-3’ | This paper | N/A |
| Primers: PLA2G7 S273A mutation, Reverse: 5’-GTTGCTCCACCAAAAGCATGTCCAATTACTGC -3’ | This paper | N/A |
| Primers: PAK2, Forward: 5’-CACCATGTCTGATAACGGAGAAC -3’ | This paper | N/A |
| Primers:PAK2, Reverse: 5’-TTACTTGTCATCGTCGTCCTTGTAGTCACGGTTACTCTTCATTGCTT -3’ | This paper | N/A |
| Primer: PAK2 Catalytic domain, Forward: 5’-CACCATGGAAGAGATTATGGAGAAATT -3’ | This paper | N/A |
| Recombinant DNA | ||
| pLKO.1 puro-shPLA2G7#3 | This paper | N/A |
| pLKO.1 puro-shPLA2G7#4 | This paper | N/A |
| LentiCRISPRv2-sgPLA2G7 | GenScript | Cat# SC1678 |
| pLKO.1 puro-shBRAF | This paper | N/A |
| pLKO.1 hygro-shPLA2G7#3 | This paper | N/A |
| pDEST27-FLAG-PLA2G7 (RNAi-resistant) | This paper | N/A |
| pDEST27-FLAG-PLA2G7-S273A (RNAi-resistant) | This paper | N/A |
| pLKO.1 hygro-FLAG-PLA2G7 | This paper | N/A |
| pDEST27-MEK-DD | Kang et al., 2015 (KHB MC paper) | N/A |
| pDEST27-BRAF-V600E | Kang et al., 2015 (KHB MC paper) | N/A |
| pET60-FLAG-PAK2 | This paper | N/A |
| pET60-FLAG-PAK2 Catalytic domain | This paper | N/A |
| pET53-FLAG-PAK2 Catalytic domain | This paper | N/A |
| pDONR223-PAK2 | pDONR223-PAK2 was a gift from William Hahn & David Root. | Addgene plasmid: # 23655; RRID:Addgene_23655 |
| pDONR223-RAF1 | pDONR223-RAF1 was a gift from William Hahn & David Root. | Addgene plasmid: # 23832; RRID:Addgene_23832 |
| pET60-RAF1 | This paper | N/A |
| pET53-MEK | Kang et al., 2015 (KHB MC paper) | N/A |
| Software and Algorithms | ||
| Human pLKO.1 the RNAi consortium (TRC) Library | BROAD Institute/ Open Biosystems | https://www.broadinstitute.org/rnai-consortium/rnai-consortium-shrna-library |
| GraphPad Prism 5 software | GraphPad Software | https://www.graphpad.com/; RRID:SCR_002798 |
| ImageJ | https://imagej.nih.gov/ij/ | RRID:SCR_003070 |
EXPERIMENTAL MODEL AND SUBJECT DETAILS
Animal study
Animal experiments were conducted and designed according to protocols approved by the Institutional Animal Care and Use Committee of Emory University. Nude mice (athymic nu/nu, female 4-6weeks old, Harlan Laboratories) were used for xenograft studies.
Cell lines
HEK293T, Mel-ST, CHL,PMWK,HMCB, SK-MEL-2,A375, A2058, SK-MEL-5,WM1985, WM164, WM2032, WM266-4, and NRAS (Q61K)mutant-A375 isogenic cells were cultured in Dulbecco Modified Eagle Medium (DMEM) with10% fetal bovine serum (FBS) (Sigma,F2442) and penicillin/streptomycin. VMM39 and VMM1 cells were cultured in RPMI 1640 medium with 10% FBS and penicillin/streptomycin. HCT116 and HT29 cells were cultured in McCoy’s 5a medium with 10% FBS and penicillin/streptomycin. All the cells were cultured at 37°C and 5% CO2. Please also refer to KEY RESOURCES TABLE for detailed information of each cell line. Cell lines experiments were conducted and designed according to protocols approved by Institutional Biosafety Committee (IBC) of Emory University and the University of Chicago.
METHOD DETAILS
siRNA Transfection and RNA Interference
For RNA interference experiments, targeted siRNA and control siRNA were transfected using Lipofectamine®RNAiMAX Transfection Reagent according to the manufacturer’s instructions. For cell proliferation assay, cells were seeded 12 hours after transfection and counted for 4 days. For western blot experiments, cells were harvested 72 hours after transfection. Please also refer to KEY RESOURCES TABLE for more details.
Construction of stable knockdown cell lines
Lentivirus carrying targeted shRNA or vector shRNA was generated to construct stable knockdown cell lines. Briefly, lentiviral vector plasmid harboring shRNA, psPAX2 packaging plasmid, and pMD2.G envelope plasmid (Addgene) were co-transfected into HEK293T cells with TransIT®-LT1 Transfection Reagent (Mirus Bio) according to the manufacturer’s instructions. After 18 hours, the culture media was changed with virus harvest media (DMEM with 10% FBS plus 1%BSA).Harvest media containing lentivirus was collected 48 hours later and used for target cells infection. After infection for 24 hours, cells were selected with 2 μg/mL puromycin to obtain stable knockdown cell lines. Knockdown efficiency was checked using western blot. To generate stably concurrent knockdown of BRAF and PLA2G7 in NRAS (Q61K) mutant-A375 isogenic cells, pLKO.1 puro-shBRAF and pLKO.1 hygro-shPLA2G7 lentivirus were produced using HEK293T cells as described. First, NRAS (Q61K) mutant-A375 isogenic cells were infected with pLKO.1 puro-shBRAF or pLKO.1 puro-vector lentivirus, followed by selection with 2 μg/mL puromycin to obtain stable knockdown cell lines. NRAS (Q61K) mutant-A375 isogenic cells with stable knockdown of BRAF were then infected with pLKO.1 hygro-shPLA2G7 or pLKO.1 hygro-vector lentivirus, followed by selection with 100 μg/mL hygromycin to obtain BRAF and PLA2G7 double knockdown cell line. Please also refer to KEY RESOURCES TABLE for more details.
knockout cell lines construction with CRISPR
PLA2G7 sgRNA (GenScript) or lentiCRISPRv2 vector, psPAX2 packaging plasmid, and pMD2.G envelope plasmid (Addgene) were co-transfected into HEK293T cells using TransIT®-LT1 Transfection Reagent to produce lentivirus. Virus harvest media was changed 18 hours after transfection and then collected 48 hours later. Target cells were infected with lentivirus-containing harvest media for 24 hours and then selected with 2 μg/mL puromycin to obtain stable knockout cell lines. Depletion efficiency was tested using western blot. Please also refer to KEY RESOURCES TABLE for more details.
Transient transfection
pDEST27-FLAG-PLA2G7, pDEST27-FLAG-PLA2G7-S273A, pDEST27-MEK-DD, or pDEST27-BRAF-V600Ewas transfected into HMCB cells using Lipofectamine® 3000according to the manufacturer’s instructions. Cells were seeded for cell proliferation assay 18 hours after transfection and counted at indicated time. For western blot experiments, cells were harvested 72 hours after transfection. Please also refer to KEY RESOURCES TABLE for more details.
Cell proliferation assay
Cell proliferation assays were conducted by seeding 4-8×10⁴ cells in a 6-well plate. Cell numbers were recorded daily within 5 days using TC20 Automated Cell Counter (BioRad).
Secreted media collection and treatment
8×;104 HMCB (NBAS Q61K) parental cells were seeded in 6-well plate with 2mL fresh DMEM media with 10% FBS and penicillin/streptomycin. Since day 2, the media was collected daily as “secreted media” and changed with another 2 mL fresh media. On day 2, 8ϗ104 HMCB cells with or without transient or stable knockdown of endogenous PLA2G7 were seeded in 6-well plate with daily treatment of control fresh media (Ctrl media) or “secreted media” collected day by day, and subjected to cell proliferation assay for indicated time.
PLA2G7 secretion and cell culture treatment
Around 8×10⁵ melanoma cells (parental cells or knockdown cells) were cultured in 6-well plate with 1 mL fresh DMEM media with 10% FBS and penicillin/streptomycin for 24 hours. The cell culture supernatants were centrifuged at 2000×g for 10 min to remove debris. The adherent cells were washed twice with PBS and once with cold buffer (0.1M Tris-HCl, PH 7.2) and harvested using a rubber policeman in 0.5 mL cold buffer (0.1M Tris-HCl, PH 7.2). The cell pellets were sonicated using Misonix S-4000 ultrasonic liquid processors for 2 cycles (5s ON and 5s OFF, output power 19), centrifuged at 1000×g for 10 min at 4°C to obtain the supernatant for assay. PLA2G7 protein level in the cell culture media and inside cells were detected by Human PLA2G7 SimpleStep ELISA Kit according to the manufacturer’s instructions. 4×10⁴ HMCB cells with or without transient or stable knockdown of endogenous PLA2G7 were seeded in 6-well plate, treated with indicated amount of PLA2G7 proteins (Sigma, SRP3136) on day 2, and then subjected to cell proliferation assay for indicated time. Please also refer to KEY RESOURCES TABLE for more details.
Immunoprecipitation
Cell or tumor lysates containing about 2 mg total protein were incubated with primary antibody overnight at 4 °C and then incubated with Protein G Sepharose 4 Fast Flow beads for 2 hours. The protein bound to beads were washed with 1×TBS for 3 times and then used for next step analysis.
Xenograft studies
Nude mice were subcutaneously injected with 1×10⁶ melanoma cells on the flanks. Tumor growth was measured starting from 8-10 days after inoculation by measurement of two perpendicular diameters. The tumor volume was calculated using the formula 4π/3 × (width/2)2 × (length/2). The tumors were harvested and weighed at the experimental endpoint.
Intracellular PAF and Lyso-PAF Measurement
Intracellular concentrations of PAF and Lyso-PAF were measured by quantitative 31P nuclear magnetic resonance (NMR) spectroscopy using a Bruker Ascend™ 600 spectrometer equipped with CryoProbeProdigy™. For sample preparation, the indicated cells were harvested at about 80% confluence, washed with ice-cold normal saline solution, pelleted to record the packed cell volume, and then suspended in 300 μL cooled 80% (vol/vol) deuterated methanol. Deuterated chloroform (300 μL) was then added to the cell lysate in d-methanol together with the additions of H3PO4 (at final concentration of 0.15 mM) as internal standards for 31P. 31P-NMR spectra were acquired with 1H decoupling and delay time (d1) set to 10 seconds for 4096 number of scans. Peak assignment was determined by titration of standard compounds. Concentrations of metabolites were quantified based on the peak integrations of metabolites and internal standards.
PLA2G7 activity assay
PLA2G7-WT and PLA2G7-S273A were expressed in HEK293T cells, immunoprecipitated, and then subjected to activity assay using PAF Acetylhydrolase Assay Kit (Cayman Chemical) according to the manufacturer’s instructions. PLA2G7 activity was normalized to immunoprecipitated PLA2G7 protein level detected by western blot.
Cell-free system assays
Cell free assays were performed as previously described (Lin et al., 2015). Briefly, the indicated cells were harvested at about 80% confluence by normal trypsin digestion, washed with ice-cold PBS twice, pelleted by centrifugation at 300×g for 10 min at 4°C, and suspended in a volume of PBS (with EDTA-free protease and phosphatase inhibitor Cocktail (Thermo Fisher Scientific, Cat #A32961)) equivalent to 3 times the packed cell pellet volume, followed by sonication using Misonix S-4000 ultrasonic liquid processors for 3 cycles(5s ON and 5s OFF, output power 4). The cell-free lysates were added to different concentrations of PAF or Lyso-PAF to reach the final indicated concentrations and then incubated for 40min at 37°C metal bath with gentle shaking. After incubation, the cell-free lysates were added SDS buffer and boiled for western blot analysis of MEK/ERK phosphorylation. To check RAF1 phosphorylation, following the incubation with different concentrations of PAF or Lyso-PAF as described above, the cell-free lysates was further lysed with 0.5% NP40 (150mM NaCl, 10mM HEPES, 5mM NaPyrophosphate, 5mM NaF, 2mM NaOrthovanadate) with protein inhibitor cocktails (Sigma-Aldrich, Cat#11873580001) for 20 min at 4°C and then subjected to immunoprecipitation with RAF1 primary antibody for 4 hours at 4°C, followed by incubation of Protein G beads for 2 hours at 4°C. RAF1 bound to beads was washed with TBS for 3 times, added SDS buffer, and boiled for western blot analysis of RAF1 phosphorylation.
Plasmid construction and protein purification
pDONR223-RAF1 was subjected to LR reaction mediated by LR Clonase™ II enzyme mix (Invitrogen) to generated pET60-RAF1. For PAK2, full-length and truncated catalytic domain sequences (aa 229-524) containing a carboxyl-terminal FLAG tag were obtained by PCR using pDONR223-PAK2 as templates, respectively, and then cloned into pENTR-D-TOPO vector (Invitrogen) to generate pENTR-FLAG-PAK2 and pENTR-FLAG-PAK2_C domain to manufacturer’s instructions. pENTR-FLAG-PAK2 and pENTR-FLAG-PAK2_C domain were subjected to LR reaction mediated by LR Clonase™ II enzyme mix (Invitrogen) to generated pET60-FLAG-PAK2, pET53-FLAG-PAK2_C domain, and pET60-FLAG-PAK2_C domain constructs. To purify proteins, pET53 and pET60 constructs were transformed into BL21(DE3) Chemically Competent E. coli. The bacteria were inoculated into 250 mL LB medium, incubated at 37°C until OD600 reaches to around 0.6-0.9, and then induced by 0.5 mM IPTG for 18 hours at 18°C. Bacteria cells with pET53 constructs were centrifugated, sonicated, and loaded onto a Ni-NTA column. The proteins bound to beads were washed, eluted, and then desalted using a PD-10 column (GE). Bacteria cells with pET60 constructs were centrifugated, sonicated, and pulled down with GST beads. The proteins bound to GST beads were washed, eluted with 10 mM reduced glutathione buffer (in 50 mM Tris-HCl [pH 8.0]). Further purification through Amicon Ultra tubes with cutoff filter (Millipore) and AKTA pure protein purification system may be applied according to the protein purity, which was determined by western blot and Coomassie blue staining. Please also refer to KEY RESOURCES TABLE for more details.
In vitro kinase assays
RAF1 was immunoprecipitated from indicated cells and subjected to in vitro kinase assay with kinase buffer (20 mM Tris-HCl [pH 7.4], 20 mM NaCl, 10 mM MgCl2, 1mM DTT, 100μM ATP) at 30°C for 30 min, using recombinant MEK as substrate. The mixture was boiled with SDS buffer for western blot analysis of MEK phosphorylation. RAF1 activity was indicated by MEK phosphorylation level.
PAK1autokinase activity assay was carried out in kinase buffer (50 mM HEPES [pH 7.4], 10 mM MgCl2, 2 mM MnCl2, 0.2 mM DTT, 500μM ATP, 1.5μg PAK1) at 30°C for 2 hours, in the presence of indicated concentrations of Sphingosine or Lyso-PAF. Sphingosine were prepared as dimethyl sulfoxide (DMSO) stock and added as a complex with bovine serum albumin (final concentration of 0.2 mg/mL). The reaction mixture was boiled with SDS buffer for western blot analysis of PAK1 phosphorylation levels. To analyze the trans-kinase activity, 500 ng purified PAK1 or immunoprecipitated PAK1 from indicated cells were subjected to activity assay in kinase buffer (50 mM HEPES [pH 7.4], 10 mM MgCl2, 2 mM MnCl2, 0.2 mM DTT, 500μM ATP) at 30°C for 1 hour, using recombinant RAF1 as substrate. The mixture was boiled with SDS buffer for western blot analysis of RAF1 phosphorylation levels.
PAK2 autokinase activity was assayed in kinase buffer containing 1.5 μg PAK2, 50 mM HEPES [pH 7.4], 10 mM MgCl2, 2 mM MnCl2, 0.2 mM DTT, and 500 μM ATP at 30°C for 2 hours, in the presence of indicated concentrations of PAF or Lyso-PAF. The mixture was boiled with SDS buffer for western blot analysis of PAK2 phosphorylation levels. To analyze the trans-kinase activity, 500 ng purified PAK2 or immunoprecipitated PAK2 from indicated cells were subjected to activity assay in kinase buffer at 30°C for 1 hour, using recombinant RAF1 as substrate. The mixture was boiled with SDS buffer for western blot analysis of RAF1 phosphorylation levels.
His-rFLAG-PAK2_C domain trans-kinase activity was assayed in kinase buffer containing 1μg His-rFLAG-PAK2_C domain, 50 mM HEPES [pH 7.4], 10 mM MgCl2, 2 mM MnCl2, 0.2 mM DTT, and 500 μM ATP at 30°C for 15 min, in the presence of indicated concentrations of Lyso-PAF, using recombinant RAF1 or Myelin Basic Protein (MBP) as substrates. The mixture was boiled with SDS buffer for western blot analysis of RAF1 or MBP phosphorylation levels.
Radiometric metabolite-protein binding assay
GST tagged PAK2 were incubated with GST-beads at 4°C for 2 hours, subjected to in vitro kinase reaction in buffer containing 50 mM HEPES [pH 7.4], 10 mM MgCl2, 2 mM MnCl2, 0.2 mM DTT, and 500μM ATP at 30°C for indicated time, and then washed with TBS buffer. PAK2 bound to GST beads and GST beads control were incubated with 3H-Labeled PAF or 3H-Labeled Lyso-PAF in TBS buffer at room temperature for 30 min, washed thoroughly with TBS buffer for 4 times, eluted with 10 mM reduced glutathione buffer, and then subjected to radioactivity assay by scintillation counting.
For labeled ATP binding assay, GST tagged PAK2 were incubated with GST-beads at 4°C for 2 hours, subjected to in vitro kinase reaction in buffer containing 50 mM HEPES [pH 7.4], 10 mM MgCl2, 2 mM MnCl2, 0.2 mM DTT, and 500μM ATP at 30°C for 2.5 hours, and then washed with TBS buffer. The pre-activated PAK2 bound to GST beads were incubated with indicated concentration of PAF or lyso-PAF in buffer containing 50 mM HEPES [pH 7.4], 10 mM MgCl2, 2 mM MnCl2, 0.2 mM DTT for 45min at 30°C, followed by adding pre-cold 1uCi α-32P-ATP plus 500μM ATP per sample for 15min at 25°C.PAK2 bound to GST Beads or beads only control was washed thoroughly with TBS buffer for 4 times, eluted with 10 mM reduced glutathione buffer, and then subjected to radioactivity assay by scintillation counting.
For labeled ATP binding with GST-rFLAG-PAK2_C domain, GST-rFLAG-PAK2_C domain were pre-incubated with GST-beads at 4°C for 2 hours, washed with TBS buffer, and then incubated with indicated concentration of lyso-PAF in buffer containing 50 mM HEPES [pH 7.4], 10 mM MgCl2, 2 mM MnCl2, 0.2 mM DTT for 45min at 30°C, followed by adding pre-cold 1uCi α-32P-ATP plus 500μM ATP per sample for 15min at 25°C.GST-rFLAG-PAK2_C domain bound to GST Beads or beads only control were washed thoroughly with TBS buffer for 4 times, eluted with 10 mM reduced glutathione buffer, and then subjected to radioactivity assay by scintillation counting.
Kinetic assay
100ng purified PAK2 protein was incubated with various concentrations of ATP (0-2mM) in 120 μl kinase buffer (50 mM HEPES [pH 7.4], 10 mM MgCl2, 2 mM MnCl2, 0.2 mM DTT, with or without substrate recombinant RAF1) with indicated concentration of lyso-PAF at 30°C for 1 hour (with RAF1) or 2hours (without RAF1). The mixture was subjected to ADP production analysis with ADP-Glo™ Kinase Assay Kit according to the manufacturer’s instructions. Please also refer to KEY RESOURCES TABLE for more details.
QUANTIFICATION AND STATISTICAL ANALYSIS
The quantification for western blots was carried out by subtracting background from the band intensity using software ImageJ (ImageJ, RRID: SCR 003070). A two-tailed Student’s t test was subjected to data statistical analysis, except a one-way ANOVA test for Figure 3A and a two-way ANOVA test for cell proliferation assay and tumor growth analysis were performed. p values less than 0.05 were considered significant. The data are represented as mean ±SD, except for tumor growth curves which are represented mean ± SEM. Statistical analysis and graphical presentation was performed using Prism 5.0 (GraphPad). Detailed information about statistical analysis is provided in figure legends for respective figures.
TCGA data analysis
NRAS mutational status data and PLA2G7 mRNA expression z-scores (RNA Seq V2 RSEM) in 435 TCGA Skin Cutaneous Melanoma samples were downloaded from cBioportal (https://www.cbioportal.org/). The melanoma samples were clustered according to NRAS mutation status, followed by analysis of PLA2G7 gene mRNA expression level using Prism 5.0 (GraphPad).
Data Analysis of RNAi Screens results
To identify “metabolic vulnerabilities” specific to oncogenic NRAS mutant, but not other oncogenes such as BRAF V600E mutant in human melanomas, we re-analyze our previous RNAi screen results obtained by a systematic RNAi screen with shRNA library targeting metabolism-related proteins in the human genome(Kang et al., 2015). Two RIGER methods (RIGER KS and RIGER SB) and another method, Gene Set Analysis R package were used to analyze the normalized B scores for two mutant NRAS harboring melanoma cell lines including HMCB (NRAS Q61K) and SK-MEL-2 (NRAS Q61R), as well as control NRAS WT-expressing melanoma cells including PMWK, CHL-1,WM2664 (BRAF V600D) and A375 (BRAF V600E). Please also refer to Table S1 for information of overlapped 33 genes by three methods, which were enriched as top candidate synthetic lethal partners of mutant NRAS.
Supplementary Material
Highlights.
PLA2G7 and its biologically inactive product Lyso-PAF show intracellular function
Lyso-PAF binds to and activates PAK2
Lyso-PAF-PAK2 axis contributes to RAS-RAF1 activation
Lyso-PAF-mediated RAF1 activation is bypassed by BRAF V600E
ACKNOWLEDGMENTS
This work was supported in part by NIH grants including CA140515, CA183594, CA174786 (J.C.). J.C. is the Janet Davison Rowley Distinguished Service Professor in Cancer Research.
Footnotes
Publisher's Disclaimer: This is a PDF file of an unedited manuscript that has been accepted for publication. As a service to our customers we are providing this early version of the manuscript. The manuscript will undergo copyediting, typesetting, and review of the resulting proof before it is published in its final form. Please note that during the production process errors may be discovered which could affect the content, and all legal disclaimers that apply to the journal pertain.
SUPPLEMENTAL INFORMATION
Supplemental information includes seven figures and one table.
DECLARATION OF INTERESTS
The authors declare no competing interests.
REFERENCES
- Arai H, Koizumi H, Aoki J, and Inoue K (2002). Platelet-activating factor acetylhydrolase (PAF-AH). J Biochem 131, 635–640. [DOI] [PubMed] [Google Scholar]
- Baker NM, Yee Chow H, Chemoff J, and Der CJ (2014). Molecular pathways: targeting RAC-p21-activated serine-threonine kinase signaling in RAS-driven cancers. Clin Cancer Res 20, 4740–4746. [DOI] [PMC free article] [PubMed] [Google Scholar]
- Barnard D, Diaz B, Clawson D, and Marshall M (1998). Oncogenes, growth factors and phorbol esters regulate Raf-1 through common mechanisms. Oncogene 17, 1539–1547. [DOI] [PubMed] [Google Scholar]
- Bollag G, Tsai J, Zhang J, Zhang C, Ibrahim P, Nolop K, and Hirth P (2012). Vemurafenib: the first drug approved for BRAF-mutant cancer. Nature reviews Drug discovery 11, 873–886. [DOI] [PubMed] [Google Scholar]
- Chiloeches A, Mason CS, and Marais R (2001). S338 phosphorylation of Raf-1 is independent of phosphatidylinositol 3-kinase and Pak3. Mol Cell Biol 21, 2423–2434. [DOI] [PMC free article] [PubMed] [Google Scholar]
- Chong C, Tan L, Lim L, and Manser E (2001). The mechanism of PAK activation. Autophosphorylation events in both regulatory and kinase domains control activity. J Biol Chem 276, 17347–17353. [DOI] [PubMed] [Google Scholar]
- Diaz B, Barnard D, Filson A, MacDonald S, King A, and Marshall M (1997). Phosphorylation of Raf-1 serine 338-serine 339 is an essential regulatory event for Ras-dependent activation and biological signaling. Mol Cell Biol 17, 4509–4516. [DOI] [PMC free article] [PubMed] [Google Scholar]
- Gibney GT, Messina JL, Fedorenko IV, Sondak VK, and Smalley KS (2013). Paradoxical oncogenesis--the long-term effects of BRAF inhibition in melanoma. Nat Rev Clin Oncol 10, 390–399. [DOI] [PMC free article] [PubMed] [Google Scholar]
- Huang J, Huang A, Poplawski A, DiPino F Jr., Traugh JA, and Ling J (2020). PAK2 activated by Cdc42 and caspase 3 mediates different cellular responses to oxidative stress-induced apoptosis. Biochim Biophys Acta Mol Cell Res 1867, 118645. [DOI] [PubMed] [Google Scholar]
- Jakobi R, Chen CJ, Tuazon PT, and Traugh JA (1996). Molecular cloning and sequencing of the cytostatic G protein-activated protein kinase PAK I. J Biol Chem 271, 6206–6211. [DOI] [PubMed] [Google Scholar]
- Johnson DB, and Sosman JA (2013). Update on the targeted therapy of melanoma. Current treatment options in oncology 14, 280–292. [DOI] [PMC free article] [PubMed] [Google Scholar]
- Jung JH, and Traugh JA (2005). Regulation of the interaction of Pak2 with Cdc42 via autophosphorylation of serine 141. J Biol Chem 280, 40025–40031. [DOI] [PubMed] [Google Scholar]
- Kang HB, Fan J, Lin R, Elf S, Ji Q, Zhao L, Jin L, Seo JH, Shan C, Arbiser JL, et al. (2015). Metabolic Rewiring by Oncogenic BRAF V600E Links Ketogenesis Pathway to BRAF-MEK1 Signaling. Molecular cell 59, 345–358. [DOI] [PMC free article] [PubMed] [Google Scholar]
- Karasawa K, Harada A, Satoh N, Inoue K, and Setaka M (2003). Plasma platelet activating factor-acetylhydrolase (PAF-AH). Prog Lipid Res 42, 93–114. [DOI] [PubMed] [Google Scholar]
- Lin R, Elf S, Shan C, Kang HB, Ji Q, Zhou L, Hitosugi T, Zhang L, Zhang S, Seo JH, et al. (2015). 6-Phosphogluconate dehydrogenase links oxidative PPP, lipogenesis and tumour growth by inhibiting LKB1-AMPK signalling. Nature Cell Biology 17, 1484–1496. [DOI] [PMC free article] [PubMed] [Google Scholar]
- Lin R, Xia S, Shan C, Chen D, Liu Y, Gao X, Wang M, Kang HB, Pan Y, Liu S, et al. (2018). The Dietary Supplement Chondroitin-4-Sulfate Exhibits Oncogene-Specific Pro-tumor Effects on BRAF V600E Melanoma Cells. Mol Cell 69, 923–937 e928. [DOI] [PMC free article] [PubMed] [Google Scholar]
- McIntyre TM, Prescott SM, and Stafforini DM (2009). The emerging roles of PAF acetylhydrolase. J Lipid Res 50 Suppl, S255–259. [DOI] [PMC free article] [PubMed] [Google Scholar]
- Molli PR, Li DQ, Murray BW, Rayala SK, and Kumar R (2009). PAK signaling in oncogenesis. Oncogene 28, 2545–2555. [DOI] [PMC free article] [PubMed] [Google Scholar]
- Munoz-Couselo E, Adelantado EZ, Ortiz C, Garcia JS, and Perez-Garcia J (2017). NRAS-mutant melanoma: current challenges and future prospect. Onco Targets Ther 10, 3941–3947. [DOI] [PMC free article] [PubMed] [Google Scholar]
- Nagano JM, Hsu KL, Whitby LR, Niphakis MJ, Speers AE, Brown SJ, Spicer T, Fernandez-Vega V, Ferguson J, Hodder P, et al. (2013). Selective inhibitors and tailored activity probes for lipoprotein-associated phospholipase A(2). Bioorg Med Chem Lett 23, 839–843. [DOI] [PMC free article] [PubMed] [Google Scholar]
- Peng Z, Chang Y, Fan J, Ji W, and Su C (2021). Phospholipase A2 superfamily in cancer. Cancer Lett 497, 165–177. [DOI] [PubMed] [Google Scholar]
- Rane CK, and Minden A (2014). P21 activated kinases: structure, regulation, and functions. Small GTPases 5. [DOI] [PMC free article] [PubMed] [Google Scholar]
- Renkema GH, Pulkkinen K, and Saksela K (2002). Cdc42/Rac1-mediated activation primes PAK2 for superactivation by tyrosine phosphorylation. Mol Cell Biol 22, 6719–6725. [DOI] [PMC free article] [PubMed] [Google Scholar]
- Satoh K, Imaizumi T, Yoshida H, Hiramoto M, and Takamatsu S (1992). Increased levels of blood platelet-activating factor (PAF) and PAF-like lipids in patients with ischemic stroke. Acta Neurol Scand 85, 122–127. [DOI] [PubMed] [Google Scholar]
- Stafforini DM (2015). Diverse Functions of Plasma PAF-AH in Tumorigenesis. Enzymes 38, 157–179. [DOI] [PubMed] [Google Scholar]
- Vainio P, Gupta S, Ketola K, Mirtti T, Mpindi JP, Kohonen P, Fey V, Perala M, Smit F, Verhaegh G, et al. (2011). Arachidonic acid pathway members PLA2G7, HPGD, EPHX2, and CYP4F8 identified as putative novel therapeutic targets in prostate cancer. Am J Pathol 178, 525–536. [DOI] [PMC free article] [PubMed] [Google Scholar]
- Vittos O, Toana B, Vittos A, and Moldoveanu E (2012). Lipoprotein-associated phospholipase A2 (Lp-PLA2): a review of its role and significance as a cardiovascular biomarker. Biomarkers 17, 289–302. [DOI] [PubMed] [Google Scholar]
- Xia S, Lin R, Jin L, Zhao L, Kang HB, Pan Y, Liu S, Qian G, Qian Z, Konstantakou E, et al. (2017). Prevention of Dietary-Fat-Fueled Ketogenesis Attenuates BRAF V600E Tumor Growth. Cell metabolism 25, 358–373. [DOI] [PMC free article] [PubMed] [Google Scholar]
- Ye DZ, and Field J (2012). PAK signaling in cancer. Cell Logist 2, 105–116. [DOI] [PMC free article] [PubMed] [Google Scholar]
Associated Data
This section collects any data citations, data availability statements, or supplementary materials included in this article.
Supplementary Materials
Data Availability Statement
Original western blot images have been deposited on Mendeley at https://data.mendeley.com/datasets/g6nfy3hnzf/draft?a=40ef7051-f2e5-4658-8f5b-ef7e008dcd3f and are publicly available as of the date of publication. The DOI is also listed in the key resources table.
This paper does not report original code.
Any additional information required to reanalyze the data reported in this paper is available from the lead contact upon request.
KEY RESOURCES TABLE
| REAGENT or RESOURCE | SOURCE | IDENTIFIER |
|---|---|---|
| Antibodies | ||
| Rabbit polyclonalanti-PAFAcetylhydrolase (human) antibody | Cayman Chemical | Cat#160603; Clone#N/A; RRID:AB_10077761. |
| Rabbit polyclonalanti-PAFAcetylhydrolase (human) antibody (used for IP) | SHANGHAI GENOMICS,INC. | Cat# N/A; Clone# N/A; RRID:N/A |
| Rabbit monoclonal anti-AKT1 antibody | Cell Signaling Technology | Cat#75692; Clone#D9R8K; RRID: AB_2716309. |
| Rabbit monoclonal anti-P-AKT (S473) antibody | Cell Signaling Technology | Cat#4060S; Clone#D9E; RRID: AB_2315049. |
| Rabbit monoclonal anti-P-MEK1/2 (S217/221) antibody | Cell Signaling Technology | Cat# 9154S; Clone# 41G9; RRID: AB_2138017. |
| Rabbit monoclonal anti-MEK1/2 antibody | Cell Signaling Technology | Cat# 8727S; Clone# D1A5; RRID: AB_10829473. |
| Rabbit polyclonal anti-p44/42 MAP kinase (phosphorylated ERK1/2) antibody | Cell Signaling Technology | Cat# 9101L; Clone# N/A; RRID: AB_331646. |
| Rabbit polyclonal anti-ERK1/2 antibody | Cell Signaling Technology | Cat# 9102S; Clone# N/A; RRID: AB_330744. |
| Mouse monoclonal anti-β-actin antibody | Sigma-Aldrich | Cat# A1978; Clone# AC-15; RRID: AB_476692. |
| Rabbit monoclonal anti-BRAFantibody | Cell Signaling Technology | Cat# 14814S; Clone# D9T6S; RRID:AB_2750887. |
| Rabbit monoclonal anti-RAF1 antibody | Cell Signaling Technology | Cat# 53745S; Clone# D4B3J; RRID:AB_2799444. |
| Rabbit polyclonal anti-Phospho-RAF1(Ser259) antibody | Cell Signaling Technology | Cat# 9421S; Clone# N/A; RRID: AB_330759. |
| Rabbit monoclonalanti-Phospho-RAF1 (Ser338) antibody | Cell Signaling Technology | Cat# 9427S; Clone# 56A6; RRID:AB_2067317. |
| Rabbit polyclonal anti-PAK1 antibody | Cell Signaling Technology | Cat# 2602S; Clone#N/A; RRID: AB_330222. |
| Rabbit polyclonal anti-PAK2 antibody | Cell Signaling Technology | Cat# 2608S; Clone# N/A; RRID:AB_2283388. |
| Rabbit polyclonal anti-PAK3 antibody | Cell Signaling Technology | Cat# 2609S; Clone#N/A; RRID:AB_2225298. |
| Mouse monoclonal anti-rabbit IgG (Conformation Specific) (HRP Conjugate) antibody | Cell Signaling Technology | Cat# 5127; Clone# L27A9; RRID:AB_10892860. |
| Rabbit polyclonal anti-Phospho-PAK1 (Thr423)/PAK2 (Thr402)antibody | Cell Signaling Technology | Cat# 2601; Clone# N/A; RRID:AB_330220. |
| Rabbit polyclonal anti-Phospho-PAK1 (Ser144)/PAK2 (Ser141) antibody | Cell Signaling Technology | Cat# 2606S; Clone# N/A; RRID:AB_2299279. |
| Rabbit polyclonal anti-Phospho-PAK1 (Ser199/204)/PAK2 (Ser192/197) antibody | Cell Signaling Technology | Cat# 2605S; Clone# N/A; RRID:AB_2160222. |
| Rabbit monoclonal anti-FLAG antibody | Cell Signaling Technology | Cat# 14793S; Clone# N/A; RRID: AB_2572291. |
| anti-FLAG(R) M2 Affinity Gel antibody | Sigma- Aldrich | Cat# A2220-5ML; Clone#N/A; RRID: AB_10063035. |
| Rabbit polyclonal Anti-Phospho-(Ser/Thr) Phe antibody | Abcam | Cat# ab17464; Clone# N/A; RRID: AB_443891. |
| Goat anti-Mouse IgG (H+L) Secondary Antibody, HRP | Thermo Fisher Scientific | Cat# 31430; Clone# N/A; RRID: AB_228307 |
| Goat anti-Rabbit IgG (H+L) Secondary Antibody, HRP | Thermo Fisher Scientific | Cat# 31460; Clone# N/A; RRID: AB_ 228341 |
| Rabbit monoclonal anti-CDC42 antibody | Cell Signaling Technology | Cat# 2466S; Clone# 11A11; RRID: AB_2078082. |
| Rabbit polyclonal anti-alpha-Tubulin antibody | Cell Signaling Technology | Cat# 2144S; Clone# N/A; RRID: AB_2210548 |
| Rabbit monoclonal anti-GAPDH antibody | Cell Signaling Technology | Cat# 2118S; Clone# 14C10; RRID: AB_561053 |
| Bacterial and Virus Strains | ||
| BL21(DE3) Chemically Competent Cells | Sigma-Aldrich | Cat# CMC0014 |
| DH10B Competent Cells | Thermo Fisher Scientific | Cat#EC0113 |
| One Shot™ ccdB Survival Cells | Thermo Fisher Scientific | Cat#11828029 |
| Biological Samples | ||
| N/A | ||
| Chemicals, Peptides, and Recombinant Proteins | ||
| Platelet-activating factor (PAF) | AVANTI | Cat# 840009C CAS: 65154-06-5 |
| Lyso-PAF | AVANTI | Cat# 840008C CAS: 52691-62-0 |
| D-Sphingosine | Sigma-Aldrich | Cat#S7049-CAS: 123-78-4 |
| Trypan Blue | Sigma-Aldrich | Cat# T8154-100ML |
| Adenosine 5’-triphosphate (ATP) disodium salt hydrate | Sigma-Aldrich | Cat# A1852 CAS: 34369-07-8 |
| POLYBRENE | American Bioanalytical | Cat#AB01643-00001 |
| Puromycin dihydrochloride | Sigma-Aldrich | Cat# P8833 CAS: 58-58-2 |
| Hygromycin B | emdmillipore | Cat# 400052 CAS: 31282-04-9 |
| [3H]-PAF | ARC | Cat#ART 0727-50 μ;Ci |
| [3H]-Lyso-PAF | ARC | Cat#ART 1741-250 uCi |
| [α-32P]-ATP | PerkinElmer | Cat#BLU003X250UC |
| Recombinant human PAK1 protein | Abcam | Cat#ab125805 |
| Recombinant human PLA2G7 protein | Sigma-Aldrich | Cat#SRP3136 |
| Myelin Basic Protein bovine | Sigma-Aldrich | Cat# M1891 |
| COMPLETE, EDTA-FREE, 20 TABLETS | Sigma-Aldrich | Cat#11873580001 |
| EDTA-free protease and phosphatase inhibitor Cocktail | Thermo Fisher Scientific | Cat# A32961 |
| L-GLUTATHIONE REDUCED | Sigma-Aldrich | Cat#G4251-10G |
| Critical Commercial Assays | ||
| TransIT®-LT1 Transfection Reagent | Mirus | Cat# MIR 2305 |
| PAF Acetylhydrolase Assay Kit | Cayman Chemical | Cat#760901 |
| Human PLA2G7 SimpleStep ELISAKit | Abcam | Cat#ab235643 |
| Lipofectamine® 3000 | Life Technologies | Cat#L3000015 |
| Lipofectamine® RNAiMAX Transfection Reagent | Life Technologies | Cat#13778030 |
| Phusion® High-Fidelity DNA Polymerase | New England Biolabs | Cat#M0530S |
| QIAquick Gel Extraction Kit | Qiagen | Cat# 28704 |
| QIAprep Spin Miniprep Kit | Qiagen | Cat#27106 |
| pENTER/D-TOPO CLONING KIT | Invitrogen | Cat#45-021-8 |
| Gateway™ LR Clonase™ II Enzyme Mix | Invitrogen | Cat#11791020 |
| AccuPrime™ Pfx DNA Polymerase | Invitrogen | Cat#12-344-024 |
| Protein G Sepharose® 4 Fast Flow | Sigma-Aldrich | Cat# GE17-0618-01 |
| Glutathione Sepharose® 4B | GE Healthcare, | Cat#17-0756-01 |
| ADP-Glo™ Kinase Assay Kit | Promega | Cat#V9101 |
| ProBond™ Resin | Life Technologies | Cat#460019 |
| Disposable PD-10 Desalting Columns | GE Healthcare | Cat#95017-001 (PK) |
| Pierce™ Rapid Gold BCA Protein Assay Kit | Thermo Fisher Scientific | Cat#A53225 |
| Coomassie Brilliant Blue R-250 Staining Solution | Bio-rad | Cat# 1610436 |
| Deposited Data | ||
| Original images were deposited to Mendeley data | This paper | https://data.mendeley.com/datasets/g6nfy3hnzf/draft?a=40ef7051-f2e5-4658-8f5b-ef7e008dcd3f |
| Experimental Models: Cell Lines | ||
| Human: HEK293T cells | ATCC | Cat# CRL-3216; RRID:CVCL_0063 |
| Human: A375 cells | ATCC | Cat# CRL-1619; RRID: CVCL_0132 |
| Human: A2058 cells | ATCC | Cat# CRL-11147; RRID: CVCL_1059 |
| Human: SK-MEL-5 cells | ATCC | Cat# HTB-70; RRID: CVCL_0527 |
| Human: WM266-4 cells | ROCKLAND IMMUNOCHEMICALS | Cat#WM266-4-01-0001; RRID: N/A |
| Human: SK-MEL-2 cells | ATCC | Cat# HTB-68; RRID: CVCL_0069 |
| Human: HMCB cells | ATCC | Cat# CRL-9607; RRID: CVCL_3317 |
| Human:VMM39 | ATCC | Cat# CRL-3230; RRID: CVCL_A739 |
| Human:VMM1cells | ATCC | Cat# CRL-3225; RRID: CVCL_A732 |
| Human:NRAS mutant-A375 Isogenic Cell Line | ATCC | Cat# CRL-1619IG-2; RRID: CVCL_JF22 |
| Human: PMWK cells | ATCC | Cat# CRL-2624; RRID: CVCL_A665 |
| Human: CHL-1 cells | ATCC | Cat# CRL-9446; RRID: CVCL_1122 |
| Human: Mel-ST cells | Kang et al., 2015 (KHB MC paper) | Cat# N/A; RRID: N/A |
| Human: WM1985 cells | ROCKLAND IMMUNOCHEMICALS | Cat# WM1985-01-0001; RRID: N/A |
| Human: WM164 cells | ROCKLAND IMMUNOCHEMICALS | Cat# WM164-01-0001; RRID: N/A |
| Human: WM2032 cells | ROCKLAND IMMUNOCHEMICALS | Cat# WM2032-01-0001; RRID: N/A |
| Human: HCT116 cells | ATCC | Cat# CCL-247; RRID:CVCL_0291 |
| Human: HT-29 cells | ATCC | Cat# HTB-38; RRID: CVCL_0320 |
| Experimental Models: Organisms/Strains | ||
| Mouse: Heterozygous Hsd:Athymic Nude-Foxn1nu/Foxn1+ | Envigo/Harlan | Cat# 069(nu)/070(nu/+) |
| Oligonucleotides | ||
| shRNA targeting PLA2G7 sequence #3: 5’-TCAGGACACTTTATTCTGCTA -3’ | This paper | N/A |
| shRNA targeting PLA2G7 sequence #4: 5’-CACCCTTTGGATCCCAAATAA -3’ | This paper | N/A |
| Control siRNA sequence: 5’-UUCUCCGAACGUGUCACGUdTdT-3’ | Qiagen | Cat# 1022076 |
| siRNA targeting PLA2G7 sequence #3: 5’- TCAGGACACTTTATTCTGCTA -3’ | Qiagen | Cat# SI00072191 |
| siRNA targeting PLA2G7 sequence #4: 5’- CACCCTTTGGATCCCAAATAA -3’ | Qiagen | Cat# SI00072198 |
| shRNA targeting BRAF sequence: 5’-GCTGGTTTCCAAACAGAGGAT-3’ | BROAD Institute/Open Biosystems | N/A |
| siRNA targeting PAK1 sequence: 5’-CAUCAAAUAUCACUAAGUC-3’ | Dharmacon | Cat# D-003521-03-0002 |
| siRNA targeting PAK2 sequence: 5’-AGAAGGAACUGAUCAUUAA-3’ | Dharmacon | Cat# D-003597-05-0002 |
| siRNA targeting CDC42 | Sigma-Aldrich | Cat#EHU117241 |
| Primer: PLA2G7, Forward: 5’-CACCATGGTGCCACCCAAATTGCATG-3’ | This paper | N/A |
| Primer: PLA2G7, Reverse:5’-TTACTTGTCATCGTCGTCCTTGTAGTCATTGTATTTCTCTATTCCTG-3’ | This paper | N/A |
| Primers: PLA2G7 S273A mutation, Forward: 5’-GCAGTAATTGGACATGCTTTTGGTGGAGCAAC-3’ | This paper | N/A |
| Primers: PLA2G7 S273A mutation, Reverse: 5’-GTTGCTCCACCAAAAGCATGTCCAATTACTGC -3’ | This paper | N/A |
| Primers: PAK2, Forward: 5’-CACCATGTCTGATAACGGAGAAC -3’ | This paper | N/A |
| Primers:PAK2, Reverse: 5’-TTACTTGTCATCGTCGTCCTTGTAGTCACGGTTACTCTTCATTGCTT -3’ | This paper | N/A |
| Primer: PAK2 Catalytic domain, Forward: 5’-CACCATGGAAGAGATTATGGAGAAATT -3’ | This paper | N/A |
| Recombinant DNA | ||
| pLKO.1 puro-shPLA2G7#3 | This paper | N/A |
| pLKO.1 puro-shPLA2G7#4 | This paper | N/A |
| LentiCRISPRv2-sgPLA2G7 | GenScript | Cat# SC1678 |
| pLKO.1 puro-shBRAF | This paper | N/A |
| pLKO.1 hygro-shPLA2G7#3 | This paper | N/A |
| pDEST27-FLAG-PLA2G7 (RNAi-resistant) | This paper | N/A |
| pDEST27-FLAG-PLA2G7-S273A (RNAi-resistant) | This paper | N/A |
| pLKO.1 hygro-FLAG-PLA2G7 | This paper | N/A |
| pDEST27-MEK-DD | Kang et al., 2015 (KHB MC paper) | N/A |
| pDEST27-BRAF-V600E | Kang et al., 2015 (KHB MC paper) | N/A |
| pET60-FLAG-PAK2 | This paper | N/A |
| pET60-FLAG-PAK2 Catalytic domain | This paper | N/A |
| pET53-FLAG-PAK2 Catalytic domain | This paper | N/A |
| pDONR223-PAK2 | pDONR223-PAK2 was a gift from William Hahn & David Root. | Addgene plasmid: # 23655; RRID:Addgene_23655 |
| pDONR223-RAF1 | pDONR223-RAF1 was a gift from William Hahn & David Root. | Addgene plasmid: # 23832; RRID:Addgene_23832 |
| pET60-RAF1 | This paper | N/A |
| pET53-MEK | Kang et al., 2015 (KHB MC paper) | N/A |
| Software and Algorithms | ||
| Human pLKO.1 the RNAi consortium (TRC) Library | BROAD Institute/ Open Biosystems | https://www.broadinstitute.org/rnai-consortium/rnai-consortium-shrna-library |
| GraphPad Prism 5 software | GraphPad Software | https://www.graphpad.com/; RRID:SCR_002798 |
| ImageJ | https://imagej.nih.gov/ij/ | RRID:SCR_003070 |