Abstract
Susceptibility induced distortion is a major artifact that affects the diffusion MRI (dMRI) data analysis. In the Human Connectome Project (HCP), the state-of-the-art method adopted to correct this kind of distortion is to exploit the displacement field from the B0 image in the reversed phase encoding images. However, both the traditional and learning-based approaches have limitations in achieving high correction accuracy in certain brain regions, such as brainstem. By utilizing the fiber orientation distribution (FOD) computed from the dMRI, we propose a novel deep learning framework named DistoRtion Correction Net (DrC-Net), which consists of the U-Net to capture the latent information from the 4D FOD images and the spatial transformer network to propagate the displacement field and back propagate the losses between the deformed FOD images. The experiments are performed on two datasets acquired with different phase encoding (PE) directions including the HCP and the Human Connectome Low Vision (HCLV) dataset. Compared to two traditional methods topup and FODReg and two deep learning methods S–Net and flow–net, the proposed method achieves significant improvements in terms of the mean squared difference (MSD) of fractional anisotropy (FA) images and minimum angular difference between two PEs in white matter and also brainstem regions. In the meantime, the proposed DrC-Net takes only several seconds to predict a displacement field, which is much faster than the FODReg method.
Keywords: Susceptibility distortion correction, unsupervised learning, fiber orientation distribution
I. Introduction
DIFFUSION magnetic resonance imaging (dMRI) is a non-invasive technique to investigate the structural connectivity in the brain. It is typically acquired using echo planar imaging sequences, which take less imaging time but are very sensitive to off-resonance fields because of the small bandwidth along the phase encoding (PE) direction. The off-resonance field is caused by 1) the head disrupting the main magnetic field, which is known as susceptibility induced distortion [1]; 2) strong and rapidly switching diffusion encoding gradients, which is known as eddy-current induced distortion [2]. In this paper, we will focus on the susceptibility-induced distortion. To reduce the influence of this kind of artifact, commonly used approaches can be characterized as three types: (i) B0 field mapping; (ii) nonlinear registration of B0 image to T1-/T2-weighted images; (iii) estimating the undistored image from the reversed phase encoding scans.
The B0 field mapping method requires the acquisition of field maps representing the field inhomogeneity across the imaging field of view [1]. It usually takes two gradient-echo (GRE) scans with different echo time (TE) and one magnitude image to calculate the shift distance of each voxel from the field map. The undistorted image can be obtained by coordinate calculation and linear interpolation in the postprocessing step. The benefit of this method is the relatively little extra acquisition time needed in the scanning of whole dMRI data. However, the intensity variation problem cannot be fixed by this way and the quality of the field map restricts the correction of residual artifacts [3], [4]. Moreover, there could be challenges to correct the region near tissue edges with the field map due to high variation in the background magnetic field.
Another common method to correct the distortion relies on nonlinear registration between the B0 image and T1-/T2-weighted MRI. To achieve this multi-modal image registration, many methods were proposed. optic flow was used to warp the B0 image to the anatomically correct T2-weighted fast spin echo images and match the local intensity by transforming the labeled T2 regions [5]. Merhof et al. [6] proposed to use B-spline and simultaneous perturbation stochastic approximation to efficiently register the B0 image and T1 image. However, challenges still exist due to the high computational expense and limited tissue contrast of dMRI data. Moreover, image registration based method failed to correct for areas with erroneous signal void or pileup [7].
With the success of the Human Connectome Project (HCP) [8], the connectome imaging protocols have been widely applied to acquire multi-shell dMRI data, where the HCP-Pipeline [9] is used to process the raw data. This protocol needs to acquire two images with reversed phase encoding directions [4], [10], which are then used to estimate the undistorted image based on the topup tool in FSL [10]. It estimates a smooth 3D displacement field using discrete cosine basis functions and redistributed the signal with a least-squares based method. More recently, a method called “Dr-BUDDI” (Diffeomorphic Registration for Blip-Up blip-Down Diffusion Imaging) was proposed to improve the quality of the registration in the presence of large deformations and in white matter regions [11]. DR-BUDDI does not require the distortions in blip-up and blip-down images to be the exact inverse of each other. However, it requires the acquisition of extra structural MRI scans to guide the registration and help the correction in white matter regions.
With the recent development of machine learning techniques in medical image analysis, many methods were proposed to solve the susceptibility induced distortion problem in dMRI data using artificial neural networks. Schilling et al. [12] proposed to synthesize an undistorted non-diffusion weighted image from the structural image using a generative adversarial networks (GANs), and used the non-distorted synthetic image as an anatomical target for distortion correction using topup. This method has a better matching of the geometry of undistorted anatomical images and reduced variation in diffusion modeling. However, it only learns the synthesized B0 image in the structural T1-weighted image space and lacks information from real B0 images. In addition, this model is a 2.5D multi-slice, multi-view network and thus susceptible to 3D inconsistencies for dMRI images. To mitigate these artifacts, they proposed to use 3D U-Net to learn the synthesized B0 image directly from the structural T1 image and real B0 image [7]. In the meantime, Zahneisen et al. [13] used a flow-net to predict the displacement field in an unsupervised manner, but it treated each slice of a volume as an independent training example, which would result in inconsistent alignment between slices. Duong et al. [14] also proposed a different unsupervised deep learning model to predict the displacement field from the images from opposite PEs and achieved a significant improvement in correction time. However, these methods only used B0 image to train the model and achieved a similar correction accuracy as topup, while the rich information from the whole dMRI data was not fully utilized.
While these state-of-the-art methods can usually provide a good distortion correction in most brain regions, there are still severe residual distortions in brain regions such as the brainstem [15]. In Fig. 1, an example of residual distortion from HCP data is shown. As highlighted in Fig. 1, one reason of the failure to correct the distortion in these regions is the lack of sufficient information in the B0 images for many previous methods to capture the displacement field. Building upon our previous method on fiber orientation distribution (FOD) registration based method to correct the susceptibility induced distortion in [16] and the success of unsupervised learning in medical image registration [13], [14], [17], we propose in this work an unsupervised deep learning framework to greatly improve the efficiency and accuracy in distortion correction. The proposed network takes the 4D FOD images calculated from the dMRI data from opposite PEs as the inputs and learns a displacement field to correct the distortions. It contains an U-net to learn the displacement field from the paired 4D FOD images and then uses a transformer to deform the 4D FOD images to the undistorted space. The preliminary result of this work was published in a conference paper [18]. Here we added detailed methodology descriptions including the fiber orientation distribution representation and spatial transformation. Extensive validations were performed on different types of dataset and regions of interest (ROIs) with totally new results including tractography examples. The proposed method was also compared to our previous work FODReg [16], and achieved a significant speedup of the runtime. Furthermore, we make the code publicly available on Github (https://github.com/YuchuanQiao/DrC-Net) to facilitate research on dMRI.
Fig. 1.
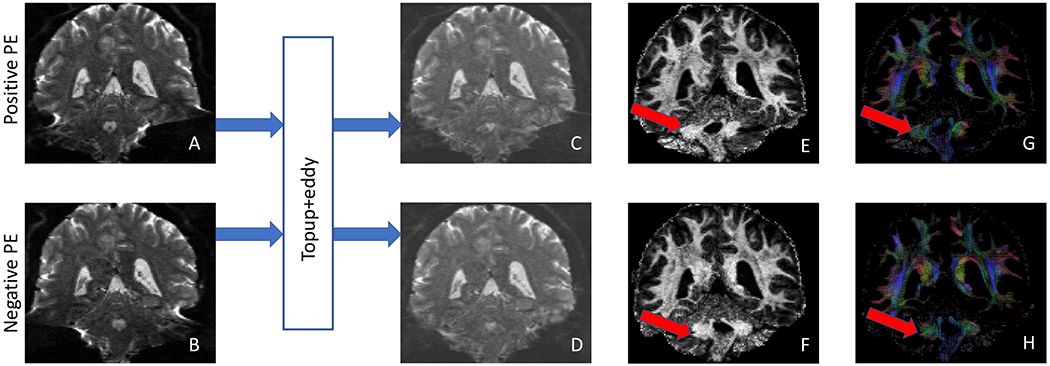
Residual distortions in dMRI after correction with topup from HCP data (subject ID: 121416). (A) and (B) are B0 images from two opposite PEs before distortion correction, while (C) and (D) are corresponding B0 images from each PE after distortion correction. (E) and (F) are the first coefficient image of FOD images from two PEs after distortion correction. (G) and (H) are FOD images from two PEs after distortion correction. The red arrows indicate the region with severe residual distortions for each PE after topup correction.
The rest of the paper is organized as follows. The complete algorithmic framework of our proposed method is introduced in Section II. After that, we evaluate our method on two datasets as described in Section III and compare with four state-of-art methods in Section IV. Finally, conclusions are made in Section V.
II. Method
In this section, the problem definition of our susceptibility induced distortion correction method is first introduced and formulated as a registration problem. To utilize the rich feature from dMRI data, FOD images calculated from dMRI data are used to align dMRI data with two phase encodings (PEs). Finally, the whole framework of our unsupervised deep learning based method is developed for susceptibility distortion correction in dMRI data.
A. Reversed phase encoding model
To resolve the problem of susceptibility induced geometric distortion, reversed phase encoding model is applied to acquire two images with opposite directions. The typical phase encoding directions used for acquisition are Anterior-Posterior (AP), Posterior-Anterior (PA), Right-Left (RL), Left-Right (LR). We denote RL (or AP) PE image as positive PE image I+ and LR (or PA) PE as negative PE image I−. The underlying assumption of this model is that the displacement field of each PE image has the same magnitude but opposite direction [1], [10]. This displacement field can be estimated by minimizing the difference between the deformed positive/negative PE images and undistorted image IM. The undistorted image IM is iteratively updated by averaging the deformed positive/negative PE image. The minimization problem can be solved by an iterative optimization procedure formulated as follows:
| (1) |
where is the optimal displacement field, I+ ∘ ϕ and I− ∘ ϕ−1 are the deformed images, Lsim(·, ·) is the similarity measure function. Note that 4D FOD images share the same 3D displacement field.
Many methods can be used as the similarity measure function Lsim including mutual information, cross-correlation and mean squared difference. As both PEs are acquired from the same scanner with only the difference in phase encoding direction, mean squared difference (MSD) is the similarity measure adopted in our method. The Equation (1) can then be written as:
| (2) |
As , the above equation can be simplified as:
| (3) |
To ensure the smoothness of the displacement field, we use the spatial gradient in the regularization term , where p denotes image voxel position and Ω is the domain of the image.
The cost function of reversed phase encoding model is finally formulated as follows:
| (4) |
where the regularization parameter λ controls the smoothness of the displacement field.
B. Fiber orientation distribution representation
Fiber orientation distribution (FOD) is estimated from dMRI to represent fiber crossings and provide more contrast in white matter than conventional tensor models [19], [20]. Spherical harmonic (SPHARM) is typically used to represent the FOD at each voxel and obtain a numerical representation through spherical deconvolution [20–22]. FODs can be represented by SPHARMs up to the order L as follows:
| (5) |
where p is a fiber direction on the unit sphere , is the m-th real SPHARM basis at the order l = 0, 2, … , L, and slm is the SPHARM coefficient. As the FOD has the property of symmetry on a sphere, only even order SPHARMs are needed. By incorporating compartment models with the spherical deconvolution framework, a novel FOD reconstruction method developed recently for the multi-shell dMRI of HCP data is used in this paper [22]. This method can adaptively estimate the compartment parameters together with sharp and clean FODs at each voxel. Tissue fractions of all the compartments are normalized to sum of one in [22]. Therefore, a 4D FOD image is obtained with a 3D volume for each SPHARM coefficient and the 4-th dimension represents the order of the SPHARM coefficients. As demonstrated previously in [16], L = 2 can provide enough information for displacement field estimation, which means the components of FOD chosen here is 6 as calculated from J = (L + 1)(L + 2)/2.
C. U-Net for displacement field
To model the displacement field ϕ between two PEs and the undistorted image, we use a 3D U-Net architecture with multi-channels to extract the underlying feature from 4D FOD images [23], [24]. The input to the U-Net is a N-channel image formed by concatenating positive and negative PE 4D FOD images. Note that N = 12 is used in our experiments and it can be adapted to new feature images other than FOD image. The output is a 3D displacement field of the same size as the input images. Following the parameter settings in the previous work [14], [17], the architecture of U-Net is based on convolutional layers and formed as encoder-decoder with skip connections and the overview is given in Fig. 2. There are several convolutional blocks in both encoder and decoder. Each convolutional block consists of a 3D convolutional layer with a kernel size of 3 × 3 × 3 and a Leaky ReLU activation layer with parameter 0.2.
Fig. 2.
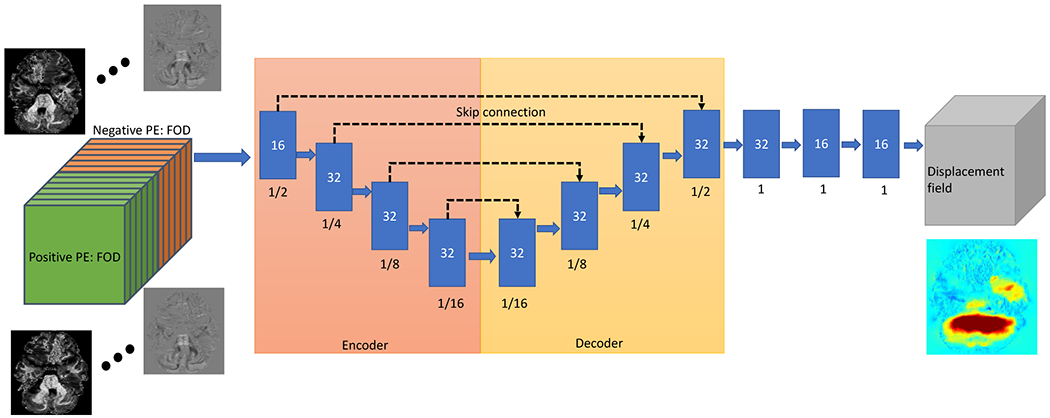
The U-Net to map the displacement field from the FOD image of reversed PE. The input of the U-Net is the 4D FOD image (left side) and the output is the 3D displacement field (right side). Each blue box means the output feature maps of a convolutional block with the number of features in each box. The number below each box is the feature map size relative to the full input image size.
In the encoding stage, four downsampling blocks are used with 32 convolutional filters to reduce the input volume by a factor of two and result in a volume size of (1/16)3 at the fourth downsampling block. In the decoding stage, four upsampling blocks are used and followed by 3 refining convolution layers with filter size of 16 to enable the spatial alignment accuracy. This U-shape model can produce a coarse-to-fine pyramid to learn the features in a multi-scale way. The learned features at each scale are propagated with skip connections between the encoding and decoding stage. Finally the spatial displacement field is learned from the feature maps extracted from previous steps with a convolutional layer.
From the reversed phase encoding model, the susceptibility induced distortion occurs along the PE direction. Therefore the displacement field is constrained to be one dimensional along the PE direction. This results in a i-direction displacement field in RL-LR PE data, while j-direction displacement field for AP-PA PE data. Note that there is no displacement in z-direction. Taking RL-LR PE data as an example, the displacement filed ϕ at voxel x is defined as:
| (6) |
D. Dense spatial transformation
To apply the learned displacement field to positive and negative PEs, a spatial transformer is implemented with a mesh grid generator and a sampler based on spatial transformer network (STN) [25]. The grid coordinates corresponding to each voxel in the input image is generated by a mesh grid generator. The sampler linearly interpolates the deformed voxels with its neighboring grid voxels.
To be clear, there is only one displacement field learned during training and only the sign of the displacement field is changed for two PEs when applying the displacement field. For each voxel v, the new position after applying the displacement field is . The intensity at new position can be linearly interpolated using its eight neighboring voxels. With the differential property of this interpolation, we can calculate the gradient of the transformation and back propagate the losses during the optimization.
E. Overview of the unsupervised learning based distortion correction
By combining the modules described above, we have the unsupervised learning based distortion correction as illustrated in Fig. 3. Building upon the framework proposed in [16], we utilize 4D FOD images to estimate the displacement field between two PEs and the true undistorted image. The whole framework of distortion correction is given in Fig. 3(a). The raw dMRI data from two PEs are firstly processed by topup and eddy in FSL to correct the susceptibility induced distortion and eddy current induced distortion, respectively. FOD representation of the corrected dMRI data is then calculated using the method described in Section II-B and feed into DistoRtion Correction Network (DrC-Net) to estimate the displacement field along the PE direction. The residual distortion caused by susceptibility in the corrected dMRI data is further corrected using the displacement field estimated from DrC-Net. Finally the corrected data from two PEs is merged to generate the final dMRI data.
Fig. 3.
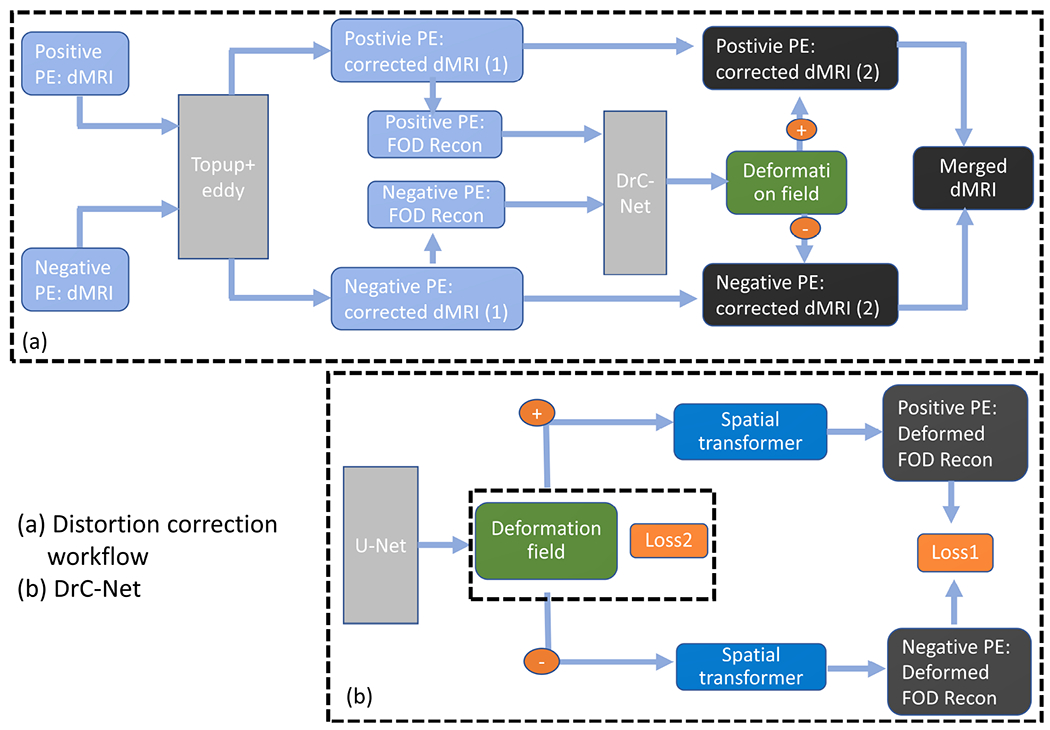
An overview of the proposed framework for distortion correction based on unsupervised deep learning. (a) Overall workflow for distortion correction. (b) Details of the DrC-Net, where Loss1 is the similarity measure between two deformed FOD images in Eq. 4 and Loss2 is the smoothness of the displacement field in Eq. 4.
The detail of the DrC-Net is presented in Fig. 3(b). As described in Section II-C, an U-Net is used to learn the feature from 4D FOD images from both PEs and to model the displacement field. The displacement field is then applied to both PEs with opposite directions using a spatial transformer. The similarity difference between two deformed PEs was evaluated by the loss function in Equation (3). With the help of the regularization term in Equation (4), a smooth displacement field is obtained during an iterative optimization procedure. A stochastic gradient descent strategy is used to ensure the convergence. During the training process, no ground truth such as anatomical landmarks or manual segmentation are used to supervise the learning procedure.
The proposed DrC-Net was implemented using Keras [26] with a Tensorflow backend [27] and some modules from Neuron [28]. Note that DrC-Net accepts images of any size which can facilitate the training on new dataset without any change of the code. We use a padding module to expand image with zero boundaries for each dimension, which can avoid the subpixel downsampling in U-Net. After training, a rollback of the displacement field to the original image size is performed.
III. Evaluation and dataset
A. Evaluation methods
Several evaluation methods have been proposed to validate the performance of distortion correction methods, including both qualitative and quantitative methods. One can directly compare the difference between T1/T2-weighted MRI scans overlaid with displacement field [10], [29]. Graham et al. used the simulated DW-MRI data to evaluate the displacement field difference and image intensity difference between the true image and corrected image. Other works compared the measures derived from tensor based quantities including fractional anisotropy (FA) and Trac (TR) [11], [11], [16], [30]. In this paper, we will show both qualitative and quantitative results before and after distortion correction.
Fractional anisotropy (FA) of the tensor model is a good way to evaluate the performance of distortion correction. In the ideal situation, there would be no difference between the FA computed from the corrected data of the positive and negative PE. The mean squared difference (MSD) of FA between corresponding voxels of the two scans should be zero. Here we evaluated the MSD of FA for a given region of interest (ROI) to quantify the performance of the distortion correction.
Additionally, we measured the angular alignment of main fiber directions of the FOD images between two PEs after distortion correction. They would be perfectly aligned if the distortion of two dMRI images were fully corrected. To quantitatively measure the angular differences of the main fiber tracts, a SPHARM order L = 8 was used to compute the FODs, which is relatively higher than that used for training in DrC-Net. For each voxel, a main fiber direction was defined as the maximum peak value on a spherical mesh. Note that the peaks were ordered according to their FOD magnitude only on the top half of the sphere due to the symmetrical property of the FODs. To improve reliability in peak direction estimation, we only considered voxels with a salient peak, i.e., its FOD magnitude is larger than a threshold. Following the experiment in [16], we chose 0.5 as a threshold. As the main fibers in two PEs may not be perfectly matched due to the deformation or numerical difference, we took three candidate peaks (top three in peak magnitudes) to calculate the peak angular difference. The minimum angular difference (MAD) from the positive PE to the negative PE was treated as the minimum angle difference of the main fiber at that voxel. The mean value of the MAD on all salient voxels in a given ROI was calculated as the measure of fiber alignment from two PEs.
B. Dataset
To evaluate the performance of our proposed method, two datasets are used in our experiments: HCP data with the PE direction of RL-LR and the data from Human Connectome for Low Vision (HCLV) 1 project with the PE direction of AP-PA.
100 subjects (subject ID from 100206 to 123824) from the 900-subject release of HCP were used in our experiments. Each dMRI scan includes image volumes from 97 gradient directions distributed over three shells with b-values 1000, 2000, and 3000 s/mm2. The image size of each scan is 144 × 168 × 110 and has an isotropic spatial resolution of 1.25 mm.
The data from HCLV project was acquired on a 3T Prisma scanner and based on the LifeSpan protocol of HCP. There are totally 58 subjects in this dataset. Each dMRI scan includes the volumes from 98 gradient directions over two shells with b-values 1500 and 3000 s/mm2. Each dMRI image has a size of 140 × 140 × 92 and an isotropic spatial resolution of 1.5 mm
IV. Experiments and results
A. Experiment setup
We compared the proposed method to two conventional methods: topup [10] in FSL which utilizes B0 image from two opposite phase encoding directions to correct the distortions, and FOD-based registration for susceptibility distortion correction (FODReg) [16] which also used FOD image as the feature image to estimate the residual displacement field in a conventional registration way. The default parameter setting is used for topup and the parameter setting used in [16] was chosen for FODReg. In addition, we also compared the proposed method to two deep learning based methods: S–Net [14] which predicts the displacement field from the 3D B0 images with opposite PE and flow–net [13] which learns the displacement field from 2D slice images with opposite PE. The default parameter setting for S–Net is 0.00008 for learning rate, 0.333 for the weights of the smoothness loss and 1500 for the number of epochs, while for flow-net the learning rate is 0.001, the number of epochs is 100. For the proposed method, we will introduce the parameter setting in detail in the following.
For both the FODReg method and the proposed method, all FOD images used in each step were computed with a maximum SPHARM order of 8 using the method in [22]. As confirmed in [16], L = 2 can provide enough feature information to estimate a satisfied displacement field. We thus used the first 6 FOD coefficient images to conduct the registration in our experiments for both methods.
For both the HCP and HCLV data, we used the same parameter setting for training: ADAM optimizer with a learning rate of 1e−4 and a regularization parameter of 0.01. As we used the mini-batch stochastic gradient descent strategy for optimization, one image pair was chosen for each training batch and 1500 epochs with 100 steps in each epoch were used to ensure convergence.
The training dataset for HCP data consists of 60 subjects randomly selected from the whole 100 subjects and the rest 40 subjects form the test dataset which were unseen for the DrC-Net. Similarly, we divided the HCLV data with 40 subjects for training and 18 for testing. T1 image and raw dMRI image were preprocessed by HCP-Pipeline [9], where the T1 image was used for anatomical segmentation. We evaluated the effect of distortion correction in both the brainstem with the most severe distortion and the whole white matter. The brainstem structures including the pons can be automatically segmented using the tool in Freesurfer [31] with the method described in [32]. The whole white matter including corpus callosum was segmented using Freesurfer with the Deskian-Killiany atlas [33].
B. Qualitative results
The residual distortions after topup from the HCP subject 121416 were shown in Fig. 4. The deformation field was calculated by the proposed method and overlaid with the B0 (Fig. 4A) and FOD image (Fig. 4B) from the positive PE. The red color means the displacement along the direction from positive (right-to-left) PE to negative PE (left-to-right), while the blue color means the opposite displacement direction. As we can see in the red box in Fig. 4B, the white matter region is dramatically distorted even after the application of topup based correction.
Fig. 4.
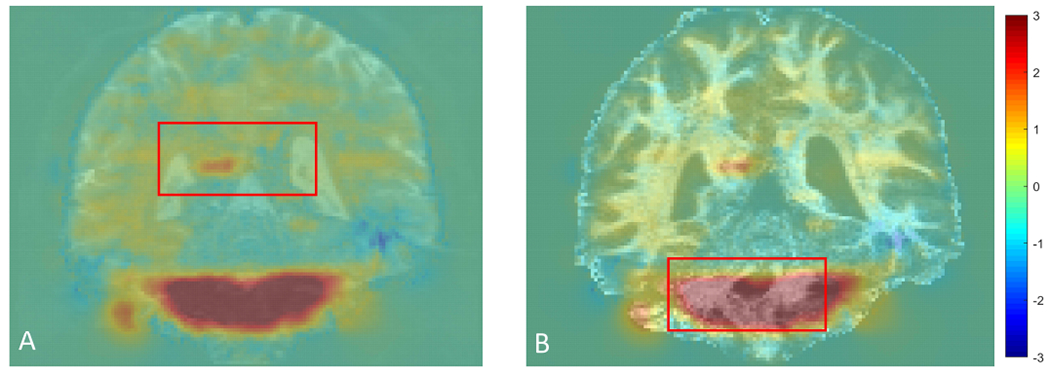
The residual deformation field overlaid on the B0 image (A) and FOD image (B) for subject 121416 in HCP. The red box highlights white matter regions with residual distortion.
The qualitative results showing distortion correction effects were given in Fig. 5 for HCP subject 121416 as shown in Fig. 1. The slice shown in Fig. 5 is the same as in Fig. 4. The left orange box show results of different methods for the ROI delineated by the red box in Fig. 4A, while the right blue box compare the results for the ROI defined by the red box in Fig. 4B. All images shown in Fig. 5 are the FOD images calculated from dMRI data of each PE for each method. As we can see from the left two columns in the orange box, the FODs demonstrate a shift of several voxels between the positive and negative PE for corresponding locations in results from previous methods, especially topup and flow–net. For both the FODReg and DrC-Net methods, the misalignment of FODs between two PEs are corrected. In contrast with the forebrain white matter region shown above, we observe more dramatic residual distortion artifacts in the brainstem areas as shown in the right two columns in the blue box in Fig. 5. The residual distortion from right to left shown in positive PE and the opposite direction in negative PE can be seen after the correction of topup, S–Net and flow–net, while the FODReg and DrC-Net methods can correct these distortions.
Fig. 5.
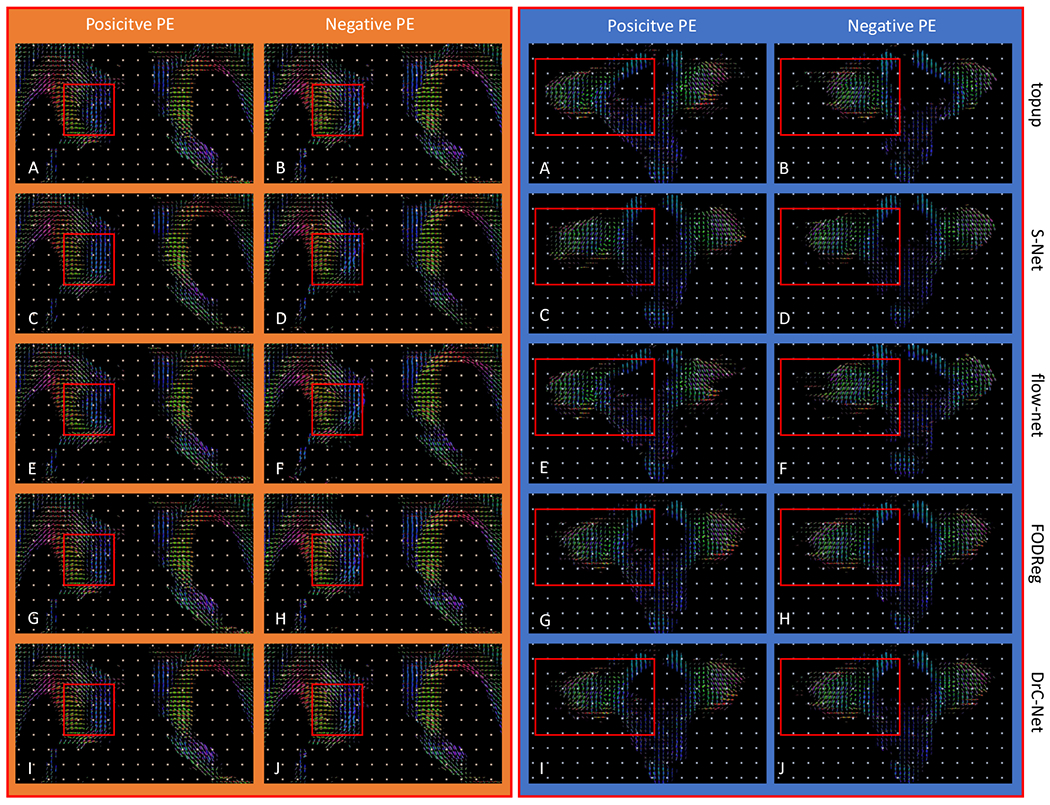
For the two ROIs shown in Fig. 4(A) and (B), the FOD images computed from the distortion correction results of topup, FODReg, S–Net, flow–net and DrC-Net are shown to compare their performances (The left orange box: ROI in Fig. 4 (A); the right blue box: ROI in Fig. 4 (B)). The same red box in (A)-(H) in the first four rows highlights the mismatch of FODs in the corrected results by the other methods. Similarly, the same red box in (I)-(J) highlights the superior alignment of FODs from both PEs achieved by the DrC network.
Next we demonstrate the impact of distortion correction methods on tractography and fiber bundle reconstruction. Our goal is to demonstrate both qualitatively and quantitatively that severe distortion effects can have visible influences on tractography results. In Fig. 6, the corticospinal tract was calculated with the same setting for results from the five distortion correction methods. We first linearly aligned T1 image to B0 image (the merged data after topup correction) to obtain the linear transformation from T1 image space to B0 image space, which was then used to transform the FreeSurfer segmentation to the B0 image space. Finally the precentral and paracentrall gyrus regions were obtained in B0 image space. We used the precentral and paracentrall gyrus region as the seed region and the pons region as the including and stop region to calculate the corticospinal tract using the Trekker software [34]. The same ROIs were used for FODs computed from distortion corrected data by topup, S–Net,flow–net, FODReg and the proposed method. It can be seen that the distortion corrected data from the proposed method allows the generation of a more complete representation of the corticospinal tract. For the 100 HCP subjects in our data, we applied the same tractography protocol using data generated by all five distortion correction methods to quantitatively evaluate the consistency of fiber bundle reconstruction results. For each method, we compute the Dice overlap of the corticospinal tract between positive PE and negative PE, between positive PE and merged data, between negative PE and merged data. The Dice overlap is calculated based on the binarized tract density image [35] of the corticospinal tract bundle. Box plots of the Dice coefficients from all methods are shown in Fig. 7. For each hemisphere, there are statistically significant improvements of the proposed method and FODReg over the topup method (p < 0.05) in all three comparisons of Dice coefficients, while there is no significant improvement for S–Net and flow–net over the topup method.
Fig. 6.
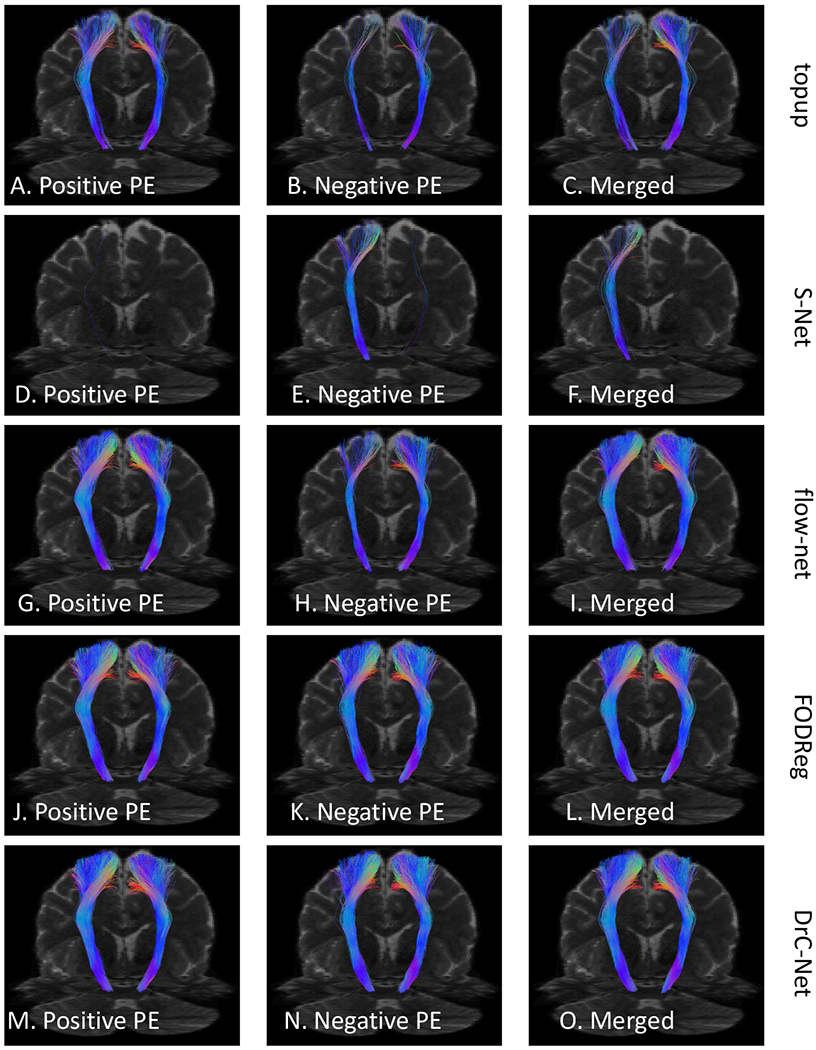
An example from subject 100408 in HCP dataset to show the corticospinal tract calculated from the distortion corrected data of each PE and the merged data from two PEs. The results from the top to the bottom row are for topup, S–Net, flow–net, FODReg and the proposed method, respectively.
Fig. 7.

The quantitative results of five methods evaluated on the Dice overlap of CST tract for all 100 subjects in HCP. For all methods, the blue box plot shows Dice coefficients between positive PE and negative PE, green box plot shows Dice coefficients between positive PE and the merged data and red box plot shows Dice coefficients between negative PE and the merged data. Left: left hemisphere; Right: right hemisphere.
The generalizability of the proposed method was validated on HCLV data with the PE direction of AP-PA. In Fig. 8, the distortion correction effects were presented in a qualitative evaluation for subject 1057. Fig. 8A is the first coefficient image of the FOD image in the sagittal view. Fig. 8B–D are the FOD images after topup correction from the positive PE, negative PE and merged data, respectively. In the meantime, Fig. 8E–G, Fig. 8H–J and Fig. 8K–M are results from S–Net, flow–net and FODReg, respectively, while Fig. 8N–P are the results from the proposed method. As we can see from Fig. 8B and Fig. 8C, a shift of several voxels is highlighted in a red circle between the positive and negative PE for corresponding locations. Similar mismatches can be seen from the results of S–Net and flow–net. For the FODReg method, the misalignment is only corrected in positive PE, but there is still a shift in negative PE. However, for the DrC-Net method, the misalignment of FODs between two PEs are corrected.
Fig. 8.
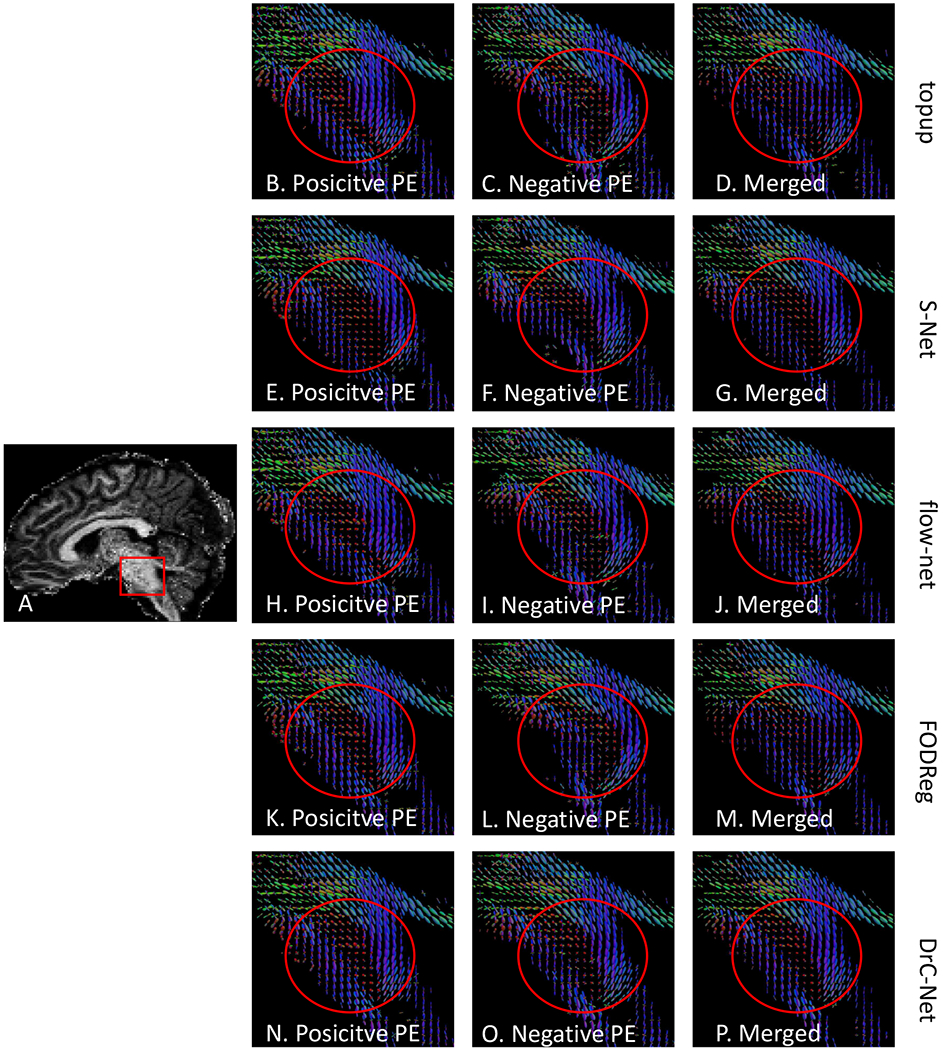
Distortion correction effects shown in FOD images in the brainstem region for subject 1057 in HCLV data. (A) is the sagittal view of the first coefficient image of the FOD image. The five rows are for topup, S–Net, flow–net, FODReg and the proposed method, respectively. (B) (E), (H), (K) and (N) are FODs from the positive PE, while (C), (F), (I), (L) and (O) are FODs from the negative PE. The last column shows FODs from the merged data after correction with different methods.
C. Quantitative results
Compared to the FODReg method, the DrC-Net is computationally more efficient. The runtime to predict a deformation field from two opposite PE was around 10 seconds for the proposed DrC-Net, while FODReg need almost 150 minutes.
The quantitative results for both datasets are given in this section using the measures described in section III-A. As shown in Fig. 9, the proposed method DrC-Net has a significantly smaller MSD of FA value and angular difference of main fiber directions for the whole white matter and pons regions in brainstem than the other methods. There is no statistical difference of the results between the training dataset and testing dataset. For all the methods, the absolute value of MSD in the whole white matter is smaller than the pons region, which indicates the distortion is more significant in the pons region. The results from all methods are statistically different with topup in terms of Wilcoxon rank test (p < 0.05), except the MSD of FA value in the pons region for S–Net (p = 0.955). There is also a statistically significant difference between the DrC-Net and FODReg methods in terms of Wilcoxon rank test (p < 0.05).
Fig. 9.
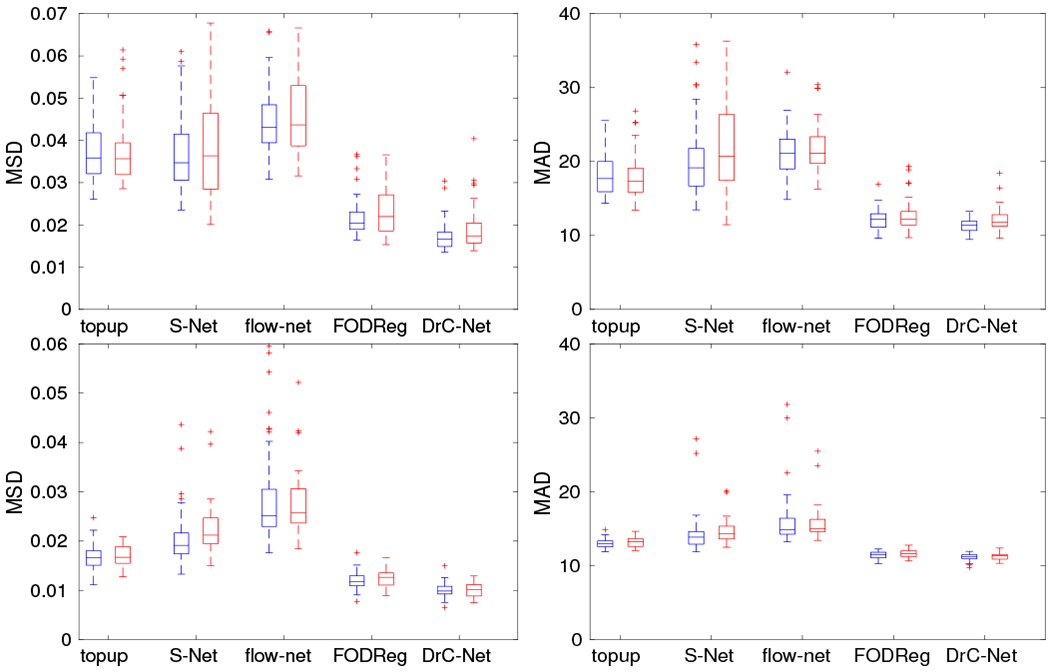
The quantitative results of five methods evaluated on two ROIs for HCP data. The top row is for the pons region and the bottom row is for the whole white matter region. The left column is for the evaluation measure MSD of FA image after correction and the right column is for the angular difference of main fiber direction in FOD image after correction. For all methods, the blue box plot shows results from training data and red box plot shows results from testing data.
For HCLV data, we also performed the same quantitative evaluation and the results are shown in Fig. 10. There is no statistical difference of the results between the training dataset and testing dataset. Compared to topup, S–Net has a similar performance for both measures in the pons region in the brainstem in terms of Wilcoxon rank test (p = 0.913 for the MSD of FA value, p = 0.372 for the angular difference), but inferior performance for both measures in the whole white matter regions (p < 0.05). Compared to topup and DrC-Net, flow–net has a significantly larger MSD of FA value and angular difference of main fiber direction in terms of Wilcoxon rank test (p < 0.05). For both the whole white matter and pons region in brainstem, the proposed method has a significantly smaller MSD of FA value and angular difference of main fiber direction than topup under a Wilcoxon rank test (p < 0.05). Compared to FODReg, the proposed method also shows a significant improvement for both measures in the whole white matter and pons region under a Wilcoxon rank test (p < 0.05).
Fig. 10.
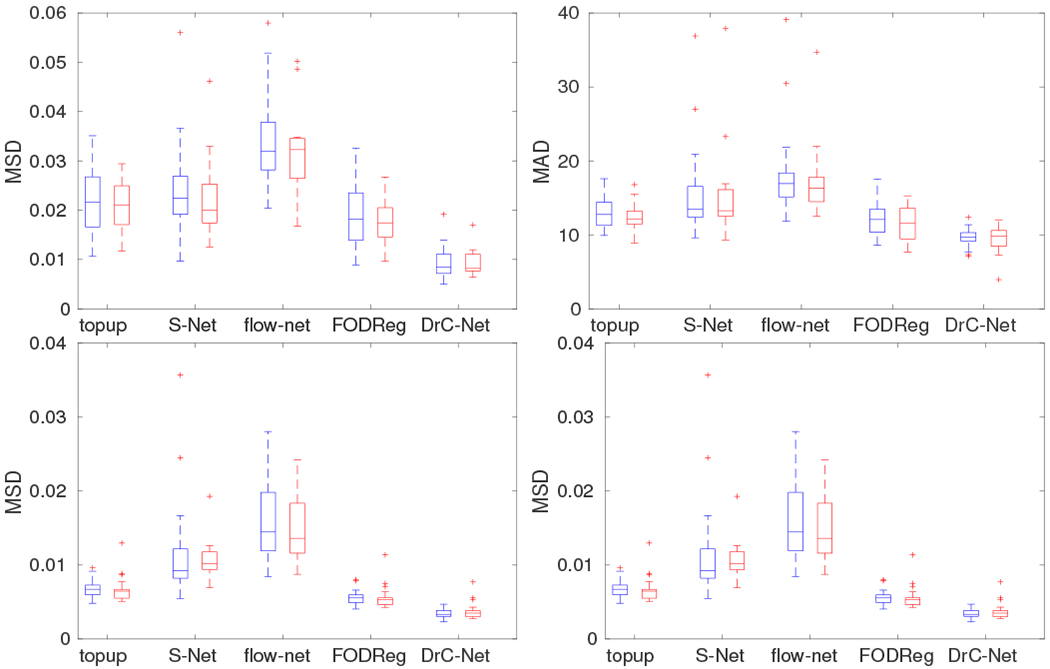
The quantitative results of five methods evaluated on two ROIs for HCLV data. The top row is for the pons region and the bottom row is for the whole white matter region. The left column is for the evaluation measure MSD of FA image after correction and the right column is for the angular difference of main fiber direction in FOD image after correction. For all methods, the blue box plot shows results from training data and red box plot shows results from testing data.
D. Influence of regularization term
The influence of the regularization parameter λ was quantitatively evaluated on HCP data. The different choices of λ is chosen from {0.005, 0.01, 0.05, 0.1, 1, 10}. The quantitative MSD measures of FA images after correction were given in section III-A. As shown in Fig. 11, large values of λ > 0.1 result in much increased MSD measure and hence deteriorated alignment of corresponding white matter structures. This is also confirmed in the very small variations of the Jacobian of the deformation field for large λ values, which means the deformation field is overly smoothed. On the other hand, overly decreasing the λ parameter will lead to the loss of necessary smoothness in the deformation field to prevent the fitting to possible artifacts in the images. Thus, a reasonable range of the selection of the regularization parameter λ could be from 0.01 to 0.1. In this paper, we choose λ as 0.01 for the balance of distortion correction performance and the smoothness of the deformation field.
Fig. 11.

Quantitative results of different choices of the regularization parameter λ are obtained on the whole white matter region of the HCP data. The left column shows the MSD measures from FA images after correction, and the right column shows the standard deviation (std) of the determinant of the Jacobian of the deformation field obtained with different choices of the regularization parameter λ.
V. Discussion and Conclusion
In this paper, we proposed a deep learning framework (DrC-Net) based on the 4D FOD feature image to estimate and correct the residual displacement field in an unsupervised manner. The main contributions of this paper are as follows. The proposed network consists of the U-Net to capture the information from the 4D FOD images and the spatial transformer network to propagate the displacement field and back propagate the losses between the deformed FOD images. Extensive validations on two datasets with different phase-encoding directions in RL-LR and AP-PA have shown promising improvement of the proposed method compared to two traditional methods topup and FODReg and also two deep learning based methods S–Net and flow–net. Moreover, the proposed DrC-Net took several seconds to predict a displacement field from paired PE FOD images, which is much faster than the FODReg method. We have publicly shared the source codes for the proposed method.
The input of the current deep learning framework are FOD images, which is calculated from the dMRI data and proved to be useful for the susceptibility induced distortion correction in our work. This is especially valuable in brain regions with large residual distortions such as the brainstem. However, FOD images need complex processing and is computationally expensive to calculate. Therefore, more advanced deep learning frameworks could be adopted for distortion correction using raw dMRI data. Currently only the low order coefficients of the FOD image are used to drive the alignment of two phase encoding images. Fully utilization of the FOD features may be useful to further improve the alignment. Thirdly, the current deep learning framework is designed for data acquired from two phase encodings, which is not common in clinical protocols. The extension of the proposed method to clinical data would be desired. Lastly, the data used in our experiment is collected with high quality connectome imaging protocol. In future work, we will apply our method to datasets with varied spatial and angular resolutions and examine its performance on removing the distortion artifacts.
Supplementary Material
Acknowledgments
This work was supported by the National Institute of Health (NIH) under grants RF1AG056573, RF1AG064584, R01EB022744, R21AG064776, R01AG062007, P41EB015922, P30AG066530.
Data used in this paper were provided in part by the Human Connectome Project, WU-Minn Consortium (Principal Investigators: David Van Essen and Kamil Ugurbil; 1U54MH091657) funded by the 16 NIH Institutes and Centers that support the NIH Blueprint for Neuroscience Research; and by the McDonnell Center for Systems Neuroscience at Washington University.
Footnotes
Contributor Information
Yuchuan Qiao, USC Stevens Neuroimaging and Informatics Institute, Keck School of Medicine of USC, University of Southern California, Los Angeles, USA.
Yonggang Shi, USC Stevens Neuroimaging and Informatics Institute, Keck School of Medicine of USC, University of Southern California, Los Angeles, USA.
References
- [1].Jezzard P and Balaban RS, “Correction for geometric distortion in echo planar images from B0 field variations,” Magnetic Resonance in Medicine, vol. 34, no. 1, pp. 65–73, 1995. [Online]. Available: 10.1002/mrm.1910340111 [DOI] [PubMed] [Google Scholar]
- [2].Jezzard P, Barnett AS, and Pierpaoli C, “Characterization of and correction for eddy current artifacts in echo planar diffusion imaging,” Magnetic Resonance in Medicine, vol. 39, no. 5, pp. 801–812, 1998. [Online]. Available: 10.1002/mrm.1910390518 [DOI] [PubMed] [Google Scholar]
- [3].Graham MS, Drobnjak I, Jenkinson M, and Zhang H, “Quantitative assessment of the susceptibility artefact and its interaction with motion in diffusion MRI,” PLoS ONE, vol. 12, no. 10, pp. 1–25, 2017. [Online]. Available: 10.1371/journal.pone.0185647 [DOI] [PMC free article] [PubMed] [Google Scholar]
- [4].Holland D, Kuperman JM, and Dale AM, “Efficient correction of inhomogeneous static magnetic field-induced distortion in Echo Planar Imaging,” NeuroImage, vol. 50, no. 1, pp. 175 – 183, 2010. [Online]. Available: http://www.sciencedirect.com/science/article/pii/S1053811909012294 [DOI] [PMC free article] [PubMed] [Google Scholar]
- [5].Ardekani S and Sinha U, “Geometric distortion correction of high-resolution 3 T diffusion tensor brain images,” Magnetic Resonance in Medicine, vol. 54, no. 5, pp. 1163–1171, 2005. [DOI] [PubMed] [Google Scholar]
- [6].Merhof D, Soza G, Stadlbauer A, Greiner G, and Nimsky C, “Correction of susceptibility artifacts in diffusion tensor data using non-linear registration,” Medical Image Analysis, vol. 11, no. 6, pp. 588–603, 2007. [DOI] [PubMed] [Google Scholar]
- [7].Schilling KG, Blaber J, Hansen C, Cai L, Rogers B, Anderson AW, Smith S, Kanakaraj P, Rex T, Resnick SM, Shafer AT, Cutting LE, Woodward N, Zald D, and Landman BA, “Distortion correction of diffusion weighted MRI without reverse phase-encoding scans or field-maps,” PloS one, vol. 15, no. 7, p. e0236418, 2020. [Online]. Available: 10.1371/journal.pone.0236418 [DOI] [PMC free article] [PubMed] [Google Scholar]
- [8].Essen DV, Ugurbil K, and et al. , “The Human Connectome Project: A data acquisition perspective,” NeuroImage, vol. 62, no. 4, pp. 2222 – 2231, 2012. [DOI] [PMC free article] [PubMed] [Google Scholar]
- [9].Glasser MF, Sotiropoulos SN, Wilson JA, Coalson TS, Fischl B, Andersson JL, Xu J, Jbabdi S, Webster M, Polimeni JR, Van Essen DC, and Jenkinson M, “The minimal preprocessing pipelines for the Human Connectome Project,” NeuroImage, vol. 80, pp. 105–124, 2013. [Online]. Available: 10.1016/j.neuroimage.2013.04.127 [DOI] [PMC free article] [PubMed] [Google Scholar]
- [10].Andersson JL, Skare S, and Ashburner J, “How to correct susceptibility distortions in spin-echo echo-planar images: Application to diffusion tensor imaging,” NeuroImage, vol. 20, no. 2, pp. 870–888, 2003. [DOI] [PubMed] [Google Scholar]
- [11].Irfanoglu MO, Modi P, Nayak A, Hutchinson EB, Sarlls J, and Pierpaoli C, “DR-BUDDI (Diffeomorphic Registration for Blip-Up blip-Down Diffusion Imaging) method for correcting echo planar imaging distortions,” NeuroImage, vol. 106, pp. 284 – 299, 2015. [Online]. Available: http://www.sciencedirect.com/science/article/pii/S1053811914009598 [DOI] [PMC free article] [PubMed] [Google Scholar]
- [12].Schilling KG, Blaber J, Huo Y, Newton A, Hansen C, Nath V, Shafer AT, Williams O, Resnick SM, Rogers B, Anderson AW, and Landman BA, “Synthesized b0 for diffusion distortion correction (Synb0-DisCo),” Magnetic Resonance Imaging, vol. 64, no. May, pp. 62–70, 2019. [Online]. Available: 10.1016/j.mri.2019.05.008 [DOI] [PMC free article] [PubMed] [Google Scholar]
- [13].Zahneisen B, Baeumler K,Zaharchuk G, Fleischmann D, and Zeineh M, “Deep Flow-Net for EPI Distortion Estimation,” NeuroImage, p. 116886, 2020. [Online]. Available: 10.1016/j.neuroimage.2020.116886 [DOI] [PubMed] [Google Scholar]
- [14].Duong ST, Phung SL, Bouzerdoum A, and Schira MM, “An unsupervised deep learning technique for susceptibility artifact correction in reversed phase-encoding EPI images,” Magnetic Resonance Imaging, vol. 71, no. January, pp. 1–10, 2020. [Online]. Available: 10.1016/j.mri.2020.04.004 [DOI] [PubMed] [Google Scholar]
- [15].Tang Y, Sun W, Toga AW, Ringman JM, and Shi Y, “A probabilistic atlas of human brainstem pathways based on connectome imaging data,” NeuroImage, vol. 169, pp. 227–239, 2018. [DOI] [PMC free article] [PubMed] [Google Scholar]
- [16].Qiao Y, Sun W, and Shi Y, “FOD-based registration for susceptibility distortion correction in brainstem connectome imaging,” NeuroImage, vol. 202, p. 116164, 2019. [DOI] [PMC free article] [PubMed] [Google Scholar]
- [17].Balakrishnan G, Zhao A, Sabuncu MR, Guttag J, and Dalca AV, “VoxelMorph: A Learning Framework for Deformable Medical Image Registration,” IEEE Transactions on Medical Imaging, vol. 38, no. 8, pp. 1788–1800, 2019. [DOI] [PubMed] [Google Scholar]
- [18].Qiao Y and Shi Y, “Unsupervised deep learning for susceptibility distortion correction in connectome imaging,” in Medical Image Computing and Computer Assisted Intervention – MICCAI 2020, Martel AL, Abolmaesumi P, Stoyanov D, Mateus D, Zuluaga MA, Zhou SK, Racoceanu D, and Joskowicz L, Eds. Cham: Springer International Publishing, 2020, pp. 302–310. [DOI] [PMC free article] [PubMed] [Google Scholar]
- [19].Anderson AW, “Measurement of fiber orientation distributions using high angular resolution diffusion imaging,” Magnetic Resonance in Medicine, vol. 54, no. 5, pp. 1194–1206, 2005. [DOI] [PubMed] [Google Scholar]
- [20].Tournier J-D, Calamante F, and Connelly A, “Robust determination of the fibre orientation distribution in diffusion MRI: non-negativity constrained super-resolved spherical deconvolution,” Neuroimage, vol. 35, no. 4, pp. 1459–1472, 2007. [DOI] [PubMed] [Google Scholar]
- [21].Jeurissen B, Tournier J-D, Dhollander T, Connelly A, and Sijbers J, “Multi-tissue constrained spherical deconvolution for improved analysis of multi-shell diffusion mri data,” NeuroImage, vol. 103, pp. 411 – 426,2014. [DOI] [PubMed] [Google Scholar]
- [22].Tran G and Shi Y, “Fiber orientation and compartment parameter estimation from multi-shell diffusion imaging,” IEEE Trans. Med. Imag, vol. 34, no. 11, pp. 2320–2332, 2015. [DOI] [PMC free article] [PubMed] [Google Scholar]
- [23].Balakrishnan G, Zhao A, Sabuncu MR, Guttag J, and Dalca AV, “An unsupervised learning model for deformable medical image registration,” in Proceedings of the IEEE conference on computer vision and pattern recognition, 2018, pp. 9252–9260. [Google Scholar]
- [24].Ronneberger O, Fischer P, and Brox T, “U-net: Convolutional networks for biomedical image segmentation,” in International Conference on Medical image computing and computer-assisted intervention. Springer,2015,pp. 234–241. [Google Scholar]
- [25].Jaderberg M, Simonyan K, Zisserman A et al. , “Spatial transformer networks,” in Advances in neural information processing systems, 2015, pp. 2017–2025. [Google Scholar]
- [26].Chollet F et al. , “Keras,” https://github.com/fchollet/keras, 2015. [Google Scholar]
- [27].Abadi M, Agarwal A et al. , “TensorFlow: Large-scale machine learning on heterogeneous systems,” 2015, software available from tensorflow.org. [Online]. Available: https://www.tensorflow.org/ [Google Scholar]
- [28].Dalca AV, Guttag J, and Sabuncu MR, “Anatomical priors in convolutional networks for unsupervised biomedical segmentation,” in Proceedings of the IEEE Conference on Computer Vision and Pattern Recognition, 2018, pp. 9290–9299. [Google Scholar]
- [29].Holland D, Kuperman JM, and Dale AM, “Efficient correction of inhomogeneous static magnetic field-induced distortion in Echo Planar Imaging,” NeuroImage, vol. 50, no. 1, pp. 175 – 183, 2010. [DOI] [PMC free article] [PubMed] [Google Scholar]
- [30].Graham MS, Drobnjak I, Jenkinson M, and Zhang H, “Quantitative assessment of the susceptibility artefact and its interaction with motion in diffusion MRI,” PloS one, vol. 12, no. 10, p. e0185647, 2017. [DOI] [PMC free article] [PubMed] [Google Scholar]
- [31].Fischl B, “Freesurfer,” NeuroImage, vol. 62, no. 2, pp. 774 – 781, 2012. [DOI] [PMC free article] [PubMed] [Google Scholar]
- [32].Iglesias JE, Van Leemput K, Bhatt P, Casillas C, Dutt S, Schuff N, Truran-Sacrey D, Boxer A, Fischl B, Initiative ADN et al. , “Bayesian segmentation of brainstem structures in MRI,” Neuroimage, vol. 113, pp. 184–195, 2015. [DOI] [PMC free article] [PubMed] [Google Scholar]
- [33].Desikan RS, Ségonne F, Fischl B, Quinn BT, Dickerson BC, Blacker D, Buckner RL, Dale AM, Maguire RP, Hyman BT et al. , “An automated labeling system for subdividing the human cerebral cortex on MRI scans into gyral based regions of interest,” Neuroimage, vol. 31, no. 3, pp. 968–980, 2006. [DOI] [PubMed] [Google Scholar]
- [34].Aydogan DB and Shi Y, “Parallel transport tractography,” IEEE Transactions on Medical Imaging, 2020. [DOI] [PMC free article] [PubMed] [Google Scholar]
- [35].Calamante F, Tournier J-D, Jackson GD, and Connelly A, “Track-density imaging (TDI): Super-resolution white matter imaging using whole-brain track-density mapping,” NeuroImage, vol. 53, no. 4, pp. 1233–1243, 2010. [Online]. Available: https://www.sciencedirect.com/science/article/pii/S1053811910009766 [DOI] [PubMed] [Google Scholar]
Associated Data
This section collects any data citations, data availability statements, or supplementary materials included in this article.


