

Abstract
Background
Sarcopenia is an important prognostic factor of lung cancer. The serum creatinine/cystatin C ratio (CCR) and the sarcopenia index (SI, serum creatinine × cystatin C‐based glomerular filtration rate) are novel screening tools for sarcopenia; however, the diagnostic accuracy of the CCR and SI for detecting sarcopenia remains unknown. We aimed to explore and validate the diagnostic values of the CCR and SI for determining sarcopenia in non‐small cell lung cancer (NSCLC) and to explore their prognostic values for overall survival.
Methods
We conducted a prospective cohort study of adult patients with stage IIIB or IV NSCLC. Levels of serum creatinine and cystatin C were measured to calculate the CCR and SI. Sarcopenia was defined separately using CCR, SI, and the Asian Working Group for Sarcopenia (AWGS) 2019 criteria. Participants were randomly sampled into derivation and validation sets (6:4 ratio). The cutoff values for diagnosing sarcopenia were determined based on the derivation set. Diagnostic accuracy was analysed in the validation set through receiver operating characteristic (ROC) curves. Cox regression models and survival curves were applied to evaluate the impact of different sarcopenia definitions on survival.
Results
We included 579 participants (women, 35.4%; mean age, 58.4 ± 8.9 years); AWGS‐defined sarcopenia was found in 19.5% of men and 10.7% of women. Both CCR and SI positively correlated with computed tomography‐derived and bioimpedance‐derived muscle mass and handgrip strength. The optimal cutoff values for CCR and SI were 0.623 and 54.335 in men and 0.600 and 51.742 in women, with areas under the ROC curves of 0.837 [95% confidence interval (CI): 0.770–0.904] and 0.833 (95% CI: 0.765–0.901) in men (P = 0.25), and 0.808 (95% CI: 0.682–0.935) and 0.796 (95% CI: 0.668–0.924) in women (P = 0.11), respectively. The CCR achieved sensitivities and specificities of 73.0% and 93.7% in men and 85.7% and 65.7% in women, respectively; the SI achieved sensitivities and specificities of 75.7% and 86.5% in men and 92.9% and 62.9% in women, respectively. CCR‐defined, SI‐defined, and AWGS‐defined sarcopenia were independently associated with a high mortality risk [hazard ratio (HR) = 1.75, 95% CI: 1.25–2.44; HR = 1.55, 95% CI: 1.11–2.17; and HR = 1.76, 95% CI: 1.22–2.53, respectively].
Conclusions
CCR and SI have satisfactory and comparable diagnostic accuracy and prognostic values for sarcopenia in patients with advanced NSCLC. Both may serve as surrogate biomarkers for evaluating sarcopenia in these patients. However, further external validations are required.
Keywords: Muscle depletion, Lung cancer, Muscle wasting, Decision curve analysis, Survival
Introduction
Lung cancer is the most commonly occurring cancer and the leading cause of cancer‐related mortality worldwide. 1 Approximately 80% of lung cancer patients have non‐small cell lung cancer (NSCLC), 2 and the majority of NSCLC patients present at advanced stages. Despite advances in antineoplastic treatments, the overall prognosis of patients with advanced NSCLC has improved only slightly. 3 The determinants of lung cancer prognosis include tumour‐specific factors such as tumour stage, as well as patient factors, including nutritional status, physical performance, and skeletal muscle mass (SMM). 4 , 5
Sarcopenia, characterized by low muscle mass, decreased muscle strength, and/or low physical performance, is an important prognostic factor across stages of lung cancer. 6 , 7 The prevalence of sarcopenia reaches 43% in NSCLC 6 ; thus, detection and management of sarcopenia are important components for the management of patients with NSCLC. The current international consensus suggests that diagnosing sarcopenia requires device‐dependent muscle mass measurements [e.g. computed tomography (CT), dual‐energy X‐ray absorptiometry, and bioelectrical impedance analysis (BIA)] and measurement of muscle function (which is generally simple but time‐consuming, e.g. analysing gait speed). 8 , 9 , 10 , 11 , 12 Therefore, a simple, cheap, yet reliable method for the diagnosis of sarcopenia is needed.
Several serum biomarkers have been proposed as potential diagnostic indicators for sarcopenia. Serum creatinine and cystatin C (CysC) are commonly used to estimate glomerular filtration rates (GFRs) and renal function in clinical practice. Serum creatinine is an endogenous product derived from creatine phosphate and its production is affected by skeletal muscle. Serum creatinine levels have been used as a surrogate for SMM, with a low serum creatinine level associated with high mortality in critically ill patients 13 , 14 ; however, serum creatinine levels are also affected by renal function, thus limiting the reliability of this biomarker in assessing muscle mass.
Cystatin C is a small protein originating from nucleated cells and is reabsorbed and completely catabolized by the proximal tubular cells. Its production is less affected by muscle mass. Recently, two new diagnostic indices—based on serum creatinine and CysC—have been developed for sarcopenia. Kashani et al. 15 reported that the serum creatinine/CysC ratio (CCR) could be used to estimate SMM. Additionally, Lien et al. 16 developed a sarcopenia index (SI), defined as serum creatinine × CysC‐based GFR (eGFRCysC), which appears to have a good correlation with sarcopenia based on prior research.
The CCR has been recommended as a biomarker for low SMM and sarcopenia and is reported to be associated with adverse outcomes in various populations, including critically ill patients, 17 hospitalized older adults, 18 and patients with chronic obstructive pulmonary disease 19 or diabetes. 20 The SI is also associated with SMM and sarcopenia in cancer patients 21 , 22 ; however, the overall diagnostic accuracy of the CCR and SI for detecting sarcopenia remains unknown. No published studies have compared the diagnostic accuracy of the CCR and SI in determining sarcopenia. This study was therefore conducted to evaluate and validate the utility of the CCR and SI for detecting sarcopenia as defined by the Asian Working Group for Sarcopenia (AWGS) 2019 23 criteria, as well as to compare the prognostic values of the CCR and SI for overall survival in patients with advanced NSCLC.
Materials and methods
Study design and participants
This prospective cohort study was conducted at the Department of Oncology at ShangJin NanFu Hospital (Sichuan University, Chengdu, China). The conduct and reporting of the current study conform to the Strengthening the Reporting of Observational Studies in Epidemiology (STROBE) statement. 24 This investigation received ethical review board approval and was conducted in accordance with the principles of the Declaration of Helsinki and its later amendments, and all participants provided their written informed consent prior to participation.
Consecutive patients with advanced NSCLC were recruited between August 2017 and May 2019 at the Department of Oncology. The inclusion criteria were as follows: age ≥20 years, having provided informed consent for participating in the study, a diagnosis of stage IIIB or IV NSCLC, and undergoing treatment with first‐line chemotherapy for the first time. The exclusion criteria were as follows: receiving immunosuppressive therapy, molecular targeted therapy, radiotherapy, or single‐agent chemotherapy; the presence of pacemaker implantation; a history of any other type of tumour; poor quality CT images [with lesions affecting skeletal muscle segmentation (such as chest wall oedema) or partial loss of skeletal muscle on the CT images]; clinically visible oedema; and an eGFR <60 mL/min/1.73 m2. Included participants were randomly assigned to a derivation set and a validation set with a 6:4 ratio.
Data collection
Trained nurses obtained baseline data from all participants within 48 h of the first admission and performed standard anthropometric measurements.
Laboratory measurements and assessments of the creatinine/cystatin C ratio and sarcopenia index
Blood was drawn by experienced nurses in the morning after a fast of more than 8 h; levels of serum creatinine, CysC, haemoglobin, and albumin were measured using standard methods. The eGFRCysC was calculated based on CysC using the following equation 25 : . The CCR was calculated as , and the SI was calculated as .
Assessment of sarcopenia
Chest CT scans for each participant were completed within 48 h after admission using a 16‐slice spiral CT scanner (Brilliance; Philips Healthcare, Cleveland, OH, USA) with a 5 mm slice thickness. Acquisition parameters were as follows: 100–140 kV, variable mAs based on the patient's body size, and a detector collimation of 0.75–1.5 mm. The skeletal muscle cross‐sectional area (SMA) at the 12th thoracic vertebra (T12) was measured using dedicated segmentation software (Mimics version 21.0; Materialize NV, Leuven, Belgium) with a threshold of −29 to +150 Hounsfield units; the SMM index (SMI) was then calculated based on the following equation: . A trained observer (L. T.) blinded to patient outcomes segmented all CT images.
On the day of the CT scan, trained nurses used a segmented multifrequency BIA device (Inbody 770; Seoul, South Korea) to estimate the total SMM, trunk SMM, and appendicular SMM (ASM). The appendicular SMM index (ASMI) was then calculated using the equation: . Handgrip strength was measured to the nearest 0.1 kg by trained nurses using a strain gauge sensor‐based handheld dynamometer (EH101; Xiangshan Inc., Guangdong, China). The strength of both hands was measured three times, and the highest value of either hand was recorded. 10 The Eastern Cooperative Oncology Group Performance status (ECOG PSs) was assessed by trained nurses.
According to the AWGS 2019 guidelines, low muscle mass is defined as an ASMI <7.0 kg/m2 for men and <5.7 kg/m2 for women; low muscle strength is defined as a handgrip strength <28 kg for men and <18 kg for women. 23 In this study, low physical performance was defined as an ECOG PS ≥ 2; sarcopenia was defined as the loss of muscle mass plus low muscle strength (or low physical performance). 23 Furthermore, CCR‐defined and SI‐defined sarcopenia were defined by the sex‐specific cutoff values for the CCR and SI, respectively, as derived from the derivation set.
Assessment of potential covariates
The following covariates were collected from the hospital information systems and face‐to‐face interviews: age, sex, smoking status (non‐smoker or ever‐smoker), histological NSCLC type (adenocarcinoma or squamous carcinoma), cancer stage (IIIB or IV), ECOG PS, chemotherapy regimens, and courses of chemotherapy.
The Charlson co‐morbidity index (CCI) was used to assess the number and severity of important complications, such as chronic obstructive pulmonary disease, kidney disease, malignant tumours, and cerebrovascular disease. 26 The maximum possible total CCI score was 24, with ‘malignant tumours’ receiving a score of 2; a CCI score ≥3 indicated that the patient had at least one other co‐morbidity besides NSCLC. Body height and weight were measured using standard methods and body mass index (BMI) was calculated as kg/m2.
Follow‐up
Overall survival was defined as the time in months from the date of initial recruitment to the date of death or last follow‐up. Each patient was followed up until they died (as confirmed by telephonic follow‐up) or until the last week of August 2020.
Statistical analysis
Histograms and the Shapiro–Wilk test were used to assess the distribution of continuous variables. The data are presented as means and standard deviations (SDs) for continuous variables and as numbers and percentages for categorical variables. Group differences were analysed using one‐way ANOVA or χ 2 tests, as appropriate.
The participants were randomly sampled into a derivation set and a validation set (with a 6:4 ratio). Based on the derivation set, the diagnostic values of the CCR and SI for sarcopenia were assessed via receiver operating characteristic (ROC) curves for men and women. The optimal CCR and SI cutoff values for men and women were calculated by determining the shortest distance between the ROC curve and upper left corner of the graph that maximized the sum of the sensitivity and specificity. 27 The areas under the ROC curve (AUCs), sensitivity, specificity, accuracy, positive predictive values, negative predictive values, and corresponding 95% confidence intervals (CIs) were calculated; the larger the AUC, the better the overall diagnostic accuracy. 28 Comparisons between two correlated ROC curves were performed using the DeLong method. 29 Using these cutoff values, the diagnostic accuracy of the CCR and SI was validated within the validation set by calculating sensitivities, specificities, accuracy, positive predictive values, and negative predictive values for these factors.
Pearson's correlation analysis was used to determine the relationship of serum biomarkers (SI and CCR) with body composition (BMI, T12 SMA, T12 SMI, total SMM, trunk SMM, ASM, and ASMI) and handgrip strength. Univariate and multivariate Cox regression models were applied to calculate the unadjusted and adjusted hazard ratio (HR) and 95% CIs of CCR‐defined, SI‐defined, and AWGS‐defined sarcopenia for overall survival in the derivation and validation sets. We adjusted for age, sex, histological type, cancer stage, CCI, chemotherapy regimens, and completion of at least four courses of chemotherapy in the multivariate Cox regression models. Survival curves were estimated using the Kaplan–Meier method to determine the impact of CCR‐defined, SI‐defined, and AWGS‐defined sarcopenia on overall survival. The differences between the survival curves were compared using log‐rank tests. Decision curve analysis was used to depict the clinical efficiency of the CCR and SI in the derivation and validation sets.
All statistical analyses were performed using IBM SPSS Statistics for Windows, version 26.0 (IBM Corp., Armonk, ΝΥ, USA) and R software version 3.5.3 (R Foundation for Statistical Computing, Vienna, Austria). Two‐sided P‐values <0.05 were considered statistically significant.
Results
Characteristics of the study population
A total of 660 patients with NSCLC agreed to participate in this study; 81 of these patients were excluded because of chest wall oedema (15 individuals), low‐quality CT images (5 individuals), missing data on handgrip strength (16 individuals), receiving molecular targeted therapy (30 individuals), or an eGFR <60 mL/min/1.73 m2 (15 individuals). As a result, 579 participants (374 men and 205 women; mean age: 58.4 ± 8.9 years) underwent a baseline investigation; 347 participants were randomly assigned to a derivation set and 232 participants were assigned to a validation set. No participants were lost to follow‐up. A participant flow diagram is presented in the Supporting Information, Figure S1. The baseline characteristics of the study population according to sex are shown in Table 1. Ninety‐three (24.9%) male and 29 (14.1%) female patients had sarcopenia, and the prevalence was statistically significantly higher in men than in women (P < 0.05). Men were older and more likely to have a higher SMM (T12 SMA, T12 SMI, total SMM, trunk SMM, ASM, and ASMI), as well as greater handgrip strength, CCR, SI, and haemoglobin levels in comparison with women. There were no statistically significant differences with regard to cancer stage, ECOG PS, BMI, CCI, and the completion of chemotherapy courses between men and women. Derivation and validation set characteristics are presented in Table S1.
Table 1.
Baseline characteristics of the study population according to sex
| Characteristic | Men (n = 374) | Women (n = 205) | P‐value a |
|---|---|---|---|
| Age, years | 59.0 (8.3) | 57.3 (9.8) | 0.025 |
| Ever smoker, n (%) | 289 (77.3) | 10 (4.9) | <0.001 |
| Histologic type, n (%) | |||
| Adenocarcinoma | 205 (54.8) | 177 (86.3) | <0.001 |
| Squamous carcinoma | 169 (45.2) | 28 (13.7) | |
| Cancer stage, n (%) | |||
| Stage IIIB | 182 (48.7) | 86 (42.0) | 0.121 |
| Stage IV | 192 (51.3) | 119 (58.0) | |
| ECOG PS, n (%) | |||
| 0–1 | 304 (81.3) | 156 (76.1) | 0.140 |
| ≥2 | 70 (18.7) | 49 (23.9) | |
| BMI, kg/m2 | 23.1 (3.1) | 23.3 (3.2) | 0.494 |
| Charlson co‐morbidity index ≥3, n (%) | 112 (29.9) | 59 (28.8) | 0.769 |
| Chemotherapy regimens, n (%) | |||
| Pemetrexed + carboplatin/cisplatin | 130 (34.8) | 91 (44.4) | 0.004 |
| Docetaxel + carboplatin/cisplatin | 130 (34.8) | 78 (38.0) | |
| Gemcitabine + carboplatin/cisplatin | 18 (4.8) | 9 (4.4) | |
| Paclitaxel + carboplatin/cisplatin | 96 (25.7) | 27 (13.2) | |
| Patients who completed at least four courses of chemotherapy, n (%) | 301 (80.5) | 154 (75.1) | 0.133 |
| Serum creatinine, mg/L | 0.87 (0.27) | 0.71 (0.16) | <0.001 |
| Serum cystatin C, mg/L | 1.18 (0.25) | 1.09 (0.25) | <0.001 |
| Serum albumin, g/L | 42.35 (2.48) | 41.30 (2.52) | <0.001 |
| CCR | 0.76 (0.21) | 0.68 (0.20) | <0.001 |
| SI | 64.85 (18.90) | 58.76 (18.56) | <0.001 |
| eGFRCysC | 74.81 (17.61) | 84.34 (26.74) | <0.001 |
| Haemoglobin, g/L | 128.28 (23.53) | 120.03 (21.78) | <0.001 |
| Body composition variables | |||
| T12 SMA, cm2 | 96.28 (14.34) | 69.50 (9.99) | <0.001 |
| T12 SMI, cm2/m2 | 35.08 (5.37) | 28.60 (4.28) | <0.001 |
| Total SMM, kg | 28.48 (4.67) | 22.93 (4.13) | <0.001 |
| Trunk SMM, kg | 8.14 (1.99) | 6.10 (0.95) | <0.001 |
| ASM, kg | 20.35 (3.88) | 16.84 (3.90) | <0.001 |
| ASMI, kg/m2 | 7.43 (1.52) | 6.96 (1.76) | 0.001 |
| Handgrip strength, kg | 29.17 (5.86) | 21.53 (5.96) | <0.001 |
| Sarcopenia, n (%) | 93 (24.9) | 29 (14.1) | 0.010 |
Data are presented as means (SD) if not otherwise specified.
ASM, appendicular skeletal muscle mass; ASMI, appendicular skeletal muscle mass index; BMI, body mass index; CCR, creatinine/cystatin C ratio; ECOG PS, Eastern Cooperative Oncology Group Performance Status; eGFRCysC, cystatin C‐based glomerular filtration rate; SI, sarcopenia index; SMA, skeletal muscle cross‐sectional area; SMI, skeletal muscle index; SMM, skeletal muscle mass; T12, the 12th thoracic vertebra,
Group differences were analysed using one‐way ANOVA or the χ 2 test as appropriate.
Distribution of the creatinine/cystatin C ratio and sarcopenia index in the sarcopenia and non‐sarcopenia groups
In both men and women, the CCR and SI were lower in the sarcopenia group than in the non‐sarcopenia group (Figure 1).
Figure 1.
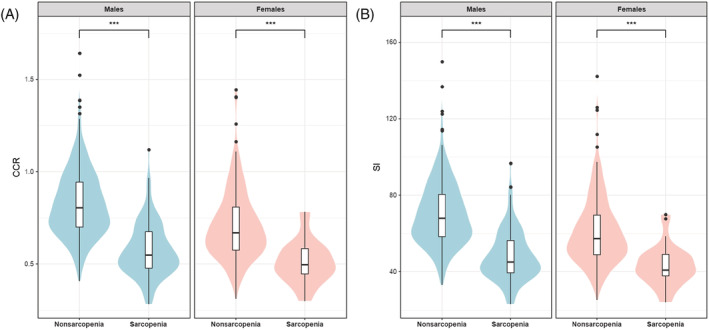
Violin plot and box‐plot analysis comparing the distribution of the CCR and SI in the sarcopenia and non‐sarcopenia groups. In both men and women, the (A) CCR and (B) SI were lower in the sarcopenia group than in the non‐sarcopenia group. CCR, serum creatinine/serum cystatin C ratio; SI, sarcopenia index.
Serum biomarkers, body composition, and handgrip strength
As shown in Table 2, both the CCR and SI were positively correlated with BMI, T12 SMA, T12 SMI, total SMM, trunk SMM, ASM, ASMI, and handgrip strength in both men and women.
Table 2.
Correlation coefficients of serum biomarkers with body composition and handgrip strength
| Characteristic | CCR | SI | ||
|---|---|---|---|---|
| r | P‐value | r | P‐value | |
| Men | ||||
| BMI, kg/m2 | 0.385 | <0.001 | 0.367 | <0.001 |
| T12 SMA, cm2 | 0.240 | <0.001 | 0.231 | <0.001 |
| T12 SMI, cm2/m2 | 0.226 | <0.001 | 0.214 | <0.001 |
| Total SMM, kg | 0.582 | <0.001 | 0.560 | <0.001 |
| Trunk SMM, kg | 0.208 | <0.001 | 0.201 | <0.001 |
| ASM, kg | 0.594 | <0.001 | 0.571 | <0.001 |
| ASMI, kg/m2 | 0.549 | <0.001 | 0.525 | <0.001 |
| Handgrip strength | 0.329 | <0.001 | 0.313 | <0.001 |
| Women | ||||
| BMI, kg/m2 | 0.171 | 0.014 | 0.143 | 0.041 |
| T12 SMA, cm2 | 0.260 | <0.001 | 0.250 | <0.001 |
| T12 SMI, cm2/m2 | 0.224 | <0.001 | 0.211 | 0.002 |
| Total SMM, kg | 0.432 | <0.001 | 0.390 | <0.001 |
| Trunk SMM, kg | 0.150 | <0.001 | 0.140 | 0.045 |
| ASM, kg | 0.421 | <0.001 | 0.378 | <0.001 |
| ASMI, kg/m2 | 0.373 | <0.001 | 0.332 | <0.001 |
| Handgrip strength | 0.198 | 0.004 | 0.191 | 0.006 |
ASM, appendicular skeletal muscle mass; ASMI, appendicular skeletal muscle mass index; BMI, body mass index; CCR, creatinine/cystatin C ratio; SI, sarcopenia index; SMA, skeletal muscle cross‐sectional area; SMI, skeletal muscle index (skeletal muscle area/height2); SMM, skeletal muscle mass; T12, the 12th thoracic vertebra.
Diagnostic accuracy of the creatinine/cystatin C ratio and sarcopenia index for sarcopenia
Figure 2 shows the results of the ROC analyses for the CCR and SI in the derivation set using AWGS 2019‐defined sarcopenia as the reference standard. The optimal CCR cutoff values generated from the derivation set were 0.623 for men (sensitivity: 69.6%, specificity: 88.8%) and 0.600 for women (sensitivity: 86.7%, specificity: 71.7%); the optimal SI cutoff values were 54.335 for men (sensitivity: 73.2%, specificity: 84.1%) and 51.742 for women (sensitivity: 86.7%, specificity: 67.9%) (Table 3). The AUCs of the CCR and SI were 0.837 [95% confidence interval (CI): 0.770–0.904] and 0.833 (95% CI: 0.765–0.901) for men and 0.808 (95% CI: 0.682–0.935) and 0.796 (95% CI: 0.668–0.924) for women, respectively. The differences between the CCR and SI AUCs were not statistically significant for men (P = 0.25) or women (P = 0.11).
Figure 2.
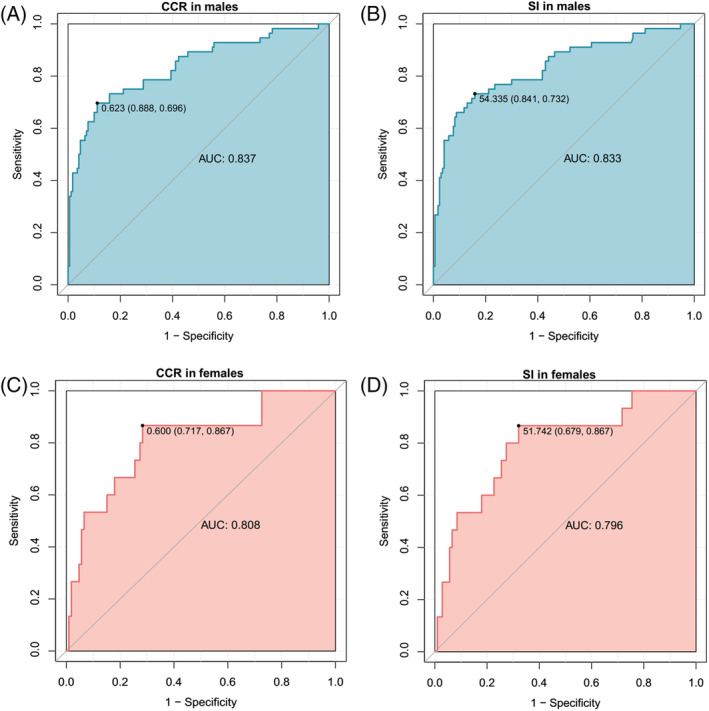
ROC curves of the CCR and SI for diagnosing sarcopenia in the derivation set. AUC, area under the ROC curve; CCR, serum creatinine/serum cystatin C ratio; ROC, receiver operating characteristic; SI, sarcopenia index.
Table 3.
Diagnostic accuracy of CCR and SI for predicting AWGS‐defined sarcopenia
| Derivation Set (n = 347) | Validation Set (n = 232) | |||||||
|---|---|---|---|---|---|---|---|---|
| Men (n = 226) | Women (n = 121) | Men (n = 148) | Women (n = 84) | |||||
| CCR | SI | CCR | SI | CCR | SI | CCR | SI | |
| Cut‐off | 0.623 | 54.335 | 0.600 | 51.742 | 0.623 | 54.335 | 0.600 | 51.742 |
| Sensitivity, % | 69.6 (57.1–71.4) | 73.2 (57.1–83.9) | 86.7 (60.0–100) | 86.7 (53.3–100) | 73.0 (59.5–86.5) | 75.7 (62.2–89.2) | 85.7 (64.3–100) | 92.9 (78.6–100) |
| Specificity, % | 88.8 (78.2–95.3) | 84.1 (77.7–95.9) | 71.7 (64.2–96.2) | 67.9 (60.4–95.3) | 93.7 (89.2–97.3) | 86.5 (80.2–91.9) | 65.7 (54.3–77.1) | 62.9 (51.4–74.3) |
| Accuracy, % | 84.1 (77.4–88.9) | 81.4 (77.0–89.4) | 73.6 (66.9–92.6) | 70.3 (63.6–92.6) | 88.5 (83.1–93.2) | 83.8 (78.3–89.2) | 69.0 (58.3–78.6) | 67.9 (58.3–77.4) |
| Positive predictive value, % | 67.2 (52.9–81.4) | 60.3 (52.8–83.3) | 30.3 (24.4–69.2) | 27.7 (22.8–66.7) | 79.4 (67.6–90.9) | 65.1 (54.1–76.9) | 33.3 (25.0–42.9) | 33.3 (26.7–42.4) |
| Negative predictive value, % | 89.9 (86.8–94.3) | 90.5 (86.7–94.3) | 97.4 (93.6–100) | 97.3 (93.1–100) | 91.2 (87.0–95.4) | 91.4 (86.9–95.9) | 95.8 (90.0–100) | 97.8 (93.2–100) |
Data are presented as percentages and 95% CI.
AWGS, Asian Working Group for Sarcopenia; CCR, creatinine/cystatin C ratio; CI, confidence interval; SI, sarcopenia index.
The prevalence of sarcopenia was 22.0% in the validation set. Using cutoff points generated from the derivation set, the diagnostic accuracy of the CCR and SI was evaluated in the validation set. The CCR achieved a sensitivity, specificity, accuracy, and positive and negative predictive values of 73.0%, 93.7%, 88.5%, 79.4% and 91.2% in men and corresponding values of 85.7%, 65.7%, 69.0%, 33.3% and 95.8% in women, respectively, when validated within the validation set. Similar results were found for the SI.
Furthermore, the decision curve analysis showed no statistically significant differences between the CCR and SI for identifying sarcopenia in the derivation and validation sets (Figure 3).
Figure 3.
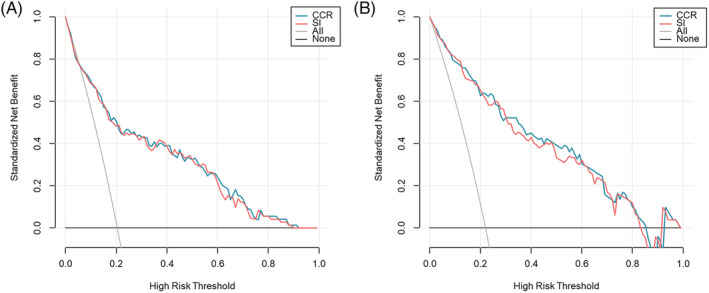
Decision curve analysis comparing the CCR and SI in the derivation (A) and validation (B) sets. No statistically significant difference was found between the CCR and SI for identifying sarcopenia. CCR, serum creatinine/serum cystatin C ratio; SI, sarcopenia index.
Associations between sarcopenia and overall survival
In the derivation set, CCR‐defined and AWGS‐defined sarcopenia were independently associated with a higher risk of mortality (HR = 1.42, 95% CI: 1.09–1.86; and HR = 1.41, 95% CI: 1.04–1.89, respectively) after adjusting for potential confounders. However, SI‐defined sarcopenia was not independently associated with a higher risk of mortality (HR = 1.26, 95% CI: 0.97–1.66). In the validation set, CCR‐defined, SI‐defined, and AWGS‐defined sarcopenia were independently associated with a higher risk of mortality (HR = 1.75, 95% CI: 1.25–2.44; HR = 1.55, 95% CI: 1.11–2.17; and HR = 1.76, 95% CI: 1.22–2.53, respectively) (Table 4).
Table 4.
Univariate and multivariate cox regression models for overall survival
| Univariate Analysis | Multivariate Analysis Model 1 | Multivariate Analysis Model 2 | |||||||
|---|---|---|---|---|---|---|---|---|---|
| HR | 95% CI | p‐value | HR | 95% CI | p‐value | HR | 95% CI | p‐value | |
| Derivation set | |||||||||
| CCR‐defined sarcopenia | 1.57 | 1.21–2.03 | 0.001 | 1.33 | 1.02–1.74 | 0.035 | 1.42 | 1.09–1.86 | 0.009 |
| SI‐defined sarcopenia | 1.52 | 1.17–1.98 | 0.002 | 1.16 | 0.89–1.53 | 0.276 | 1.26 | 0.97–1.66 | 0.089 |
| AWGS‐defined sarcopenia | 1.79 | 1.35–2.38 | <0.001 | 1.48 | 1.11–1.98 | 0.007 | 1.41 | 1.04–1.89 | 0.025 |
| Validation set | |||||||||
| CCR‐defined sarcopenia | 1.57 | 1.14–2.17 | 0.005 | 1.59 | 1.14–2.20 | 0.006 | 1.75 | 1.25–2.44 | 0.001 |
| SI‐defined sarcopenia | 1.31 | 0.95–1.82 | 0.098 | 1.40 | 1.01–1.96 | 0.045 | 1.55 | 1.11–2.17 | 0.010 |
| AWGS‐defined sarcopenia | 1.63 | 1.15–2.30 | 0.006 | 1.68 | 1.19–2.38 | 0.003 | 1.76 | 1.22–2.53 | 0.002 |
Abbreviations: AWGS, Asian Working Group for Sarcopenia; CCR, creatinine/cystatin C ratio; CI, confidence interval; HR, hazard ratio; SI, sarcopenia index.
Model 1: adjusted for age and sex.
Model 2: adjusted for age, sex, histologic type, cancer stage, Charlson co‐morbidity index, chemotherapy regimens, and patients who completed at least four courses of chemotherapy.
Figure 4 shows the survival curves of the participants in the sarcopenia and non‐sarcopenia groups in the derivation set (Figure 4A–C) and the validation set (Figure 4D–F). The log‐rank test indicated that, in both the derivation and validation set, the survival curve of the participants in the CCR‐defined sarcopenia group was statistically significantly different from that of the non‐sarcopenia group (Figure 4A, P < 0.001, and Figure 4D, P = 0.004); similar results were found for AWGS‐defined sarcopenia (Figure 4C, P < 0.001, and Figure 4F, P = 0.004). However, the survival curve of the participants in the SI‐defined sarcopenia group was not statistically significantly different from that of the non‐sarcopenia group in both the derivation set (Figure 4B, P = 0.100) and the validation set (Figure 4E, P = 0.090).
Figure 4.
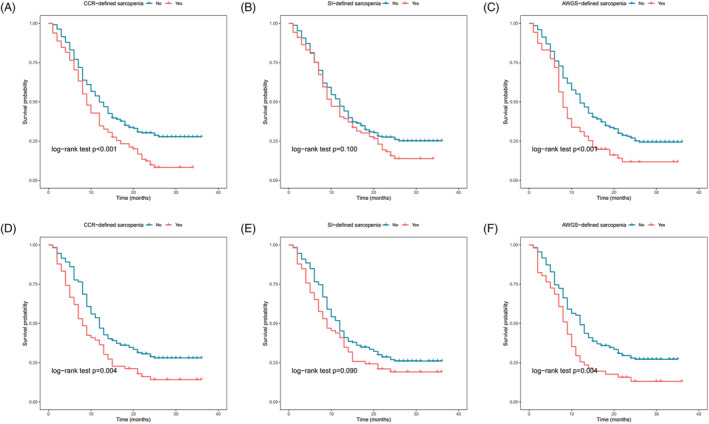
Survival curves for CCR‐defined, SI‐defined, and AWGS‐defined sarcopenia in the derivation and validation sets. Survival curves for CCR‐defined and AWGS‐defined sarcopenia statistically significantly differed in both the derivation (A,C) and validation (D,F) set via the log‐rank test. Survival curves for SI‐defined sarcopenia were not statistically significantly different in the derivation (B) and validation (E) sets. AWGS, Asian Working Group for Sarcopenia; CCR, serum creatinine/serum cystatin C ratio; SI, sarcopenia index.
Discussion
Our study demonstrated that the CCR and SI were positively correlated with muscle mass and handgrip strength in patients with advanced NSCLC; both had a satisfactory and comparable performance for detecting sarcopenia. Moreover, after adjusting for potential confounders, CCR‐defined, SI‐defined, and AWGS‐defined sarcopenia were all independent predictors for overall survival in the validation set. These findings indicated that both the CCR and SI could be used as surrogate biomarkers for evaluating sarcopenia in patients with NSCLC. However, according to the results of the survival curves, we found that the CCR may outperform SI in terms of predicting overall survival in patients with NSCLC.
As a highly accessible and repeatable biomarker, the CCR has been validated in different populations since 2015. 15 Several previous studies have confirmed that the CCR is correlated with CT‐derived or dual‐energy X‐ray absorptiometry‐derived SMM 30 , 31 and can predict sarcopenia in patients with type 2 diabetes. 32 The CCR may serve as a potentially valuable biomarker for predicting various adverse outcomes, such as treatment‐related adverse effects, 33 fractures, 20 hospitalizations, 19 and mortality among patients in the intensive care unit. 15 , 17 Our study findings, namely, that the CCR was positively correlated with SMM and independently associated with overall survival in advanced NSCLC patients, are thus in line with previous reports.
Because being proposed as a reliable biomarker of muscle mass in 2017 by Lien et al., 16 several studies have reported on the association between SI and low SMM or sarcopenia. In a retrospective study including 417 patients undergoing surgery for colorectal cancer, the SI was associated with SMM and a low SI was an independent risk factor for postoperative complications. 21 Additionally, this study showed that the correlation between the SI and SMA at the level of the third lumbar vertebra (r = 0.537, P < 0.001) was stronger than the correlation between the CCR and SMA at the third lumbar vertebra (r = 0.469, P < 0.001). 21 Recently, another cross‐sectional study recruited 182 patients with different types of solid tumours and found a positive correlation between the SI and sarcopenia (defined as low SMI plus low handgrip strength). 22 It also showed that, in comparison with the CCR, the SI had a stronger association with the SMA and SMI at the third lumbar vertebra as well as with handgrip strength. 22
Our finding that the SI was positively correlated with SMM and handgrip strength is in line with these previous findings; however, the SI did not show a stronger association with SMM and handgrip strength in comparison with the CCR in our cohort. Furthermore, our study revealed that the SI was independently associated with overall survival in advanced NSCLC patients in the validation set; no previous studies have addressed the potential association between the SI and survival in cancer patients. The survival curve of the participants in the SI‐defined sarcopenia group was not statistically significantly different from that of the non‐sarcopenia group in our study. Further studies are needed before a conclusion can be drawn.
Some studies have assessed the diagnostic values of the SI and CCR as well as proposed optimal cutoff values for sarcopenia. 21 , 22 , 34 In a previous study regarding the relationship between the CCR and annual chronic obstructive pulmonary disease exacerbation rates, the suggested CCR cutoff value for predicting AWGS‐defined sarcopenia was found to be 0.71 (sensitivity: 0.85, specificity: 0.81). 34 In another study conducted among Chinese patients with colorectal cancer, the sex‐specific SI cutoff values for predicting sarcopenia were 56.1 in men (sensitivity: 78.3%, specificity: 61.9%) and 43.7 in women (sensitivity: 76.1%, specificity: 68.4%). 21 However, in this study, sarcopenia was defined by sex‐specific SMI cutoff values based on Caucasian populations; this may have led to overestimating the prevalence of sarcopenia, hence leading to biased results. In another study among patients with advanced cancer, the proposed SI cutoff points were 56.0 in men (sensitivity: 57.5%, specificity: 87.6%) and 61.2 in women (sensitivity: 88.2%, specificity: 33.3%). 22 Not surprisingly, these CCR and SI cutoff values varied across studies due to differences in study populations and various sarcopenia definitions across studies.
To the best of our knowledge, no studies have been conducted comparing the diagnostic accuracy of the SI and CCR. Our study showed that both the CCR and SI had AUC values higher than or very close to 0.8 in both men and women, indicating that the CCR and SI had a moderate to high accuracy for predicting sarcopenia; this may be due to statistically significant correlations with both SMM and handgrip strength.
In our study, AWGS‐defined sarcopenia, measured using BIA, handgrip strength, and ECOG PS, was an independent predictor of overall survival. This finding implies that an ECOG PS ≥ 2 can also be used to define low physical performance when studying sarcopenia in cancer patients. However, further relevant studies are warranted to validate this hypothesis.
Our study has some limitations. First, this was a single‐centre study conducted among Chinese patients with advanced NSCLC; thus, the generalizability of our results may be limited. Well‐designed prospective studies are warranted to validate our findings in different ethnic populations at risk of sarcopenia, including cancer patients, patients with chronic obstructive pulmonary disease, and frail older adults. If further validated in other study populations, our findings may support CCR or SI as a convenient screening tool for sarcopenia in both large population studies and clinical settings because the measurement of CysC and creatinine is inexpensive and routinely performed in clinical practice. However, our study did not support CCR or SI as an outcome indicator, such as a surrogate to detect skeletal muscle mass change in interventional trials. Second, we defined low physical performance as an ECOG PS ≥ 2, which is not the usual method for assessing physical performance (e.g. measuring gait speed, administering the Short Physical Performance Battery, or conducting five‐time sit‐to‐stand tests). 23 However, the ECOG PS is a common tool for estimating physical performance within clinical practice worldwide.
In conclusion, the CCR and SI based on serum CysC and creatinine had considerable and remarkably similar overall diagnostic accuracy for sarcopenia in advanced NSCLC; however, we found that the CCR might outperform the SI in predicting overall survival in our study population. These findings imply that both the CCR and SI can serve as surrogate biomarkers for evaluating sarcopenia in cancer patients; however, the CCR or SI cutoff values for detecting sarcopenia may vary in different populations. As levels of creatinine and CysC are commonly assessed in clinical practice, the application of these tools may facilitate the early detection and targeted management of sarcopenia in patients with lung cancer.
Funding
This research was supported by the Post‐Doctor Research Project at West China Hospital (Sichuan University, grant 2018HXBH071), and the K&D Program of the Sichuan Science and Technology Department (grant 2020YFS0573). The funders had no role in the design, conduct, collection, management, analysis, or interpretation of the data, nor in the drafting, review, approval of the manuscript, or the decision to publish this study.
Conflict of interest
None declared.
Supporting information
Figure S1 Participant flow chart
Table S1. Baseline characteristics of the participants in the derivation set and validation set
Tang T., Xie L., Hu S., Tan L., Lei X., Luo X., Yang L., and Yang M. (2022) Serum creatinine and cystatin C‐based diagnostic indices for sarcopenia in advanced non‐small cell lung cancer, Journal of Cachexia, Sarcopenia and Muscle, 13, 1800–1810, 10.1002/jcsm.12977
References
- 1. Bray F, Ferlay J, Soerjomataram I, Siegel RL, Torre LA, Jemal A. Global cancer statistics 2018: GLOBOCAN estimates of incidence and mortality worldwide for 36 cancers in 185 countries. CA Cancer J Clin 2018;68:394–424. [DOI] [PubMed] [Google Scholar]
- 2. Reveiz L, Rueda JR, Cardona AF. Palliative endobronchial brachytherapy for non‐small cell lung cancer. Cochrane Database Syst Rev 2012;12:CD004284. [DOI] [PMC free article] [PubMed] [Google Scholar]
- 3. Bradley CJ, Yabroff KR, Mariotto AB, Zeruto C, Tran Q, Warren JL. Antineoplastic treatment of advanced‐stage non‐small‐cell lung cancer: treatment, survival, and spending (2000 to 2011). J Clin Oncol 2017;35:529–535. [DOI] [PMC free article] [PubMed] [Google Scholar]
- 4. Woodard GA, Jones KD, Jablons DM. Lung cancer staging and prognosis. In Reckamp K, ed. Lung Cancer. Cancer Treatment and Research, Vol. 170. Cham: Springer; 2016. p 47–75. [DOI] [PubMed] [Google Scholar]
- 5. Collins J, Noble S, Chester J, Coles B, Byrne A. The assessment and impact of sarcopenia in lung cancer: a systematic literature review. BMJ Open 2014;4:e003697. [DOI] [PMC free article] [PubMed] [Google Scholar]
- 6. Yang M, Shen Y, Tan L, Li W. Prognostic value of sarcopenia in lung cancer: a systematic review and meta‐analysis. Chest 2019;156:101–111. [DOI] [PubMed] [Google Scholar]
- 7. Cruz‐Jentoft AJ, Landi F, Topinková E, Michel JP. Understanding sarcopenia as a geriatric syndrome. Curr Opin Clin Nutr Metab Care 2010;13:1–7. [DOI] [PubMed] [Google Scholar]
- 8. Cruz‐Jentoft AJ, Baeyens JP, Bauer JM, Boirie Y, Cederholm T, Landi F, et al. Sarcopenia: European consensus on definition and diagnosis: report of the European Working Group on Sarcopenia in Older People. Age Ageing 2010;39:412–423. [DOI] [PMC free article] [PubMed] [Google Scholar]
- 9. Cruz‐Jentoft AJ, Bahat G, Bauer J, Boirie Y, Bruyère O, Cederholm T, et al. Sarcopenia: revised European consensus on definition and diagnosis. Age Ageing 2019;48:16–31. [DOI] [PMC free article] [PubMed] [Google Scholar]
- 10. Chen LK, Liu LK, Woo J, Assantachai P, Auyeung TW, Bahyah KS, et al. Sarcopenia in Asia: consensus report of the Asian Working Group for Sarcopenia. J Am Med Dir Assoc 2014;15:95–101. [DOI] [PubMed] [Google Scholar]
- 11. Studenski SA, Peters KW, Alley DE, Cawthon PM, McLean RR, Harris TB, et al. The FNIH sarcopenia project: rationale, study description, conference recommendations, and final estimates. J Gerontol A Biol Sci Med Sci 2014;69:547–558. [DOI] [PMC free article] [PubMed] [Google Scholar]
- 12. Fielding RA, Vellas B, Evans WJ, Bhasin S, Morley JE, Newman AB, et al. Sarcopenia: an undiagnosed condition in older adults. Current consensus definition: prevalence, etiology, and consequences. International Working Group on Sarcopenia. J Am Med Dir Assoc 2011;12:249–256. [DOI] [PMC free article] [PubMed] [Google Scholar]
- 13. Thongprayoon C, Cheungpasitporn W, Kashani K. Serum creatinine level, a surrogate of muscle mass, predicts mortality in critically ill patients. J Thorac Dis 2016;8:E305–E311. [DOI] [PMC free article] [PubMed] [Google Scholar]
- 14. Udy AA, Scheinkestel C, Pilcher D, Bailey M. The association between low admission peak plasma creatinine concentration and in‐hospital mortality in patients admitted to intensive care in Australia and New Zealand. Crit Care Med 2016;44:73–82. [DOI] [PubMed] [Google Scholar]
- 15. Kashani KB, Frazee EN, Kukrálová L, Sarvottam K, Herasevich V, Young PM, et al. Evaluating muscle mass by using markers of kidney function: development of the sarcopenia index. Crit Care Med 2017;45:e23–e29. [DOI] [PubMed] [Google Scholar]
- 16. Lien YH. Looking for sarcopenia biomarkers. Am J Med 2017;130:502–503. [DOI] [PubMed] [Google Scholar]
- 17. Barreto EF, Kanderi T, DiCecco SR, Lopez‐Ruiz A, Poyant JO, Mara KC, et al. Sarcopenia index is a simple objective screening tool for malnutrition in the critically ill. JPEN J Parenter Enteral Nutr 2019;43:780–788. [DOI] [PMC free article] [PubMed] [Google Scholar]
- 18. Tang T, Zhuo Y, Xie L, Wang H, Yang M. Sarcopenia index based on serum creatinine and cystatin C is associated with 3‐year mortality in hospitalized older patients. Sci Rep 2020;10:1260. [DOI] [PMC free article] [PubMed] [Google Scholar]
- 19. Amado CA, García‐Unzueta MT, Lavin BA, Guerra AR, Agüero J, Ramos L, et al. The ratio serum creatinine/serum cystatin C (a surrogate marker of muscle mass) as a predictor of hospitalization in chronic obstructive pulmonary disease outpatients. Respiration 2019;97:302–309. [DOI] [PubMed] [Google Scholar]
- 20. Komorita Y, Iwase M, Fujii H, Ide H, Ohkuma T, Jodai‐Kitamura T, et al. The serum creatinine to cystatin C ratio predicts bone fracture in patients with type 2 diabetes: the Fukuoka Diabetes Registry. Diabetes Res Clin Pract 2018;146:202–210. [DOI] [PubMed] [Google Scholar]
- 21. Yang J, Zhang T, Feng D, Dai X, Lv T, Wang X, et al. A new diagnostic index for sarcopenia and its association with short‐term postoperative complications in patients undergoing surgery for colorectal cancer. Colorectal Dis 2019;21:538–547. [DOI] [PubMed] [Google Scholar]
- 22. Fu X, Tian Z, Wen S, Sun H, Thapa S, Xiong H, et al. A new index based on serum creatinine and cystatin C is useful for assessing sarcopenia in patients with advanced cancer. Nutrition 2021;82:111032. [DOI] [PubMed] [Google Scholar]
- 23. Chen LK, Woo J, Assantachai P, Auyeung TW, Chou MY, Iijima K, et al. Asian Working Group for Sarcopenia: 2019 consensus update on sarcopenia diagnosis and treatment. J Am Med Dir Assoc 2020;21:300–7.e2. [DOI] [PubMed] [Google Scholar]
- 24. von Elm E, Altman DG, Egger M, Pocock SJ, Gøtzsche PC, Vandenbroucke JP, et al. The Strengthening the Reporting of Observational Studies in Epidemiology (STROBE) statement: guidelines for reporting observational studies. Int J Surg 2014;12:1495–1499. [DOI] [PubMed] [Google Scholar]
- 25. Ma YC, Zuo L, Chen JH, Luo Q, Yu XQ, Li Y, et al. Modified glomerular filtration rate estimating equation for Chinese patients with chronic kidney disease. J Am Soc Nephrol 2006;17:2937–2944. [DOI] [PubMed] [Google Scholar]
- 26. Charlson ME, Pompei P, Ales KL, MacKenzie CR. A new method of classifying prognostic comorbidity in longitudinal studies: development and validation. J Chronic Dis 1987;40:373–383. [DOI] [PubMed] [Google Scholar]
- 27. Perkins NJ, Schisterman EF. The inconsistency of “optimal” cutpoints obtained using two criteria based on the receiver operating characteristic curve. Am J Epidemiol 2006;163:670–675. [DOI] [PMC free article] [PubMed] [Google Scholar]
- 28. Linden A. Measuring diagnostic and predictive accuracy in disease management: an introduction to receiver operating characteristic (ROC) analysis. J Eval Clin Pract 2006;12:132–139. [DOI] [PubMed] [Google Scholar]
- 29. DeLong ER, DeLong DM, Clarke‐Pearson DL. Comparing the areas under two or more correlated receiver operating characteristic curves: a nonparametric approach. Biometrics 1988;44:837–845. [PubMed] [Google Scholar]
- 30. Barreto EF, Poyant JO, Coville HH, Dierkhising RA, Kennedy CC, Gajic O, et al. Validation of the sarcopenia index to assess muscle mass in the critically ill: a novel application of kidney function markers. Clin Nutr 2019;38:1362–1367. [DOI] [PubMed] [Google Scholar]
- 31. Yanishi M, Kinoshita H, Tsukaguchi H, Kimura Y, Koito Y, Sugi M, et al. The creatinine/cystatin C ratio provides effective evaluation of muscle mass in kidney transplant recipients. Int Urol Nephrol 2019;51:79–83. [DOI] [PubMed] [Google Scholar]
- 32. Osaka T, Hamaguchi M, Hashimoto Y, Ushigome E, Tanaka M, Yamazaki M, et al. Decreased the creatinine to cystatin C ratio is a surrogate marker of sarcopenia in patients with type 2 diabetes. Diabetes Res Clin Pract 2018;139:52–58. [DOI] [PubMed] [Google Scholar]
- 33. Suzuki K, Furuse H, Tsuda T, Masaki Y, Okazawa S, Kambara K, et al. Utility of creatinine/cystatin C ratio as a predictive marker for adverse effects of chemotherapy in lung cancer: a retrospective study. J Int Med Res 2015;43:573–582. [DOI] [PubMed] [Google Scholar]
- 34. Hirai K, Tanaka A, Homma T, Goto Y, Akimoto K, Uno T, et al. Serum creatinine/cystatin C ratio as a surrogate marker for sarcopenia in patients with chronic obstructive pulmonary disease. Clin Nutr 2021;40:1274–1280. [DOI] [PubMed] [Google Scholar]
Associated Data
This section collects any data citations, data availability statements, or supplementary materials included in this article.
Supplementary Materials
Figure S1 Participant flow chart
Table S1. Baseline characteristics of the participants in the derivation set and validation set