

Abstract
Background
Sarcopenia is characterized by the loss of skeletal muscle mass and strength and is associated with poor prognosis in patients with chronic obstructive pulmonary disease (COPD). Cigarette smoke (CS) exposure, a major cause for COPD, induces mitochondrial damage, which has been implicated in sarcopenia pathogenesis. The current study sought to examine the involvement of insufficient Parkin‐mediated mitophagy, a mitochondrion‐selective autophagy, in the mechanisms by which dysfunctional mitochondria accumulate with excessive reactive oxygen species (ROS) production in the development of COPD‐related sarcopenia.
Methods
The involvement of Parkin‐mediated mitophagy was examined using in vitro models of myotube formation, in vivo CS‐exposure model using Parkin−/− mice, and human muscle samples from patients with COPD‐related sarcopenia.
Results
Cigarette smoke extract (CSE) induced myotube atrophy with concomitant 30% reduction in Parkin expression levels (P < 0.05). Parkin‐mediated mitophagy regulated myotube atrophy by modulating mitochondrial damage and mitochondrial ROS production. Increased mitochondrial ROS was responsible for myotube atrophy by activating Muscle Ring Finger 1 (MuRF‐1)‐mediated myosin heavy chain (MHC) degradation. Parkin−/− mice with prolonged CS exposure showed enhanced limb muscle atrophy with a 31.7% reduction in limb muscle weights (P < 0.01) and 2.3 times greater MuRF‐1 expression (P < 0.01) compared with wild‐type mice with concomitant accumulation of damaged mitochondria and oxidative modifications in 4HNE expression. Patients with COPD‐related sarcopenia exhibited significantly reduced Parkin but increased MuRF‐1 protein levels (35% lower and 2.5 times greater protein levels compared with control patients, P < 0.01 and P < 0.05, respectively) and damaged mitochondria accumulation demonstrated in muscles. Electric pulse stimulation‐induced muscle contraction prevented CSE‐induced MHC reduction by maintaining Parkin levels in myotubes.
Conclusions
Taken together, COPD‐related sarcopenia can be attributed to insufficient Parkin‐mediated mitophagy and increased mitochondrial ROS causing enhanced muscle atrophy through MuRF‐1 activation, which may be at least partly preventable through optimal physical exercise.
Keywords: COPD, Parkin, Muscle atrophy, Cigarette smoke, Muscle contraction
Introduction
Chronic obstructive pulmonary disease (COPD) mainly caused by cigarette smoke (CS) exposure is the third leading cause of death worldwide. 1 This condition can be clinically characterized by not only respiratory symptoms caused by progressive airflow limitation but also a variety of extrapulmonary co‐morbidities, 2 , 3 which have been increasingly recognized as important determinants for impaired activities of daily living and have also been associated with poor prognosis in patients with COPD. 4 Sarcopenia, which is characterized by the loss of skeletal muscle mass and strength, is a frequent extrapulmonary co‐morbidity, the prevalence of which has been estimated at 21.6% in patients with COPD but can range from 8% in population‐based studies to 63% in patients residing in nursing homes. 5 Sarcopenia, which affects both ventilatory and non‐ventilatory muscles, causes physical inactivity, resulting in increased hospitalization and mortality rates. 6 , 7 , 8 , 9 Accordingly, elucidating the molecular mechanisms for COPD‐related sarcopenia could provide insights that would help in not only understanding its pathophysiology but also developing new treatment modalities for reducing COPD mortality associated with sarcopenia.
Increased degradation of intracellular protein is one of the hallmarks of muscle atrophy, resulting in the loss of skeletal muscle mass. 3 , 10 Intracellular protein degradation is regulated through two major pathways: the ubiquitin–proteasome (UP) pathway and the autophagy‐lysosome (AL) pathway. 11 , 12 Studies have shown that the UP pathway is involved in limb muscle atrophy of patients with COPD, which can be attributed to increased activity of muscle‐specific E3 ubiquitin ligase [atrogin‐1 and Muscle Ring Finger 1 (MuRF‐1)]. 11 , 12 , 13 Additionally, the AL pathway has also been recognized to contribute to muscle atrophy in patients with COPD. 12 Muscle‐specific deletion of Atg7 or Atg5, crucial components for autophagosome formation, caused severe muscle weakness and atrophy accompanied by accumulation of abnormal mitochondria and polyubiquitinated proteins. 14 , 15 One previous study showed increased oxidative stress in the muscles of patients with COPD, 16 while another found that CS exposure can cause mitochondrial respiratory chain dysfunction complicated with enhanced reactive oxygen species (ROS) production, 17 indicating the potential involvement of mitophagy, a mitochondrion‐selective autophagy that maintains mitochondrial integrity, in regulating muscle atrophy during COPD pathogenesis. However, the exact role of mitophagy in the pathogenesis of COPD‐related sarcopenia remains obscure.
Mitophagy is a mechanism through which dysfunctional mitochondria are selectively delivered for lysosomal degradation, with the PINK1–Parkin (an E3‐ubiquitin ligase) pathway playing an essential role therein. 18 , 19 Parkin‐mediated ubiquitination of mitochondrial substrates is a key step for recognition by SQSTM1/p62, an adaptor protein that can also bind microtubule‐associated protein 1 light chain 3 (MAP 1LC3/LC3) on phagophores for selective sequestration of damaged mitochondria by autophagosomes. 18 We had previously demonstrated the involvement of Parkin‐mediated mitophagy in the regulation of CS‐induced cellular senescence during COPD pathogenesis. 20 , 21 Intriguingly, recent reports have shown that Parkin overexpression induces muscle hypertrophy, whereas Parkin knockout results in muscle atrophy. 22 , 23 Accordingly, we hypothesized that insufficient Parkin‐mediated mitophagy is involved in the mechanisms by which dysfunctional mitochondria accumulate with excessive ROS production in the development of COPD‐related sarcopenia.
The present study examined the involvement of Parkin‐mediated mitophagy in muscle atrophy using in vitro models of myotube formation, an in vivo CS‐exposure model using Parkin knockout mice, and human muscle samples form patients with COPD‐related sarcopenia.
Materials and methods
Cell culture, antibodies, and reagents
C2C12 mouse myoblasts were cultured in Dulbecco's modified Eagle medium (DMEM) (Gibco Life Technologies, 11965‐092) with 10% fetal bovine serum and penicillin‐streptomycin (Gibco Life Technologies, 15140‐122). For differentiation, the medium was changed to differentiation medium (DMEM supplemented with 2% horse serum and penicillin–streptomycin).
Antibodies used included rabbit anti‐Parkin (Cell Signaling Technology, 2132), rabbit anti‐4 hydroxynonenal (Abcam, ab46545), rabbit anti‐TOMM20 (Proteintech, 11802‐1‐AP), rabbit anti‐Laminin (Abcam #11575), rabbit anti‐GAPDH (Cell Signaling Technology, #5174), mouse anti‐MuRF‐1 (Santa‐Cruz, sc398608), mouse anti‐MHC (R&D Systems, MAB 4470), rabbit anti‐Beclin‐1 (MBL, PD017), rabbit anti‐PINK1 (Abcam, ab23707), rabbit anti‐LC3B (Novus, NB600‐1384), mouse anti‐PGC1a (Proteintech, 66369‐1‐Ig), and rabbit anti‐p62 (MBL, PM045). DAPI (Invitrogen, #R37606), MitoSOX Red (Molecular Probes‐Life technologies, M36008), MitoTracker Red CMXRos (200 nM for 30 min, Invitrogen, M7512), Mito‐TEMPO (Enzo Life Sciences, ALX‐430‐150), CM‐H2DCFDA (10 μM for 30 min at 37°C, Life Technologies, C6827), pepstatin A (Peptide Institute, #4397) and E64d (Peptide Institute, #4321‐v) were purchased.
Preparation of cigarette smoke extract
Cigarette smoke extracts (CSEs) were prepared as previously described. 24 Differentiated myotubes were pretreated with either 100 μM Mito‐TEMPO or an equal volume of DMSO for 6 h before CSE exposure.
Plasmids, siRNA, and transfection
LC3B cDNA was a kind gift from Dr. Mizushima (Tokyo University, Tokyo, Japan) and Dr. Yoshimori (Osaka University, Osaka, Japan) and was cloned into the pEGFP‐C1 vector. 25 The Parkin (PARK2) expression vector and negative control vector were purchased from Nova Lifetech (#PVTB500005‐2a and #PVT27427). Small interfering RNA (siRNA) targeting PARK2 (Applied Biosystems Life Technologies, s78528, s78528), TRIM63 (Applied Biosystems Life Technologies, s119560, s119561), and negative control siRNA (Applied Biosystems Life Technologies, AM4635) were purchased from Life Technologies. Specific knockdowns of PARKS and TRIM63 were validated using two different siRNAs. For siRNA transfection experiments, 48‐h differentiated myotubes were transfected with 20 nM of each siRNA solution using Lipofectamine 3000 (Invitrogen Life Technologies, L3000015) for 72 h according to the manufacturer's instructions, after which the medium was changed to 2% CSE containing differentiation medium for 48 h and cells were harvested for analysis.
Muscle contraction protocol
We adopted the C2C12 myotube contraction system as previously described. 26 After myotube formation, the myotubes were stimulated with 20‐ms electric pulses of 10 V at 1 Hz for 1 h generated by an electrical pulse generator (SEN‐3301, Nihon Kohden, Tokyo, Japan). 26 Myotubes were cultured for 2 days after contraction, and cell lysates were collected for western blotting.
Mitochondria isolation
Mitochondrial fractions were isolated from myotubes with a commercially available kit (Thermo Fisher Scientific, 89874) according to the manufacturer's instructions.
Mouse models and cigarette smoke exposure protocol
Wild‐type (C57BL/6J: CLEA Japan INC, Tokyo, Japan) and Parkin knockout (Parkin KO: B6.129S4‐Prkn tm1Shn/J: Jackson Laboratories, Bar Harbor, ME) mice were purchased and maintained at the animal facility of the Jikei University School of Medicine. All experimental procedures were ethically approved by the Jikei University School of Medicine Animal Care Committee. All mice used in this study were age‐matched and female. Accordingly, 6‐ to 8‐week‐old mice were exposed to CS using a whole‐body exposure system (SCIREQ ‘InExpose’) within a barrier facility. Mice were exposed to CS at 200 mg/m3 of total suspended particles using research cigarettes (University of Kentucky 3R4F research cigarettes) 5 days a week for 6 months. Age‐matched and room air‐exposed mice served as non‐smoking controls. Wire hanging time was performed as previously reported. 27 For hindlimb muscle weight analysis, left and right hindlimb muscles were averaged and normalized to the averaged tibia lengths. Tissue samples were snap frozen in liquid nitrogen for biochemical analyses or embedded in OCT using liquid nitrogen‐cooled isopentane for histological analysis and stored at −80°C.
Human muscle evaluation
Patients with femoral neck fractures who underwent bipolar hip arthroplasty (BHA) were recruited for this study. COPD was diagnosed based on a previous smoking history (>10 pack‐years) and a pulmonary function test showing irreversible airflow obstruction (FEV1.0/FVC < 70%). Patients with co‐morbidities that could be associated with muscle atrophy, such as active inflammatory illness, severe heart failure, severe diabetes, or severe chronic renal failure, were excluded. Informed consent was obtained from all surgical participants as part of an approved ongoing research protocol by the ethical committee of the Jikei University School of Medicine [30‐361(9382)].
Dual‐energy X‐ray absorptiometry (Prodigy FUGA, GE Healthcare, Tokyo, Japan) and Smedley's dynamometer (Hata Sporting Goods Ind., Ltd, Osaka, Japan) were used to measure skeletal muscle mass index and grip strength, respectively. Sarcopenia was diagnosed using the guideline released by the Asian Working Group for Sarcopenia (AWGS 2019). 28 Muscle biopsies were performed on the gluteus maximus muscle during BHA.
Electron microscopic evaluation
Electron microscopy was performed as previously described. 29
The procedures of immunofluorescence and immunohistochemistry staining, western blotting, and statistical analysis are provided in the extended materials and methods section in the supporting information.
Results
Cigarette smoke extract‐induced mitochondrial reactive oxygen species production induced atrophic changes in myotubes
To understand the effects of CS exposure on muscle atrophy, we used the myotube model transformed from C2C12 cells, an immortalized mouse myoblast cell line. After 5 days of culture with the differentiation medium, myotube formation was morphologically confirmed (Figure 1A). After myotube formation, CSE (2%) treatment was performed for 48 h. Accordingly, CSE treatment significantly decreased protein expression levels of the myosin heavy chain (MHC), a multigene family of muscle protein comprising myosin, in the myotubes as determined by Western blotting (Figure 1B). Immunofluorescence staining showed that CSE‐treated myotubes had not only lower MHC expression but also significantly smaller diameters compared with untreated myotubes (Figure 1C), indicating that CSE is capable of inducing myotube atrophy representing muscle atrophy.
Figure 1.
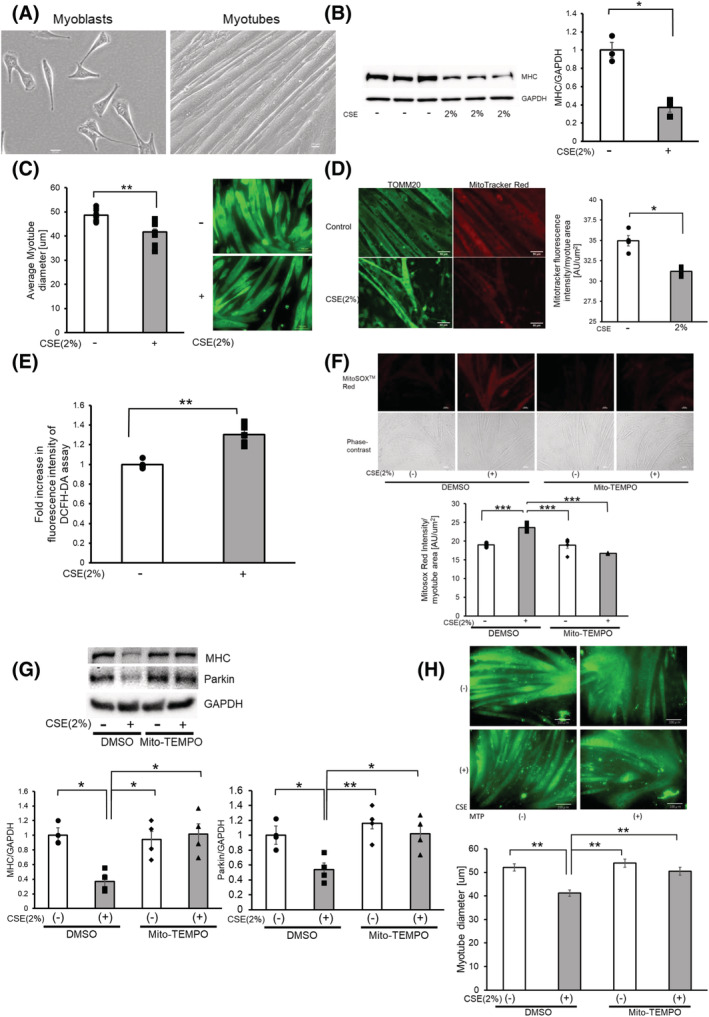
CSE induces mitochondrial damage and ROS production accompanied by myotube atrophy. (A) Phase‐contrast images of myoblasts and myotubes. Myoblasts were differentiated for 5 days to form myotubes. Bar: 20 μm. (B) Western blotting (WB) using anti‐MHC and anti‐GAPDH in control‐treated (Lanes 1 to 3) and CSE (2% for 48 h)‐treated (Lanes 4 to 6) myotubes. The right panel shows the average (±SEM) of the relative decrease in MHC normalized to GAPDH, determined from densitometric analysis of WB from three independent experiments. Open bars indicate no treatment, whereas filled bars indicate CSE treatment. *P < 0.05. (C) Images of immunofluorescent staining of MHC in 2% CSE‐treated myotubes for 48 h. Bar: 100 μm. The left panel shows the average (±SEM) of the myotube diameter. The diameter of 10 randomly selected myotubes were averaged using five images. Open bars indicate no treatment, whereas filled bars indicate CSE treatment. **P < 0.01. (D) Fluorescence microscope images of TOMM20 staining of mitochondria (left panels) and MitoTracker Red staining (right panels). Myotubes were treated with CSE (2%) for 48 h (lower panels) or control (upper panels). Bar: 50 μm. MitoTracker Red staining was quantified using BZ‐X800 analyzer and normalized by the area of the myotube (rightmost panel). (E) Fluorescence intensity of DCFH‐DA staining for intracellular ROS production of myotubes in response to CSE exposure. The fluorescence level in the control‐treated myotubes was designated as 1.0. **P < 0.01. (F) Fluorescence microscope images of MitoSOX Red staining for mitochondrial ROS production (uppermost panels), and phase‐contrast images of myotubes (middle panels). Myotubes were pretreated with Mito‐TEMPO (100 μM) for 6 h before CSE exposure (2% for 24 h). Bar: 50 μm. MitoSOX Red staining was quantified using BZ‐X800 analyzer and normalized by the area of the myotube (bottom panel). (G) WB using anti‐MHC, anti‐Parkin, and anti‐GAPDH in DMSO‐treated (Lanes 1 and 2), and Mito‐TEMPO (100 μM)‐treated myotubes (Lanes 3 and 4). Pretreatment with Mito‐TEMPO (100 μM) for 6 h before CSE exposure (2% for 48 h). The lower left panel shows the average (±SEM) of the relative expression in MHC normalized to GAPDH, which was determined from densitometric analysis of WB from four independent experiments. The lower right panel shows the average (±SEM) of the relative expression in Parkin normalized to GAPDH, which was determined from densitometric analysis of WB from four independent experiments. Open bars indicate no treatment, whereas filled bars indicate CSE treatment. *P < 0.05; **P < 0.01. (H) Images of immunofluorescent staining of MHC in myotubes treated with PBS (upper panels) and CSE (2%) for 48 h (lower panels) with the addition of DMSO (left column) and Mito‐TEMPO (right column). Bar: 100 μm. Bottom panels show the average (±SEM) of the myotube diameter. The diameter of 10 randomly selected myotubes were measured using nine images. Open bars indicate no treatment, whereas filled bars indicate CSE‐treated treatment. **P < 0.01.
To examine the relationship between mitochondrial damage and myotube atrophy caused by CSE exposure, MitoTracker Red staining was performed to determine the integrity of mitochondrial membrane potential. Compared with TOMM20 staining, MitoTracker Red staining showed a lower mitochondrial outer membrane protein in 2% CSE‐treated myotubes, which may reflect CSE‐mediated mitochondrial membrane damage causing depolarization (Figure 1D). Concomitantly, increased ROS production as determined by the DCFH‐DA assay for total ROS and by MitoSOX Red staining for mitochondrial ROS was demonstrated in 2% CSE‐treated myotubes (Figure 1E,F). To elucidate the involvement of increased ROS in CSE‐induced myotube atrophy, we used Mito‐TEMPO, a specific antioxidant for mitochondrial ROS. Mito‐TEMPO efficiently inhibited the increase in mitochondrial ROS production and prevented myotube atrophy as evaluated by Western blotting and immunofluorescence staining of MHC in response to CSE exposure (Figure 1F–H). These data suggest that CSE induces mitochondrial ROS production by accumulating mitochondrial damage, which is involved in the mechanisms for myotube atrophy in response to CSE exposure.
Parkin‐mediated mitophagy regulates mitochondrial ROS production and atrophic changes in myotubes during CSE exposure
Mitophagy plays a crucial role in maintaining mitochondrial integrity, with our previous findings suggesting the involvement of reduced Parkin‐mediated mitophagy in regulating airway epithelial cell senescence in COPD pathogenesis. 20 , 21 To clarify the mechanisms for increased mitochondrial ROS production and atrophic changes in myotubes during CSE exposure, we focused on Parkin‐mediated mitophagy. Firstly, after examining alterations in Parkin expression levels, we found that CSE (2%) treatment significantly reduced Parkin at the protein and mRNA levels (Figure 2A,B). Accordingly, after employing Parkin siRNA for functional evaluation of Parkin‐mediated mitophagy, efficient knockdown of Parkin in the myotubes was found via Western blotting (Figure 2C). Parkin knockdown significantly enhanced CSE‐induced mitochondrial ROS production detected using DCFH‐DA assay and MitoSOX Red staining (Figure 2D,E). Parkin knockdown also significantly enhanced atrophic changes in the myotubes following CSE exposure, as shown by further diminished myotube diameter (Figure 2F) and reduced MHC protein levels (Figure 2G). To confirm the participation of Parkin in regulating atrophic changes in the myotubes, Parkin overexpression experiments were also conducted by transfecting the Parkin HA expression vector. Accordingly, Parkin overexpression significantly suppressed CSE‐induced mitochondrial ROS production detected using DCFH‐DA assay and MitoSOX Red staining (Figure 2H,I). Parkin overexpression also significantly prevented atrophic changes in the myotubes caused by CSE exposure, which was determined using the diameter of myotubes (Figure 2J) and MHC protein levels (Figure 2K).
Figure 2.
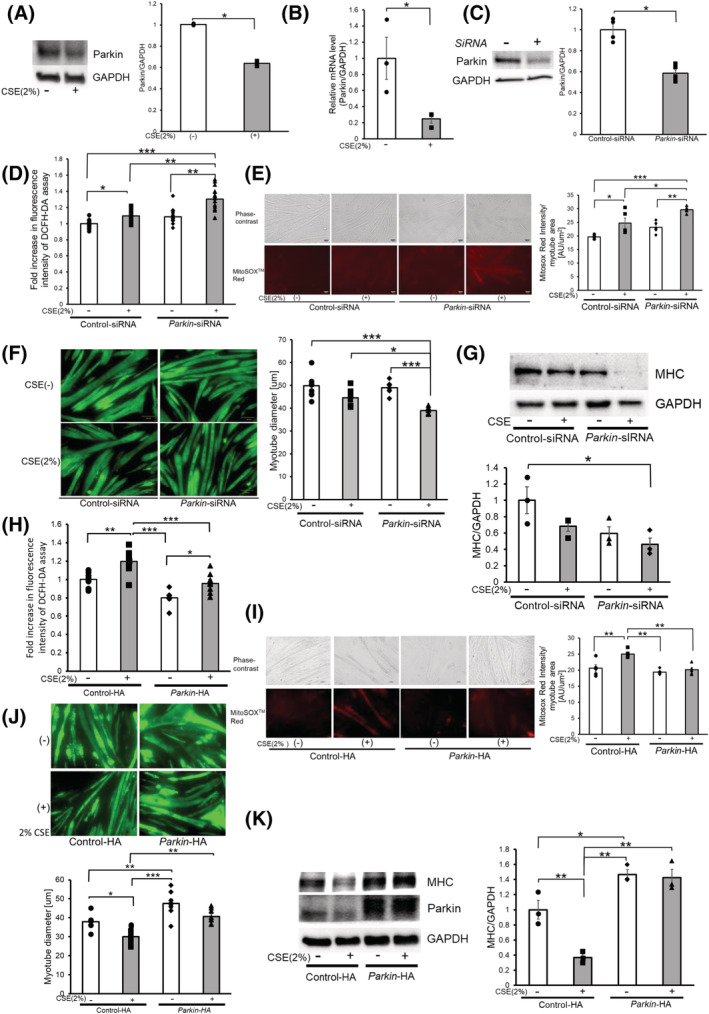
Parkin‐mediated mitophagy regulates mitochondrial ROS production and atrophic changes in myotubes during CSE exposure. (A) WB using anti‐Parkin and anti‐GAPDH in control‐treated (Lane 1) and CSE (2% for 48 h)‐treated (Lane 2) myotubes. The right panel shows the average (±SEM) of the relative decrease in Parkin normalized to GAPDH, determined from densitometric analysis of WB from 3 independent experiments. Open bars indicate no treatment, whereas filled bars indicate CSE treatment. *P < 0.05. (B) Real‐time PCR using mouse Parkin and GAPDH primers in control‐treated (Lane 1) and CSE (2% for 48 h)‐treated (Lane 2) myotubes. The panel shows the average (±SEM) of the relative expression in Parkin normalized to GAPDH, which were determined taken from three independent experiments. Open bars indicate no treatment, whereas filled bars indicate CSE treatment. *P < 0.05. (C) WB using anti‐Parkin and anti‐GAPDH in control siRNA‐treated (Lane 1) and Parkin siRNA‐treated (Lane 2) myotubes. The right panel shows the average (±SEM) of the relative decrease in Parkin normalized to GAPDH, determined from densitometric analysis of WB from three independent experiments. Open bars indicate no treatment, whereas filled bars indicate CSE treatment. *P < 0.05. (D) Fluorescence intensity of DCFH‐DA staining for intracellular ROS production of myotubes in response to CSE exposure. Myotubes were transfected with nonsilencing control siRNA and Parkin siRNA, and CSE treatment (2% for 48 h) was started 72 h post‐transfection. The fluorescence level in the control‐treated myotubes was designated as 1.0, and shown in panel is the average (±SEM). Open bars indicate no treatment, whereas filled bars indicate CSE treatment. *P < 0.05, **P < 0.01, ***P < 0.001. (E) Phase‐contrast images of myotubes (upper panels) and fluorescence microscope detection of MitoSOX Red staining for mitochondrial ROS production (lower panels) in control or CSE (2%)‐treated myotubes. Myotubes were transfected with nonsilencing control siRNA and Parkin siRNA, and CSE treatment (2% for 24 h) was started 72 h post‐transfection. Bar: 50 μm. MitoSOX Red staining was quantified using BZ‐X800 analyzer and normalized by the area of the myotube (rightmost panel). (F) Images of immunofluorescent staining of MHC in control (upper panels) or CSE (2%)‐treated (lower panels) myotubes. Bar: 100 μm. Myotubes were transfected with nonsilencing control siRNA and Parkin siRNA, and CSE treatment (2% for 48 h) was started 72 h post‐transfection. The right panel shows the average (±SEM) of the myotube diameter. The diameters of 10 randomly selected myotubes were averaged using nine images per group. Open bars indicate no treatment, whereas filled bars indicate CSE treatment. *P < 0.05; **P < 0.01. (G) WB using anti‐MHC and anti‐GAPDH in PBS‐treated (Lanes 1 and 2), and CSE (2% for 48 h)‐treated (Lanes 3 and 4) myotubes. Myotubes were transfected with nonsilencing control siRNA and Parkin siRNA, and CSE treatment was started 72 h post‐transfection. The lower panel shows the average (±SEM) of the relative decrease in MHC normalized to GAPDH, determined from densitometric analysis of WB from three independent experiments. Open bars indicate no treatment, whereas filled bars indicate CSE treatment. *P < 0.05. (H) Fluorescence intensity of DCFH‐DA staining for intracellular ROS production of myotubes in response to CSE exposure. Myotubes were transfected with control vector (Lanes 1 and 2) and Parkin HA expression vector (Lanes 3 and 4). CSE treatment (2% for 48 h) was started 72 h post‐transfection. The fluorescence level in the control‐treated myotubes was designated as 1.0, and shown in panel is the average (±SEM). Open bars indicate no treatment, whereas filled bars indicate CSE treatment. *P < 0.05, **P < 0.01, ***P < 0.001. (I) Phase‐contrast images of myotubes (upper panels) and fluorescence microscope detection of MitoSOX Red staining for mitochondrial ROS production (lower panels) in control or CSE (2%)‐treated myotubes. Myotubes were transfected with control vector (Lanes 1 and 2) and Parkin HA expression vector (Lanes 3 and 4). CSE treatment (2% for 24 h) was started 72 h post‐transfection. Bar: 50 μm. MitoSOX Red staining was quantified using BZ‐X800 analyzer and normalized by the area of the myotube (rightmost panel). (J) Images of immunofluorescent staining of MHC in control or CSE (2%)‐treated myotubes. Bar: 100 μm. The lower panel shows the average (±SEM) of the myotube diameter. The diameters of 10 randomly selected myotubes from 1 image were measured at the maximum width using ImageJ software (NIH, Bethesda, MD) and averaged using 3 images per experiment. This was repeated from seven independent experiments. Open bars indicate no treatment, whereas filled bars indicate CSE treatment. **P < 0.01; **P < 0.01. (K) WB using anti‐MHC, and anti‐GAPDH in control‐treated (Lanes 1 and 2), and CSE (2% for 48 h)‐treated (Lanes 3 and 4) myotubes. Myotubes were transfected with control vector (Lanes 1 and 2) and Parkin HA expression vector (Lanes 3 and 4), and CSE treatment was started 72 h post‐transfection. The right panel shows the average (±SEM) of the relative increase in MHC normalized to GAPDH, determined from densitometric analysis of WB from three independent experiments. Open bars indicate no treatment, whereas filled bars indicate CSE treatment. *P < 0.05; **P < 0.01.
To clarify the involvement of autophagic mitochondrial degradation during Parkin modulation, mitophagy and accumulation of mitochondria were examined. CSE treatment in the myotubes with Parkin knockdown increased mitochondrial mass detected using significantly elevated TOMM20 protein levels (Figure 3A), which was clearly suppressed by Parkin overexpression (Figure 3B). CSE treatment in the myotubes with Parkin knockdown also significantly increased the PINK1 and p62 protein levels (Figure 3C), which may reflect the accumulation of damaged mitochondria due to insufficient Parkin‐mediated mitophagy. CSE‐induced accumulation of ubiquitinated proteins and p62 in the mitochondrial fraction was significantly reduced by Parkin knockdown, indicating the involvement of Parkin in the regulation of ubiquitination and p62 accumulation during CSE‐mediated mitophagy (Figure 3D). Impaired mitophagy in the myotubes with Parkin knockdown was demonstrated by decreased colocalization between EGFP‐LC3 and MitoBright LT Red‐stained mitochondria in the presence of bafilomycin A1 (BFA1), which was determined by means of confocal microscopic evaluation of colocalized particles in response to CSE exposure (Figure 3E). Conversely, the myotubes with Parkin overexpression demonstrated increased colocalization between EGFP‐LC3 and TOMM20 (Figure 3E). Electron microscopic evaluation showed CSE‐induced accumulation of damaged mitochondria with abnormal swelling and crista disruption, which was clearly enhanced in the myotubes with Parkin knockdown (Figure 3F). In contrast, Parkin overexpression clearly increased autophagic vacuoles containing mainly deforming mitochondria, especially in the presence of BFA1 (Figure 3F). WB of additional autophagy markers (LC3 and Beclin‐1) were conducted, but no significant changes in expression levels of LC3‐II (Supporting Information, Figure S2a–c) and Beclin‐1 (Figure S2d–f) were demonstrated in all three models. Accordingly, Parkin‐mediated mitophagy likely played an important regulatory role in the atrophic changes in the myotubes during CSE exposure by modulating mitochondrial integrity and ROS production.
Figure 3.
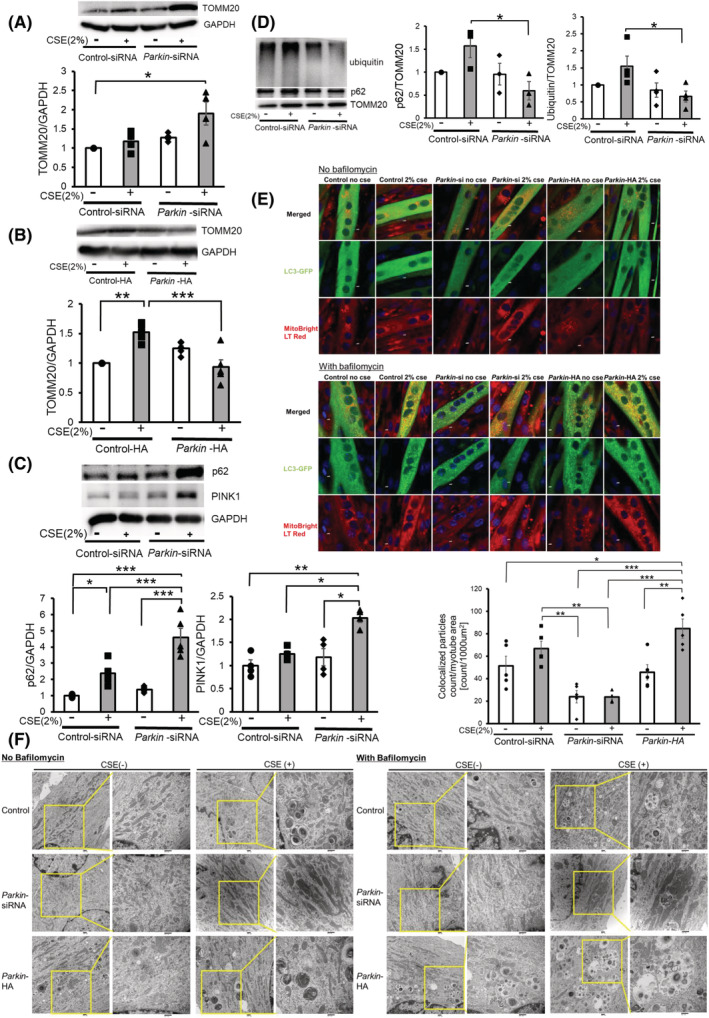
Parkin‐mediated mitophagy is involved in atrophic changes of myotubes during CSE exposure through modulating mitochondrial integrity. (A) WB using anti‐TOMM20 and anti‐GAPDH in control siRNA‐treated (Lanes 1 and 2) and Parkin siRNA‐treated (Lanes 3 and 4) myotubes with CSE exposure (2% for 48 h). The lower panel shows the average (±SEM) of the relative increase in TOMM20 normalized to GAPDH, determined from densitometric analysis of WB from four independent experiments. Open bars indicate no treatment, whereas filled bars indicate CSE treatment. *P < 0.05. (B) WB using anti‐TOMM20 and anti‐GAPDH in control vector (Lanes 1 and 2) and Parkin HA expression vector (Lanes 3 and 4). CSE treatment (2% for 48 h) was started 72 h post‐transfection. The lower panel shows the average (±SEM) of the relative expression in TOMM20 normalized to GAPDH, determined from densitometric analysis of WB from four independent experiments. Open bars indicate no treatment, whereas filled bars indicate CSE treatment. **P < 0.01; ***P < 0.001. (C) WB using anti‐p62, anti‐PINK1 and anti‐GAPDH in control siRNA‐treated (Lanes 1 and 2) and Parkin siRNA‐treated (Lanes 3 and 4) myotubes with CSE exposure (2% for 48 h). The middle and right panels show the average (±SEM) of the relative increase in p62 and PINK1 normalized to GAPDH, determined from the densitometric analysis of WB from five and four independent experiments, respectively. Open bars indicate no treatment, whereas filled bars indicate CSE treatment. *P < 0.05; **P < 0.01; ***P < 0.001. (D) WB using anti‐p62, anti‐ubiquitin, and anti‐TOMM20 in control siRNA‐treated (Lanes 1 and 2) and Parkin siRNA‐treated (Lanes 3 and 4) myotubes. CSE treatment (2.0%) was started after 5 days of differentiation, and protein samples from mitochondrial fractions were collected after 48 h of treatment. Shown is a representative experiment of 3 showing similar results. The middle panel is the average (±SEM) relative increase in p62 normalized to TOMM20, which are taken from the densitometric analysis of WB from three independent experiments. The rightmost panel is the average (±SEM) relative increase in ubiquitin normalized to TOMM20, which are taken from the densitometric analysis of WB from four independent experiments. Open bar is no treatment; filled bar is CSE treatment. *P < 0.05. (E) Colocalization analysis of confocal laser scanning microscope images of MitoBright LT Red‐stained mitochondria and ECFP‐LC3B. Myotubes were co‐transfected with pEGFP‐LC3B vector and control‐siNRA (Lanes 1 and 2), Parkin siRNA (Lanes 3 and 4), or Parkin HA expression vector (Lanes 5 and 6). Myotubes were treated with 2% CSE for 48 h in the absence or presence of bafilomycin A1 (Baf A1, 200 nM). Bar: 5 μm. The bottom panel showed the quantitative measurement of colocalized particles standardized by the myotube area. (F) Electron microscope images of mitochondria and autophagosomes in myotubes. Myotubes were transfected with control‐siNRA (upper lane), Parkin siRNA (middle lane), or Parkin HA expression vector (lower lane). Myotubes were treated with 2% CSE for 48 h in the absence or presence of Baf A1. Bar: 500 nm.
Muscle Ring Finger 1 induced atrophic changes in myotubes in the presence of insufficient Parkin‐mediated mitophagy
Muscle Ring Finger 1 is a muscle‐specific E3‐ubiquitin ligase whose activity is reflected by protein levels. MuRF‐1 is responsible for the degradation of MHC, with its activity being associated with the progression of muscle atrophy. 30 Interestingly, increased expression levels of MuRF‐1 have been reported in muscle biopsies from patients with COPD. 11 Significantly increased MuRF‐1 protein levels were observed in CSE‐treated myotubes (Figure 4A). CSE‐induced MuRF‐1 expression was further enhanced by Parkin knockdown but was significantly attenuated by Parkin overexpression and Mito‐TEMPO treatment in CSE‐treated myotubes (Figure 4A–C). The foreminded findings suggest that excessive mitochondrial ROS production by damaged mitochondria resulting from insufficient mitophagic degradation induces MuRF‐1 expression during CSE exposure. Thus, MuRF‐1 knockdown experiments were performed to determine the role of MuRF‐1 in regulating atrophic changes in myotubes. Accordingly, MuRF‐1 knockdown significantly ameliorated CSE‐induced MHC reduction and myotube atrophy without affecting CSE‐induced mitochondrial ROS production (Figure 4D–F), further supporting the notion that MuRF‐1 is a downstream regulator of atrophic myotube changes in the presence of insufficient mitophagy‐mediated increased ROS production.
Figure 4.
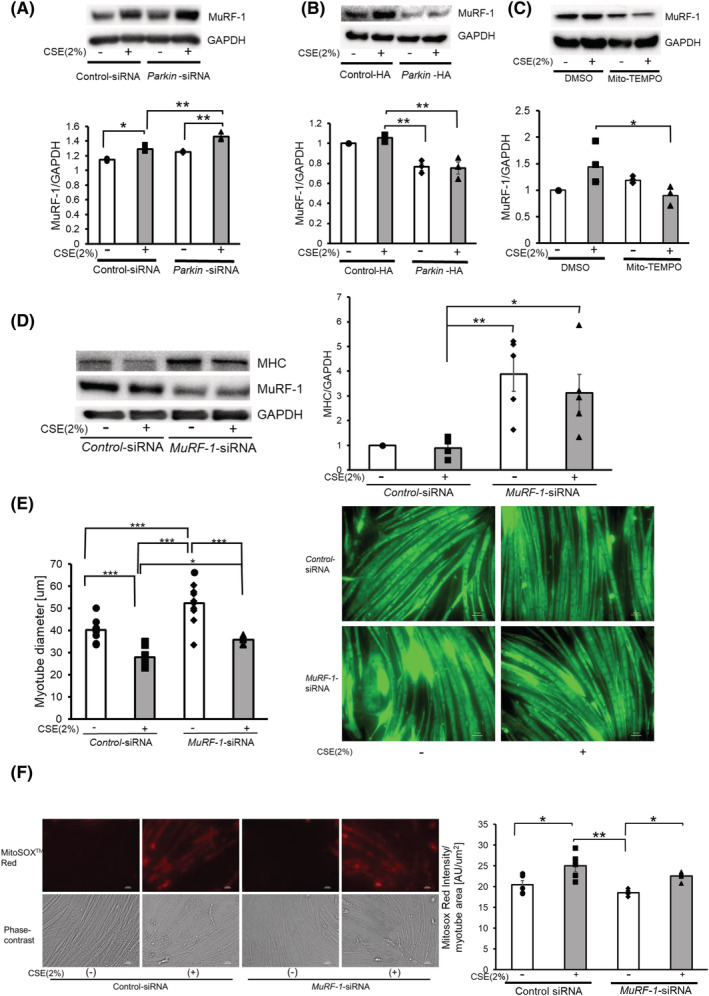
MuRF‐1 is responsible for atrophic changes in myotubes in the presence of insufficient Parkin‐mediated mitophagy. (A) WB using anti‐MuRF‐1 and anti‐GAPDH in control siRNA‐treated (Lanes 1 and 2) and Parkin siRNA‐treated (Lanes 3 and 4) myotubes with CSE exposure (2% for 48 h). The lower panel shows the average (±SEM) of the relative increase in MuRF‐1 normalized to GAPDH, determined from densitometric analysis of WB from three independent experiments. Open bars indicate no treatment, whereas filled bars indicate CSE treatment. *P < 0.05; **P < 0.01. (B) WB using anti‐MuRF‐1 and anti‐GAPDH in control vector‐treated (Lanes 1 and 2) and Parkin HA expression vector‐treated (Lanes 3 and 4) myotubes with CSE exposure (2% for 48 h). The lower panel shows the average (±SEM) of the relative increase in MuRF‐1 normalized to GAPDH, determined from densitometric analysis of WB from three independent experiments. Open bars indicate no treatment, whereas filled bars indicate CSE treatment. **P < 0.01. (C) WB using anti‐MuRF‐1 and anti‐GAPDH in DMSO‐treated (Lanes 1 and 2) and Mito‐TEMPO‐treated (Lanes 3 and 4) myotubes with CSE exposure (2% for 48 h). The lower panel shows the average (±SEM) of the relative increase in MuRF‐1 normalized to GAPDH, determined from densitometric analysis of WB from three independent experiments. Open bars indicate no treatment, whereas filled bars indicate CSE treatment. *P < 0.05. (D) WB using anti‐MHC, anti‐MuRF‐1 and anti‐GAPDH in control siRNA‐treated (Lanes 1 and 2) and MuRF‐1 siRNA‐treated (Lanes 3 and 4) myotubes with CSE exposure (2% for 48 h). The right panel shows the average (±SEM) of the relative increase in MHC normalized to GAPDH, determined from densitometric analysis of WB from five independent experiments. Open bars indicate no treatment, whereas filled bars indicate CSE treatment. *P < 0.05; **P < 0.01. (E) Images of immunofluorescent staining of MHC in control or CSE (2%)‐treated myotubes. Bar: 50 μm. Myotubes were transfected with nonsilencing control siRNA and MuRF‐1 siRNA, and CSE treatment (2% for 48 h) was started after 72 h post‐transfection. The left panel shows the average (±SEM) of the myotube diameter. The diameters of 10 randomly selected myotubes were averaged using nine images per group. Open bars indicate no treatment, whereas filled bars indicate CSE treatment. *P < 0.05; ***P < 0.001. (F) Fluorescence microscope detection of MitoSOX Red staining for mitochondrial ROS production (upper panels) and phase‐contrast images of myotubes (lower panels) in control or CSE (2%)‐treated myotubes. Myotubes were transfected with nonsilencing control siRNA and MuRF‐1 siRNA, and CSE treatment (2% for 24 h) was started after 72 h post‐transfection. Bar: 50 μm. MitoSOX Red staining was quantified using BZ‐X800 analyzer and normalized by the stained myotube area (rightmost panel).
Long‐term cigarette smoke exposure in Parkin knockout mice
To elucidate the physiological involvement of Parkin reduction in sarcopenia development in COPD, Parkin knockout mice (Parkin −/−) were subjected to long‐term CS exposure as a COPD model. After 6 months of exposure, CS‐exposed wild‐type (WT) mice had significantly lower total body weight compared with the room air‐exposed WT mice, which was further enhanced in CS‐exposed Parkin −/− mice (Figure 5A). Moreover, CS‐exposed WT mice had shorter wire hanging time, which reflects grip strength, compared with the room air‐exposed WT mice, and CS‐exposed Parkin −/− mice showed a trend of further reduction compared with CS‐exposed WT mice (P = 0.29) (Figure 5B). Similar to wire hanging time, the CS‐exposed WT mice had lower hind limb muscle weights compared with the room air‐exposed WT mice, but only the soleus muscle (SOL) weight reached statistical significance. CS‐exposed Parkin−/− mice demonstrated significantly lower limb muscles weights compared with the room air‐exposed WT mice and a trend of further reduction compared with the CS‐exposed WT mice (P = 0.25 for the gastrocnemius muscle, P = 0.15 for the extensor digitorum longus muscle, and P = 0.09 for the soleus muscle). Among limb muscles, only the tibialis anterior muscle (TA) reached a significant difference (Figure 5C). Moreover, CS‐exposed Parkin −/− mice had a significantly smaller average fibre diameter of the gastrocnemius muscle compared with CS‐exposed WT mice, with the fibre size distribution shifting to the left in CS‐exposed Parkin −/− mice, indicating relatively increased muscle atrophy (Figure 5D,E). Accordingly, CS‐exposed Parkin −/− mice showed more prominent features of COPD‐related sarcopenia.
Figure 5.
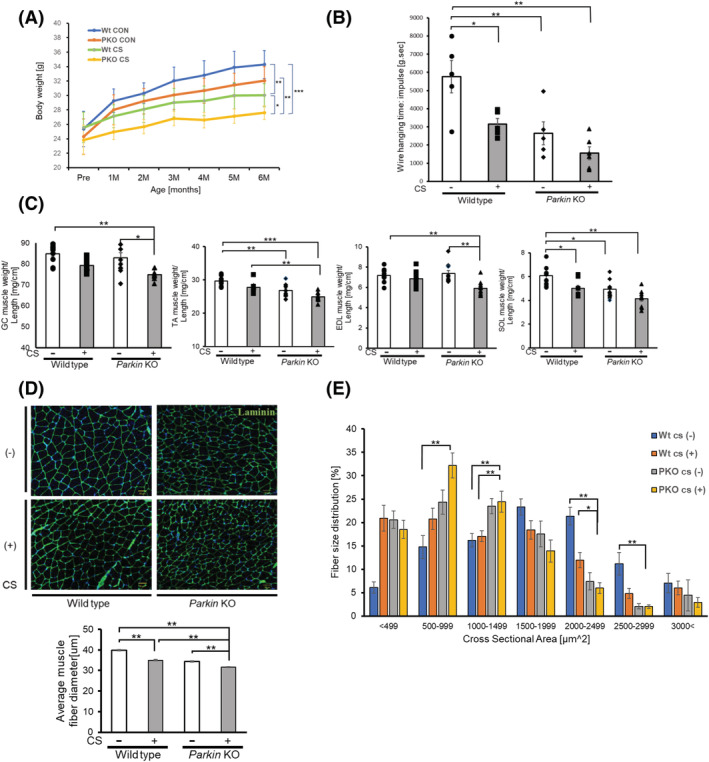
Effects of long‐term cigarette smoke (CS) exposure on Parkin knockout mice. (A) Time course of body weight during 6‐month CS exposure for wild‐type (WT) and Parkin knockout (PKO) mice (n = 7 to 9). Data are presented as mean ± SEM. *P < 0.05; **P < 0.01. ***P < 0.001. (B) Panel showing wire hanging time (impulse score) in linear wire hanging test. Mice were allowed to grasp the middle of the wire with their fore limbs, and the time until the mice completely released their grasp and fell down was recorded. Mice were provided three trials, and data were recorded as the maximum holding impulse, which is the hanging time in seconds multiplied by animal weight in grams. Data are presented as mean ± SEM, (n = 5 to 6). *P < 0.05. **P < 0.01. (C) Panel showing the weights of Musculus (M) gastrocnemius (GC), M. tibialis anterior (TA), M. soleus (SOL), and M. extensor digitorum longus (EDL) muscles of WT and PKO mice. All hindlimb muscle weights were normalized to the tibia length (n = 7 to 9). Data are presented as mean ± SEM. *P < 0.05, **P < 0.01, ***P < 0.001. (D) Representative images of laminin‐stained GC muscle sections of WT and PKO mice. Bar: 50 μm. The lower panel shows the average (±SEM) of the muscle fibre diameter. Open bars indicate no treatment, whereas filled bars indicate CSE treatment. **P < 0.01. (E) the panel showing the distribution of myofibre cross‐sectional area (CSA) in GC muscles of WT and PKO mice. Data are presented as mean ± SEM. *P < 0.05; **P < 0.01.
CS‐exposed Parkin −/− mice had significantly lower MHC protein levels in limb muscle homogenates compared with air‐exposed and CS‐exposed WT mice (Figure 6A). In contrast, CS‐exposed Parkin −/− mice showed increased protein levels of TOMM20, p62, PINK1, and MuRF‐1 in limb muscle homogenates, but MuRF‐1 demonstrated statistical significance only in comparison with air‐exposed WT mice (Figure 6A). Enhanced expression levels of 4‐Hydroxynonenal (4‐HNE), representing the lipid peroxidation around the sarcolemma, reflected enhanced oxidative stress in CS‐exposed Parkin −/− mice (Figure 6B). Immunohistochemical evaluation of TOMM20 also demonstrated increased expression levels, which were prominent around the sarcolemma in CS‐treated Parkin −/− mice (Figure 6C). Electron microscopic evaluation showed accumulation of damaged mitochondria with abnormal swelling and crista disruption around the sarcolemma in CS‐treated Parkin −/− mice (Figure 6D), further supporting the notion that Parkin‐mediated mitophagy played a regulatory role in CS‐induced sarcopenia by modulating mitochondrial damage and ROS production in association with MuRF‐1 expression.
Figure 6.
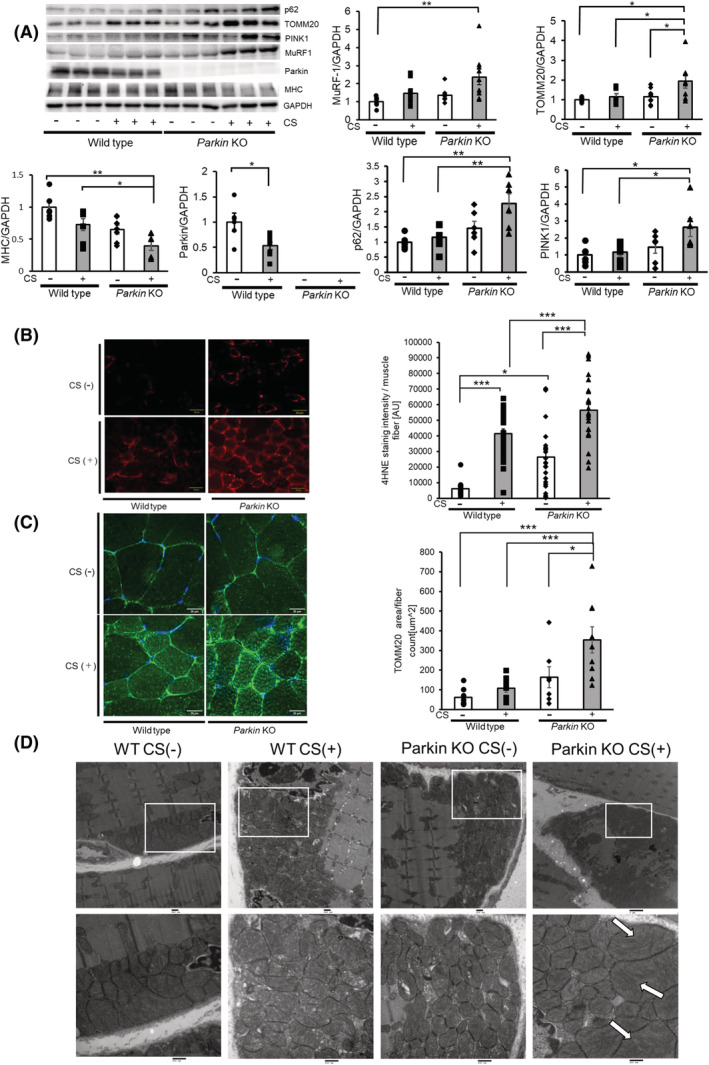
Long‐term CS exposure induces mitochondrial damage and ROS production with increased MuRF‐1 expression to cause muscle atrophy. (A) WB using anti‐MuRF‐1, anti‐TOMM20, anti‐Parkin, anti‐MHC, anti‐p62, anti‐PINK1 and anti‐GAPDH of GC muscles from WT mice (Lanes 1 to 6) and Parkin knockout mice (Lanes 7 to 12) subjected to 6‐month CS exposure. Panels show the average (±SEM) determined from densitometric analysis of WB (n = 7 to 9). Open bars indicate no treatment, whereas filled bars indicate CSE treatment. *P < 0.05; **P < 0.01. (B) Fluorescence microscope images of 4HNE staining for the oxidative modifications in the GC muscles from WT mice (Lane 1) and Parkin knockout mice (Lane 2) exposed to 6‐month CS exposure. The right panel shows the average (±SEM) of the 4HNE staining intensity normalized by muscle fibre count. Bar: 50 μm. *P < 0.05; ***P < 0.001. (C) Confocal laser scanning microscope images of TOMM20 staining in the GC muscles from WT mice (Lane 1) and Parkin knockout mice (Lane 2) exposed to 6‐month CS exposure. The right panel shows the average (±SEM) of the TOMM20 stained area normalized by muscle fibre count. Bar: 50 μm. *P < 0.05; ***P < 0.001. (D) Electron microscope images of mitochondria in the GC muscles from WT mice (Lanes 1 and 2) and Parkin knockout mice (Lanes 3 and 4) exposed to 6‐month CS exposure. Arrows show damaged mitochondria with abnormal swelling and crista disruption. Bar: 500 nm (lower panels).
Decreased Parkin expression levels with concomitant accumulation of damaged mitochondria in muscles from patients with chronic obstructive pulmonary disease‐related sarcopenia
We had previously reported that COPD lungs exhibited reduced Parkin expression levels. 21 GEO2R analysis of the microarray dataset (GSE100281), which evaluated gene transcription in the quadriceps of 79 stable COPD patients and 16 healthy age‐ and gender‐matched controls, showed a significant reduction in Parkin expression levels among patients with COPD (Figure 7A). Hence, Parkin protein levels in the gluteus maximus muscle were compared between patients with COPD‐related sarcopenia, those with non‐COPD sarcopenia, and controls. Patient characteristics are summarized in Table S1. Both non‐COPD sarcopenia and COPD‐related sarcopenia demonstrated trends of low BMI (19.9 ± 3.4 kg/m2 and 20.7 ± 3.9 kg/m2, respectively) and reduced SMI (5.28 ± 0.76 kg/m2 and 5.71 ± 1.14 kg/m2, respectively) compared with controls (BMI 24.3 ± 3.3 kg/m2 and SMI 6.25 ± 0.06 kg/m2), but only COPD‐related sarcopenia had significantly reduced FEV1.0/FVC (65.7 ± 11.1%, P < 0.05) compared with controls and non‐COPD sarcopenia (78.7 ± 4.4% and 83.4 ± 4.3%, respectively). Compared with those with non‐COPD sarcopenia and controls, those with COPD‐related sarcopenia showed significantly lower Parkin but greater TOMM20, PINK1, p62, and MuRF‐1 protein levels in the muscles (Figure 7B). Enhanced expression levels of 4‐HNE around the sarcolemma indicated exaggerated oxidative stress (Figure 7C). Immunofluorescence evaluation by TOMM20 staining indicated mitochondrial accumulation, especially around sarcolemma area in those with COPD‐related sarcopenia (Figure 7D). Consistently, electron microscopic evaluation showed mitochondrial accumulation with abnormal swelling and crista disruption, especially around the sarcolemma area (Figure 7E), suggesting that damaged mitochondria accumulation caused by insufficient Parkin‐mediated mitophagy was responsible for excessive ROS production and muscle atrophy in those with COPD‐related sarcopenia.
Figure 7.
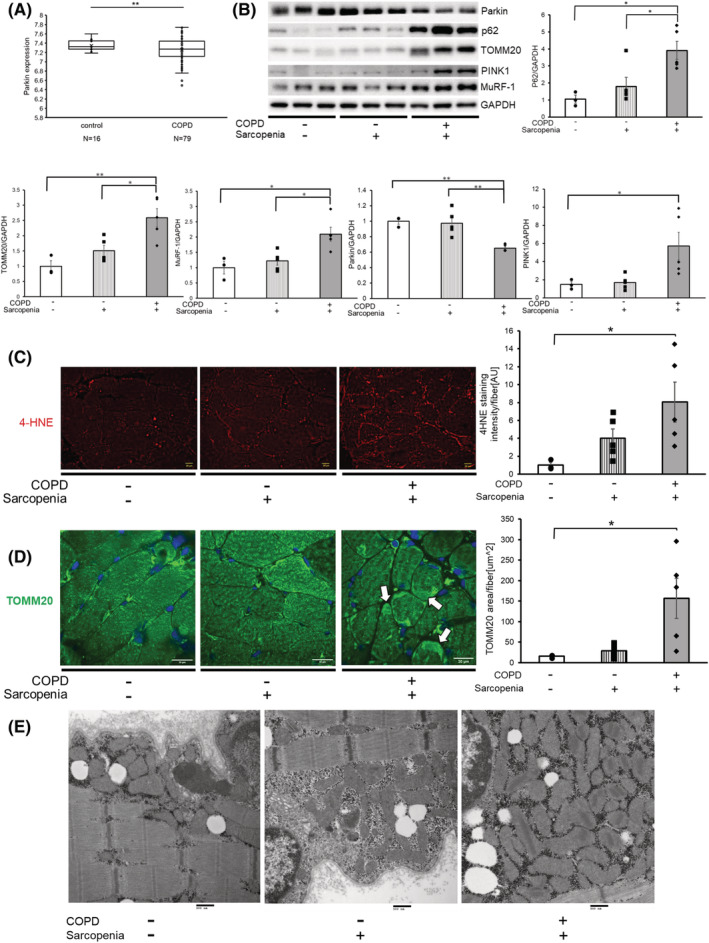
Gluteus maximus muscles of patients with COPD‐related sarcopenia exhibited reduced parkin expression levels and concomitant accumulation of mitochondria with elevated MuRF‐1. (A) Parkin expression levels from GEO2R analysis of the microarray dataset (GSE100281), evaluating gene transcription in the quadriceps of 79 stable patients with COPD and 16 healthy age‐ and gender‐matched controls. **P < 0.01. (B) WB using anti‐MuRF‐1, anti‐TOMM20, anti‐Parkin, anti‐p62, anti‐PINK1 and anti‐GAPDH in the gluteus maximus muscles from patients with no COPD and sarcopenia (Lanes 1 to 3), sarcopenia without COPD (Lane 4 to 6), and COPD‐related sarcopenia (Lanes 7 to 9). The lower panels show the average (±SEM) taken from densitometric analysis of WB from patient with no COPD and sarcopenia (n = 3), sarcopenia without COPD (n = 5), and COPD‐related sarcopenia (n = 5). *P < 0.05; **P < 0.01. (C) Fluorescence microscopic images of 4HNE staining for the oxidative modifications in the gluteus maximus muscles of patient with no COPD and sarcopenia (Lane 1), sarcopenia without COPD (Lane 2), and COPD‐related sarcopenia patients (Lane 3). The right panel shows the average (±SEM) of the 4HNE staining intensity normalized by muscle fibre count. Bar: 20 μm. *P < 0.05. (D) Confocal laser scanning microscope images of TOMM20 staining in the gluteus maximus muscles of patients with no COPD and sarcopenia (Lane 1), sarcopenia without COPD patients (Lane 2), and COPD‐related sarcopenia (Lane 3). The right panel shows the average (±SEM) of the TOMM20 stained area normalized by muscle fibre count from patients with no COPD and sarcopenia (n = 3), sarcopenia without COPD (n = 5), and COPD‐related sarcopenia (n = 5). Arrows indicate the accumulation of mitochondria. Bar: 50 μm. *P < 0.05. (E) Electron microscope detection of mitochondria in the gluteus maximus muscles of patient with no COPD and sarcopenia (Lane 1), sarcopenia without COPD (Lane 2), and COPD‐related sarcopenia (Lane 3). Bar: 500 nm.
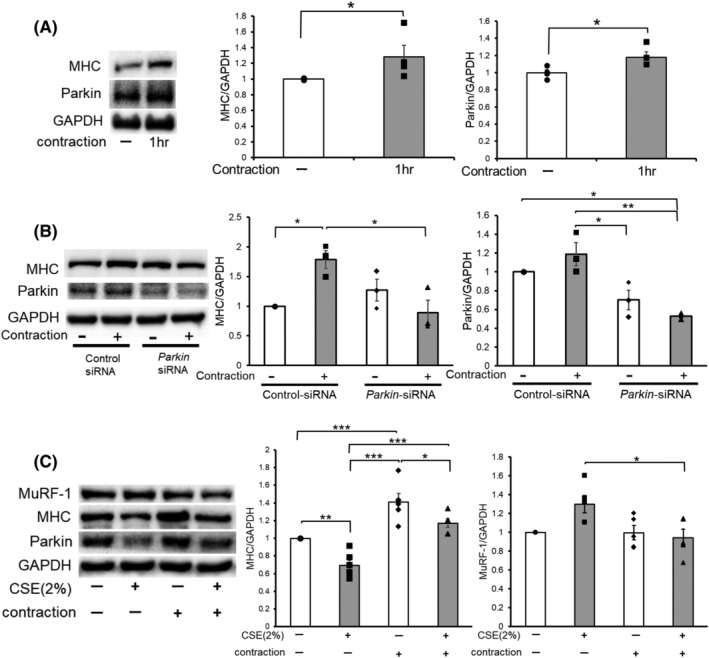
Muscle contraction increases myosin heavy chain levels by enhancing Parkin expression
Physical exercise is the most efficient way for preventing muscle atrophy. To examine the preventive role of exercise against muscle atrophy during CSE exposure, we adopted the C2C12 myotube contraction system. Accordingly, the contracted myotube showed a significant increase in MHC and Parkin protein levels (Figure 8A). Intriguingly, Parkin knockdown clearly suppressed contraction‐induced MHC up‐regulation, suggesting that contraction induces MHC expression through a Parkin‐mediated mechanism of MuRF‐1 regulation (Figure 8B). To elucidate the effects of myotube contraction on CSE‐induced atrophy, CSE (2%) treatment for 2 days was started 1 day after 1 h contraction. Notably, myotube contraction significantly prevented CSE‐induced MuRF‐1 up‐regulation and MHC reduction with concomitant maintenance of Parkin protein levels (Figure 8C), indicating that contraction‐mediated maintenance of Parkin expression may prevent MuRF‐1 up‐regulation during CSE exposure by enhancing mitophagy.
Figure 8.
Contraction of the muscle enhanced Parkin expression levels, causing muscle hypertrophy and protection from CSE‐induced atrophy. (A) WB using anti‐MHC, anti‐Parkin, and anti‐GAPDH in no contraction (Lane 1) and 1 h contraction‐treated (Lane 2) myotubes. Myotubes were stimulated with 10 V electric pulses for 20 ms at 1 Hz interval. Right panels show the average (±SEM) of the relative increase in MHC or Parkin normalized to GAPDH, determined from densitometric analysis of WB from three independent experiments. Open bars indicate no treatment, whereas filled bars indicate 1 h contraction treatment. *P < 0.05. (B) WB using anti‐MHC, anti‐Parkin, and anti‐GAPDH in no contraction (Lanes 1 and 3) and 1 h contraction‐treated (Lanes 2 and 4) myotubes. Myotubes were transfected with nonsilencing control siRNA and Parkin siRNA, and 1 h‐electric pulse stimulations (10 V pulses for 20 ms at 1 Hz interval) were started 48 h post‐transfection. The right panels show the average (±SEM) of the relative increase in MHC or Parkin normalized to GAPDH, determined from densitometric analysis of WB from three independent experiments. Open bars indicate no treatment, whereas filled bars indicate 1 h contraction treatment. *P < 0.05; **P < 0.01. (C) WB using anti‐MHC, anti‐Parkin, and anti‐GAPDH in control or CSE (2%)‐treated myotubes. Myotubes were stimulated for 1 h with 10 V electric pulses for 20 ms at 1 Hz interval, and CSE treatment (2% for 24 h) was started 1 day after the contraction. The right panels show the average (±SEM) of the relative increase in MHC or MuRF‐1 normalized to GAPDH, determined from densitometric analysis of WB from four independent experiments. Open bars indicate no treatment, whereas filled bars indicate CSE (2%) treatment. *P < 0.05, **P < 0.01, ***P < 0.001.
Discussion
The current study demonstrates that CSE‐induced myotube atrophy accompanied by accumulation of damaged mitochondria and enhanced mitochondrial ROS production with a concomitant reduction in parkin expression. Parkin knockdown and overexpression experiments indicated that Parkin‐mediated mitophagy played a pivotal role in regulating myotube atrophy by modulating mitochondrial ROS production. Increased mitochondrial ROS caused myotube atrophy by activating MuRF‐1‐mediated MHC degradation. The physiological involvement of Parkin reduction in sarcopenia development during COPD pathogenesis was confirmed by the CS‐exposed Parkin −/− mice model of COPD, which showed enhanced limb muscles atrophy. Notably, CS‐exposed Parkin −/− mice demonstrated increased MuRF‐1 and oxidative modification of 4HNE expression with concomitant accumulation of damaged mitochondria in their limb muscle. Meanwhile, human samples from patients with COPD‐related sarcopenia showed significantly decreased Parkin but increased MuRF‐1 and TOMM20 protein levels in muscle homogenates. Accumulation of damaged mitochondria in the muscles of patients with COPD‐related sarcopenia was detected through immunohistochemistry and electron microscopy. Moreover, muscle contraction‐induced MHC expression through Parkin up‐regulation even in CSE‐exposed myotubes, suggesting the potential for exercise to prevent progression of COPD‐related sarcopenia. Taken together, COPD‐related sarcopenia can be attributed to insufficient Parkin‐mediated mitophagy and increased mitochondrial ROS causing enhanced muscle atrophy by activating MuRF‐1, which may be at least partly preventable by appropriate exercise.
Accumulation of damaged mitochondria plays an important role in the aging process of the skeletal muscles, including sarcopenia, with reduced mitophagy having been implicated in this process. 22 , 31 Although evidence has shown that the atrophied muscles of older men demonstrated reduced parkin expression and that parkin overexpression prevented aging‐related loss of muscle mass, 22 , 32 the specific implication of parkin and Parkin‐mediated mitophagy in COPD‐related sarcopenia remains undetermined. Consistent with our previous findings regarding accelerated cellular senescence in human bronchial epithelial cells (HBEC) in COPD, 21 we elucidated the potential involvement of insufficient Parkin‐mediated mitophagy in the mechanisms of CSE‐induced myotube atrophy and COPD‐related sarcopenia by regulating mitochondrial damage and mitochondrial ROS production. Intriguingly, our findings showed that those with COPD‐related sarcopenia had significant lower Parkin protein levels in their muscles compared with those with non‐COPD sarcopenia. Although the detailed mechanisms for Parkin reduction remains uncertain, CSE significantly reduced Parkin mRNA levels in the myotubes, suggesting the involvement of transcriptional regulation. Insufficient Parkin‐mediated mitophagy induced accumulation of damaged mitochondria with higher mitochondrial ROS production, which may further induce mitochondrial damage during CSE exposure. The expression levels of PGC1‐alpha demonstrated no significant alterations in all models (data not shown), suggesting that the increase in mitochondrial mass in our experimental results was mainly attributed to insufficient mitophagic degradation, but not to an increase in mitochondrial biogenesis. In muscle samples of COPD‐related sarcopenia and CS‐exposed Parkin −/− mice, accumulation of damaged mitochondria was mainly detected in the perivascular region around the sarcolemma, suggesting that mitochondrion‐damaging agents can be carried through the bloodstream. Accordingly, the soluble fraction of inhaled CS is likely involved in not only mitochondrial damage but also Parkin reduction, resulting in enhanced mitochondrial ROS production in the muscles of those with COPD‐related sarcopenia (Figure S1). Based on the plasma nicotine concentrations in smokers, a previous paper showed that a 1.0% CSE solution, which uses two cigarettes to making a 10‐mL CSE solution, corresponds to exposures associated with smoking 0.5 pack/day. 33 Given that the current study used one cigarette to make a 10‐mL CSE solution, we considered that 2.0% of CSE was within the physiological range in the blood stream of smokers and was optimal for our in vitro experiments. In contrast to our findings, previous reports have demonstrated the potentially increased autophagy and mitophagy flux in the skeletal muscles of COPD patients. 34 , 35 The discrepancy could likely be attributed to the difference in the biopsied muscle and the characteristics of the study population. Vastus lateralis muscles were biopsied in previous reports, whereas the gluteus maximus muscle, which contains more oxidative type I fibres, was used in the present study (37.8% and 52.4% Type I fibres, respectively 36 ), suggesting that sensitivity to oxidative stress may be different. The characteristics of the study population were also different in terms of the smoking history of the controls (more than 50% of smoking history in previous reports and 0% in our study), BMI of the COPD cases (more than 25 kg/m2 in previous reports and 20.7 kg/m2 in our report), and age of the COPD cases (approximately 65 years old in previous reports and 85 years old in our study). COPD is a representative pulmonary disorder associated with aging, and Parkin expression levels show an aging‐related decline. 22 Hence, it is plausible that not only CS but also aging may affect Parkin reduction and status of mitophagy flux in muscle samples of patients with COPD‐related sarcopenia in our study.
Muscle atrophy is caused by accelerated destruction of the myofibril, which constitutes more than 70% of muscle proteins. 37 Moreover, MuRF‐1 is responsible for controlling protein levels of essential myofibril proteins, including MHC through the UP pathway. 38 The current study demonstrated that CSE‐exposed myotubes, as well as muscles from CS‐exposed Parkin −/− mice and COPD‐related sarcopenia, had increased MuRF‐1 protein levels (Figures 4, 6, and 7). MuRF‐1 expression levels reflect its activity, with its up‐regulation being associated with a variety of mechanisms, including mitochondrial ROS. 11 Enhanced MuRF‐1 expression by Parkin knockdown but reduction by Parkin overexpression and Mito‐TEMPO indicated that MuRF‐1 protein levels were regulated by Parkin‐modulated mitochondrial ROS during CSE exposure (Figure 4). Consistent with previous studies showing MuRF‐1 up‐regulation in the skeletal muscles of CS‐exposed animals, CS exposure tended to increase MuRF‐1 in WT mice (Figure 6). 11 , 39 , 40 Additionally, the markedly enhanced MuRF‐1 protein levels in CS‐exposed Parkin −/− mice further support the notion that Parkin plays a pivotal role in negatively regulating MuRF‐1 protein levels in muscles during CS exposure. The participation of MuRF‐1 in the process of MHC degradation was confirmed through MuRF‐1 knockdown experiments, which showed significant recovery from CSE‐induced MHC reduction in the myotubes (Figure 4). Inconsistent with our findings, the previous report could not demonstrate significant up‐regulation of MuRF‐1 in quadriceps biopsy from COPD patients, 41 and we speculate that substantial differences in patient characteristics, including age and BMI, may be partly responsible for this discrepancy.
Based on previous reports and the findings of the present study, Parkin overexpression may have a preventive role in muscle atrophy among patients with COPD‐related sarcopenia 22 (Figure 2). In general, exercise can be the most efficient method for maintaining muscle mass and strength. Recent studies have demonstrated the important role of Parkin in physical exercise‐induced mitophagy in association with mitochondria biogenesis of muscles in a mouse model. 42 Available data suggest that physical exercise may likely play a pivotal role in regulating Parkin‐mediated mitophagy. Intriguingly, myotube contraction by electrical stimulation induced both Parkin and MHC expression, and Parkin was responsible for MHC expression, which was demonstrated in the Parkin knockdown experiment (Figure 8). Although the mechanism for contraction‐induced Parkin expression remains elusive, exercise‐mediated Parkin up‐regulation remains a promising treatment strategy for sarcopenia including COPD‐related. Searching for novel agents that up‐regulate Parkin expression in terms of drug repositioning can also be a potential approach for treating patients with COPD‐related sarcopenia, especially those who cannot perform sufficient exercise due to respiratory dysfunction.
The present study has several limitations warranting discussion. First, we used CSE in our in vitro experiments as the model for COPD‐related sarcopenia. Proinflammatory cytokines have been widely implicated in extrapulmonary co‐morbidities of COPD by leaking out from the inflamed lung. Accordingly, the involvement of CS‐induced proinflammatory cytokines in regulating Parkin expression and mitochondrial integrity should be examined. Second, our findings showed the potential participation of Parkin‐mediated mitophagy in regulating MuRF‐1 expression levels. However, previous papers have shown that the NF‐kB and p38 MAPK signalling pathways were involved in the activation of MuRF‐1 during CS‐induced catabolism of myotubes. 39 Thus, it is reasonable to speculate that Parkin reduction is not the only mechanism for MuRF‐1 expression during CS exposure and that other possibilities should be elucidated. Third, a recent paper showed that Parkin‐mediated mitophagy might play a role in regulating muscle stem cell differentiation. 43 The results of our experiment demonstrated that CSE (2%) exposure induced a significantly lower expression levels of myogenin, a key transcription factor for myotube differentiation, in myoblasts, which was further reduced in CSE‐treated Parkin KD myoblasts (data not shown). Hence, it is likely that not only increased degradation of muscle proteins but also reduced muscle regeneration may be involved in the development of COPD‐related sarcopenia associated with insufficient Parkin‐mediated mitophagy, which should be examined in future studies. Fourth, we showed that CS‐exposed Parkin−/− mice demonstrated shorter wire hanging time and a trend of lower hind limb muscles weights compared with CS‐exposed WT mice, but only TA muscle weight reached a significant difference. However, the p‐values for the rest of the muscles were close to α‐error, which indicates that our small sample size may have led to the absence of a statistically significant difference. Hence, further evaluation with an increased sample size is necessary. Fifth, we demonstrated that patients with COPD‐related sarcopenia had significantly lower Parkin and greater MuRF‐1 protein levels in muscle homogenates compared with those with non‐COPD sarcopenia. However, our sample size was small and may not have been sufficient for determining the specific involvement of insufficient Parkin‐mediated mitophagy in COPD‐related sarcopenia. Further evaluation with increased number of cases, including both COPD‐related and non‐COPD‐related sarcopenia, is necessary.
In conclusion, the current study showed that increased mitochondrial ROS caused by insufficient Parkin‐mediated mitophagy was involved in the development of COPD‐related sarcopenia through MuRF‐1 expression. Parkin up‐regulation can be a promising treatment modality for COPD‐related sarcopenia, which should be further confirmed in future studies.
Conflict of interest
The authors declare that they have no conflict of interest.
The authors of this manuscript certify that they comply with the ethical guidelines for authorship and publishing in the Journal of Cachexia, Sarcopenia and Muscle. 44 All human and animal studies have been approved by the appropriate ethics committee and have therefore been performed in accordance with the ethical standards laid down in the 1964 Declaration of Helsinki and its later amendments.
Funding
This work was supported by grants from GSK Japan Research Grant 2018 and from JSPS KAKENHI Grant (Grant‐in Aid for Scientific Research (C)).
Supporting information
Fig. S1 Hypothetical model for the involvement of insufficient Parkin‐mediated mitophagy during smoking stress in the pathogenesis of COPD‐related sarcopenia. During CS exposure, volatile and soluble components containing billions of free radicals enter the bloodstream and may reach the capillaries in the sarcolemma surrounding muscle fibres. CS components can induce not only perivascular mitochondrial damage in the sarcolemma but also reduce Parkin expression levels. This reduction in Parkin‐mediated mitophagy may be responsible for increased mitochondrial ROS production and MuRF‐1 activation in muscle fibres, facilitating the development of COPD‐related sarcopenia
Fig. S2 Representative WB images of additional autophagy markers (LC3 and Beclin‐1)
(a) WB using anti‐LC3 and anti‐GAPDH of cell lysates from control siRNA (lanes 1 to 4) and Parkin siRNA (lanes 5 to 8) transfected myotubes. 2% CSE treatment was started 72 h post‐transfection, and protein samples were collected after 48 h of treatment. Protease inhibitor (E64d 10 μg/ml, pepstatin A 10 μg/ml) treatment was started 6 h before collecting cell lysates. (b) WB using anti‐LC3 and anti‐GAPDH of GC muscles from WT mice (lanes 1 to 6) and Parkin knockout mice (lanes 7 to 12) subjected to 6‐month CS exposure. (c) WB using anti‐LC3 and anti‐GAPDH in the gluteus maximus muscles from patients with no COPD and sarcopenia (lanes 1 to 3), sarcopenia without COPD (lanes 4 to 6), and COPD‐related sarcopenia (lanes 7 to 9). (d) WB using anti‐Beclin‐1 and anti‐GAPDH in PBS‐treated (lanes 1 and 2) and CSE (2% for 48 h)‐treated (lanes 3 and 4) myotubes. Myotubes were transfected with non‐silencing control siRNA and Parkin siRNA, and CSE treatment was started 72 h post‐transfection. (e) WB using anti‐Beclin‐1 and anti‐GAPDH of GC muscles from WT mice (lanes 1 to 6) and Parkin knockout mice (lanes 7 to 12) subjected to 6‐month CS exposure. (f) WB using anti‐Beclin‐1 and anti‐GAPDH in the gluteus maximus muscles from patients with no COPD and sarcopenia (lanes 1 to 3), sarcopenia without COPD (lanes 4 to 6), and COPD‐related sarcopenia (lanes 7 to 9).
Table S1. Patient characteristics
Data S1. Supporting Information
Acknowledgements
The authors would like to thank Dr. Yasuko Manabe for instructing us in performing the muscle contractility experiments; Department of Health Promotion Science, Graduate School of Human Health Sciences, Tokyo Metropolitan University, Tokyo, Japan.
Ito A., Hashimoto M., Tanihata J., Matsubayashi S., Sasaki R., Fujimoto S., Kawamoto H., Hosaka Y., Ichikawa A., Kadota T., Fujita Y., Takekoshi D., Ito S., Minagawa S., Numata T., Hara H., Matsuoka T., Udaka J., Araya J., Saito M., and Kuwano K. (2022) Involvement of Parkin‐mediated mitophagy in the pathogenesis of chronic obstructive pulmonary disease‐related sarcopenia, Journal of Cachexia, Sarcopenia and Muscle, 13, 1864–1882, 10.1002/jcsm.12988
References
- 1. Singh D, Agusti A, Anzueto A, Barnes PJ, Bourbeau J, Celli BR, et al. Global strategy for the diagnosis, management, and prevention of chronic obstructive lung disease: the GOLD science committee report 2019. Eur Respir J 2019;53:1900164. [DOI] [PubMed] [Google Scholar]
- 2. Celli BR, Decramer M, Wedzicha JA, Wilson KC, Agustí AA, Criner GJ, et al. An official American Thoracic Society/European Respiratory Society statement: research questions in COPD. Eur Respir Rev: Off J Eur Respir Soc 2015;24:159–172. [DOI] [PMC free article] [PubMed] [Google Scholar]
- 3. Jaitovich A, Barreiro E. Skeletal muscle dysfunction in chronic obstructive pulmonary disease. What we know and can do for our patients. Am J Respir Crit Care Med 2018;198:175–186. [DOI] [PMC free article] [PubMed] [Google Scholar]
- 4. Barnes PJ, Celli BR. Systemic manifestations and comorbidities of COPD. Eur Respir J 2009;33:1165–1185. [DOI] [PubMed] [Google Scholar]
- 5. Benz E, Trajanoska K, Lahousse L, Schoufour JD, Terzikhan N, De Roos E, et al. Sarcopenia in COPD: a systematic review and meta‐analysis. Eur Respir Rev: Off J Eur Respir Soc 2019;28:190049. [DOI] [PMC free article] [PubMed] [Google Scholar]
- 6. Jones SE, Maddocks M, Kon SS, Canavan JL, Nolan CM, Clark AL, et al. Sarcopenia in COPD: prevalence, clinical correlates and response to pulmonary rehabilitation. Thorax 2015;70:213–218. [DOI] [PubMed] [Google Scholar]
- 7. Marquis K, Debigaré R, Lacasse Y, LeBlanc P, Jobin J, Carrier G, et al. Midthigh muscle cross‐sectional area is a better predictor of mortality than body mass index in patients with chronic obstructive pulmonary disease. Am J Respir Crit Care Med 2002;166:809–813. [DOI] [PubMed] [Google Scholar]
- 8. Shrikrishna D, Patel M, Tanner RJ, Seymour JM, Connolly BA, Puthucheary ZA, et al. Quadriceps wasting and physical inactivity in patients with COPD. Eur Respir J 2012;40:1115–1122. [DOI] [PubMed] [Google Scholar]
- 9. Swallow EB, Reyes D, Hopkinson NS, Man WD, Porcher R, Cetti EJ, et al. Quadriceps strength predicts mortality in patients with moderate to severe chronic obstructive pulmonary disease. Thorax 2007;62:115–120. [DOI] [PMC free article] [PubMed] [Google Scholar]
- 10. Degens H, Gayan‐Ramirez G, van Hees HW. Smoking‐induced skeletal muscle dysfunction: from evidence to mechanisms. Am J Respir Crit Care Med 2015;191:620–625. [DOI] [PubMed] [Google Scholar]
- 11. Doucet M, Russell AP, Leger B, Debigare R, Joanisse DR, Caron MA, et al. Muscle atrophy and hypertrophy signaling in patients with chronic obstructive pulmonary disease. Am J Respir Crit Care Med 2007;176:261–269. [DOI] [PubMed] [Google Scholar]
- 12. Hussain SN, Sandri M. Role of autophagy in COPD skeletal muscle dysfunction. J Appl Physiol (1985) 2013;114:1273–1281. [DOI] [PubMed] [Google Scholar]
- 13. Plant PJ, Brooks D, Faughnan M, Bayley T, Bain J, Singer L, et al. Cellular markers of muscle atrophy in chronic obstructive pulmonary disease. Am J Respir Cell Mol Biol 2010;42:461–471. [DOI] [PubMed] [Google Scholar]
- 14. Masiero E, Agatea L, Mammucari C, Blaauw B, Loro E, Komatsu M, et al. Autophagy is required to maintain muscle mass. Cell Metab 2009;10:507–515. [DOI] [PubMed] [Google Scholar]
- 15. Raben N, Hill V, Shea L, Takikita S, Baum R, Mizushima N, et al. Suppression of autophagy in skeletal muscle uncovers the accumulation of ubiquitinated proteins and their potential role in muscle damage in Pompe disease. Hum Mol Genet 2008;17:3897–3908. [DOI] [PMC free article] [PubMed] [Google Scholar]
- 16. Allaire J, Maltais F, LeBlanc P, Simard PM, Whittom F, Doyon JF, et al. Lipofuscin accumulation in the vastus lateralis muscle in patients with chronic obstructive pulmonary disease. Muscle Nerve 2002;25:383–389. [DOI] [PubMed] [Google Scholar]
- 17. van der Toorn M, Rezayat D, Kauffman HF, Bakker SJ, Gans RO, Koëter GH, et al. Lipid‐soluble components in cigarette smoke induce mitochondrial production of reactive oxygen species in lung epithelial cells. Am J Physiol Lung Cell Mol Physiol 2009;297:L109–L114. [DOI] [PMC free article] [PubMed] [Google Scholar]
- 18. Geisler S, Holmström KM, Skujat D, Fiesel FC, Rothfuss OC, Kahle PJ, et al. PINK1/Parkin‐mediated mitophagy is dependent on VDAC1 and p62/SQSTM1. Nat Cell Biol 2010;12:119–131. [DOI] [PubMed] [Google Scholar]
- 19. Rubinsztein DC, Mariño G, Kroemer G. Autophagy and aging. Cell 2011;146:682–695. [DOI] [PubMed] [Google Scholar]
- 20. Araya J, Tsubouchi K, Sato N, Ito S, Minagawa S, Hara H, et al. PRKN‐regulated mitophagy and cellular senescence during COPD pathogenesis. Autophagy 2019;15:510–526. [DOI] [PMC free article] [PubMed] [Google Scholar]
- 21. Ito S, Araya J, Kurita Y, Kobayashi K, Takasaka N, Yoshida M, et al. PARK2‐mediated mitophagy is involved in regulation of HBEC senescence in COPD pathogenesis. Autophagy 2015;11:547–559. [DOI] [PMC free article] [PubMed] [Google Scholar]
- 22. Leduc‐Gaudet JP, Reynaud O, Hussain SN, Gouspillou G. Parkin overexpression protects from ageing‐related loss of muscle mass and strength. J Physiol 2019;597:1975–1991. [DOI] [PMC free article] [PubMed] [Google Scholar]
- 23. Peker N, Donipadi V, Sharma M, McFarlane C, Kambadur R. Loss of Parkin impairs mitochondrial function and leads to muscle atrophy. Am J Physiol Cell Physiol 2018;315:C164–c85. [DOI] [PubMed] [Google Scholar]
- 24. Araya J, Cambier S, Markovics JA, Wolters P, Jablons D, Hill A, et al. Squamous metaplasia amplifies pathologic epithelial‐mesenchymal interactions in COPD patients. J Clin Invest 2007;117:3551–3562. [DOI] [PMC free article] [PubMed] [Google Scholar]
- 25. Kabeya Y, Mizushima N, Ueno T, Yamamoto A, Kirisako T, Noda T, et al. LC3, a mammalian homologue of yeast Apg8p, is localized in autophagosome membranes after processing. EMBO J 2000;19:5720–5728. [DOI] [PMC free article] [PubMed] [Google Scholar]
- 26. Manabe Y, Miyatake S, Takagi M, Nakamura M, Okeda A, Nakano T, et al. Characterization of an acute muscle contraction model using cultured C2C12 myotubes. PLoS ONE 2012;7:e52592. [DOI] [PMC free article] [PubMed] [Google Scholar]
- 27. Aartsma‐Rus A, van Putten M. Assessing functional performance in the mdx mouse model. J Vis Exp 2014;e51303. [DOI] [PMC free article] [PubMed] [Google Scholar]
- 28. Chen LK, Woo J, Assantachai P, Auyeung TW, Chou MY, Iijima K, et al. Asian Working Group for Sarcopenia: 2019 Consensus Update on Sarcopenia Diagnosis and Treatment. J Am Med Dir Assoc 2020;21:300, e2–307. [DOI] [PubMed] [Google Scholar]
- 29. Tsubouchi K, Araya J, Minagawa S, Hara H, Ichikawa A, Saito N, et al. Azithromycin attenuates myofibroblast differentiation and lung fibrosis development through proteasomal degradation of NOX4. Autophagy 2017;13:1420–1434. [DOI] [PMC free article] [PubMed] [Google Scholar]
- 30. Rom O, Reznick AZ. The role of E3 ubiquitin‐ligases MuRF‐1 and MAFbx in loss of skeletal muscle mass. Free Radic Biol Med 2016;98:218–230. [DOI] [PubMed] [Google Scholar]
- 31. O'Leary MF, Vainshtein A, Iqbal S, Ostojic O, Hood DA. Adaptive plasticity of autophagic proteins to denervation in aging skeletal muscle. Am J Physiol Cell Physiol 2013;304:C422–C430. [DOI] [PubMed] [Google Scholar]
- 32. Gouspillou G, Sgarioto N, Kapchinsky S, Purves‐Smith F, Norris B, Pion CH, et al. Increased sensitivity to mitochondrial permeability transition and myonuclear translocation of endonuclease G in atrophied muscle of physically active older humans. FASEB J 2014;28:1621–1633. [DOI] [PubMed] [Google Scholar]
- 33. Lee SD, Lee DS, Chun YG, Shim TS, Lim CM, Koh Y, et al. Cigarette smoke extract induces endothelin‐1 via protein kinase C in pulmonary artery endothelial cells. Am J Physiol Lung Cell Mol Physiol 2001;281:L403–L411. [DOI] [PubMed] [Google Scholar]
- 34. Guo Y, Gosker HR, Schols AM, Kapchinsky S, Bourbeau J, Sandri M, et al. Autophagy in locomotor muscles of patients with chronic obstructive pulmonary disease. Am J Respir Crit Care Med 2013;188:1313–1320. [DOI] [PubMed] [Google Scholar]
- 35. Leermakers PA, Schols A, Kneppers AEM, Kelders M, de Theije CC, Lainscak M, et al. Molecular signalling towards mitochondrial breakdown is enhanced in skeletal muscle of patients with chronic obstructive pulmonary disease (COPD). Sci Rep 2018;8:15007. [DOI] [PMC free article] [PubMed] [Google Scholar]
- 36. Johnson MA, Polgar J, Weightman D, Appleton D. Data on the distribution of fibre types in thirty‐six human muscles: An Autopsy Study. J Neurol Sci 1973;18:111–129. [DOI] [PubMed] [Google Scholar]
- 37. Cohen S, Nathan JA, Goldberg AL. Muscle wasting in disease: molecular mechanisms and promising therapies. Nat Rev Drug Discov 2015;14:58–74. [DOI] [PubMed] [Google Scholar]
- 38. Clarke BA, Drujan D, Willis MS, Murphy LO, Corpina RA, Burova E, et al. The E3 Ligase MuRF1 degrades myosin heavy chain protein in dexamethasone‐treated skeletal muscle. Cell Metab 2007;6:376–385. [DOI] [PubMed] [Google Scholar]
- 39. Kaisari S, Rom O, Aizenbud D, Reznick AZ. Involvement of NF‐kappaB and muscle specific E3 ubiquitin ligase MuRF1 in cigarette smoke‐induced catabolism in C2 myotubes. Adv Exp Med Biol 2013;788:7–17. [DOI] [PubMed] [Google Scholar]
- 40. Su J, Li J, Lu Y, Li N, Li P, Wang Z, et al. The rat model of COPD skeletal muscle dysfunction induced by progressive cigarette smoke exposure: a pilot study. BMC Pulm Med 2020;20:74. [DOI] [PMC free article] [PubMed] [Google Scholar]
- 41. Natanek SA, Riddoch‐Contreras J, Marsh GS, Hopkinson NS, Moxham J, Man WD, et al. MuRF‐1 and atrogin‐1 protein expression and quadriceps fiber size and muscle mass in stable patients with COPD. COPD: J Chron Obstruct Pulmon Dis 2013;10:618–624. [DOI] [PMC free article] [PubMed] [Google Scholar]
- 42. Chen CCW, Erlich AT, Crilly MJ, Hood DA. Parkin is required for exercise‐induced mitophagy in muscle: impact of aging. Am J Physiol Endocrinol Metab 2018;315:E404–E415. [DOI] [PubMed] [Google Scholar]
- 43. Esteca MV, Severino MB, Silvestre JG, Palmeira Dos Santos G, Tamborlin L, Luchessi AD, et al. Loss of Parkin results in altered muscle stem cell differentiation during regeneration. Int J Mol Sci 2020;21:8007. [DOI] [PMC free article] [PubMed] [Google Scholar]
- 44. von Haehling S, Morley JE, Coats AJS, Anker SD. Ethical guidelines for publishing in the Journal of Cachexia, Sarcopenia and Muscle: update 2021. J Cachexia Sarcopenia Muscle 2021;12:2259–2261. [DOI] [PMC free article] [PubMed] [Google Scholar]
Associated Data
This section collects any data citations, data availability statements, or supplementary materials included in this article.
Supplementary Materials
Fig. S1 Hypothetical model for the involvement of insufficient Parkin‐mediated mitophagy during smoking stress in the pathogenesis of COPD‐related sarcopenia. During CS exposure, volatile and soluble components containing billions of free radicals enter the bloodstream and may reach the capillaries in the sarcolemma surrounding muscle fibres. CS components can induce not only perivascular mitochondrial damage in the sarcolemma but also reduce Parkin expression levels. This reduction in Parkin‐mediated mitophagy may be responsible for increased mitochondrial ROS production and MuRF‐1 activation in muscle fibres, facilitating the development of COPD‐related sarcopenia
Fig. S2 Representative WB images of additional autophagy markers (LC3 and Beclin‐1)
(a) WB using anti‐LC3 and anti‐GAPDH of cell lysates from control siRNA (lanes 1 to 4) and Parkin siRNA (lanes 5 to 8) transfected myotubes. 2% CSE treatment was started 72 h post‐transfection, and protein samples were collected after 48 h of treatment. Protease inhibitor (E64d 10 μg/ml, pepstatin A 10 μg/ml) treatment was started 6 h before collecting cell lysates. (b) WB using anti‐LC3 and anti‐GAPDH of GC muscles from WT mice (lanes 1 to 6) and Parkin knockout mice (lanes 7 to 12) subjected to 6‐month CS exposure. (c) WB using anti‐LC3 and anti‐GAPDH in the gluteus maximus muscles from patients with no COPD and sarcopenia (lanes 1 to 3), sarcopenia without COPD (lanes 4 to 6), and COPD‐related sarcopenia (lanes 7 to 9). (d) WB using anti‐Beclin‐1 and anti‐GAPDH in PBS‐treated (lanes 1 and 2) and CSE (2% for 48 h)‐treated (lanes 3 and 4) myotubes. Myotubes were transfected with non‐silencing control siRNA and Parkin siRNA, and CSE treatment was started 72 h post‐transfection. (e) WB using anti‐Beclin‐1 and anti‐GAPDH of GC muscles from WT mice (lanes 1 to 6) and Parkin knockout mice (lanes 7 to 12) subjected to 6‐month CS exposure. (f) WB using anti‐Beclin‐1 and anti‐GAPDH in the gluteus maximus muscles from patients with no COPD and sarcopenia (lanes 1 to 3), sarcopenia without COPD (lanes 4 to 6), and COPD‐related sarcopenia (lanes 7 to 9).
Table S1. Patient characteristics
Data S1. Supporting Information