

Abstract
Background
Cancer cachexia is a multifactorial syndrome characterized by involuntary and pathological weight loss, mainly due to skeletal muscle wasting, resulting in a decrease in patients' quality of life, response to cancer treatments, and survival. Our objective was to investigate skeletal muscle alterations in cachectic cancer patients.
Methods
This is a prospective study of patients managed for pancreatic or colorectal cancer with an indication for systemic chemotherapy (METERMUCADIG ‐ NCT02573974). One lumbar CT image was used to determine body composition. Patients were divided into three groups [8 noncachectic (NC), 18 with mild cachexia (MC), and 19 with severe cachexia (SC)] based on the severity of weight loss and muscle mass. For each patient, a pectoralis major muscle biopsy was collected at the time of implantable chamber placement. We used high‐resolution oxygraphy to measure mitochondrial muscle oxygen consumption on permeabilized muscle fibres. We also performed optical and electron microscopy analyses, as well as gene and protein expression analyses.
Results
Forty‐five patients were included. Patients were 67% male, aged 67 years (interquartile range, 59–77). Twenty‐three (51%) and 22 (49%) patients were managed for pancreatic and colorectal cancer, respectively. Our results show a positive correlation between median myofibres area and skeletal muscle index (P = 0.0007). Cancer cachexia was associated with a decrease in MAFbx protein expression (P < 0.01), a marker of proteolysis through the ubiquitin‐proteasome pathway. Mitochondrial oxygen consumption related to energy wasting was significantly increased (SC vs. NC, P = 0.028) and mitochondrial area tended to increase (SC vs. MC, P = 0.056) in SC patients. On the contrary, mitochondria content and networks remain unaltered in cachectic cancer patients. Finally, our results show no dysfunction in lipid storage and endoplasmic reticulum homeostasis.
Conclusions
This clinical protocol brings unique data that provide new insight to mechanisms underlying muscle wasting in cancer cachexia. We report for the first time an increase in mitochondrial energy wasting in the skeletal muscle of severe cachectic cancer patients. Additional clinical studies are essential to further the exploring and understanding of these alterations.
Keywords: Cancer cachexia, Clinical study, Pectoralis major, Proteolysis, Mitochondrial bioenergetics, Myosteatosis
Introduction
Cancer cachexia is a multifactorial syndrome characterized by involuntary and pathological weight loss (WL), mainly due to skeletal muscle wasting, 1 resulting in a decrease in patients' quality of life, response to cancer treatments, 2 and survival. 3 ; S1 Due to the pathophysiological complexity of this clinical syndrome, there is currently no effective treatment for cancer cachexia.
A large majority of research has focused on mechanisms behind skeletal muscle wasting (refer to reviews 4 , 5 ; S2). There are currently many postulated mechanisms that may participate in cancer cachexia induced‐muscle loss, the most described being the unbalance between proteolysis and protein synthesis. 4 Two muscle‐specific E3 ubiquitin ligases, muscle ring finger 1 (MuRF1) and muscle atrophy F‐box (MAFbx)/atrogin‐1, are considered as the main contributors for the increased proteolysis. 5 On the other side of the protein balance, reduction in synthesis is controversial, and mechanisms are not clearly identified. 5
Among the recently uncovered but poorly studied mechanisms underlying skeletal muscle wasting, several clinical and preclinical studies demonstrated alterations in skeletal muscle mitochondrial structure, bioenergetics, and dynamics 6 , 7 , 8 ; S3‐S7 (refer to review 9 ). Disruption in mitochondrial function can reduce fatty acids oxidation leading to excessive lipid storage in muscle cells (myosteatosis). Intermuscular and intramuscular accumulation of lipids was reported in cachectic condition. 10 , 11 , 12 ; S8 Myosteatosis generates toxic lipid intermediates and oxidative stress 13 exacerbating mitochondrial dysfunction and lipid accumulation, initiating a vicious circle. Direct dysfunction of mitochondrial respiratory chain can decrease ATP production and increase reactive oxygen species and then induce oxidative stress, feeding the vicious circle. More recently, some studies reported, in cachectic patients 14 and preclinical models, 15 endoplasmic reticulum stress (ER stress) and disruptions in the unfolding protein response in skeletal muscle. 16 ER stress can be induced by intramuscular lipid storage, via ceramides and other toxic lipids intermediates production, increasing proteolysis processes. Furthermore, ER stress can affect mitochondria‐associated ER membranes leading to disruption in mitochondrial and lipid metabolism and increased proteolysis.
However, even if the connection of the mechanisms makes sense, there is a large weakness in the fact that most of the data have been reported in preclinical models of cancer cachexia and in vitro experiments. Only few data were obtained from studies in patients.
We recently reviewed 31 clinical studies analysing skeletal muscle biopsies from cachectic cancer patients to explore the mechanisms underlying the skeletal muscle wasting. 17 Most of these studies recruited patients with gastrointestinal cancers, including cancer of the oesophagus, stomach, liver, pancreas, colon, and anus. However, there are discrepancies in the results of these clinical studies, which may create confusion in the field. Finally, most of these studies have focused on a single piece of the puzzle of muscle wasting mechanisms. It is therefore essential to carry out further clinical studies to confirm the involvement of the mechanisms mentioned above (proteolysis and protein synthesis, myosteatosis, mitochondrial energy metabolism, and ER stress).
We aimed to investigate both skeletal muscle structural and metabolic alterations in cachectic patients with colorectal or pancreatic cancer.
Patients and methods
Study design and patients
The present study is a French monocentric and non‐interventional study (METERMUCADIG ‐ NCT02573974) conducted in the University Hospital of Tours. The study protocol was approved by the local ethics committee (IdRCB 2015‐A00683‐462015‐R25; CPP 2015‐R25; ANSM 150963B‐12). The study was compliant with the Declaration of Helsinki. Patients were recruited after signature of the fully informed consent form. The study started on 19/01/2016 and samples were collected until 04/12/2018. The inclusion criteria were as follows: patient between 18 and 80 years old; colorectal or pancreatic cancer with an indication for systemic chemotherapy, and the placement of an implantable chamber (Port‐a‐Cath, PAC) in a subclavian setting; life expectancy ≥ 3 months; general status according to the World Health Organization classification ≤ 2. Exclusion criteria included the following: pregnant or lactating women, unbalanced diabetes, systemic corticosteroid therapy, and any severe uncontrolled medical condition.
On the day of PAC insertion, prior to the start of chemotherapy treatment, a single biopsy from the pectoralis major and blood samples were collected for each patient. Not all patients with colorectal or pancreatic cancer, especially advanced cancer, are eligible for pelvic surgery due to poor nutritional status. PAC was therefore a surgical opportunity to access sufficient skeletal muscle biopsy for all patients, regardless of their nutritional status. The muscle biopsy was collected under local anaesthesia (Xylocaine® solution) with a cold scalpel. Details on the transport buffer, dissection, and fixation can be found in the supporting information. An anonymized computerized tomography (CT) scanner for cancer diagnosis, including at least the abdominal part, was collected prospectively. At inclusion, declarative WL and waist size were compiled. Declarative WL is based on the body weight at inclusion (between the CT scan and the muscle biopsy), and the usual body weight of the patient, the patient's stabilized body weight months before the inclusion. Brachial circumference and muscle strength were also measured, as detailed in the supporting information.
We used two criteria to establish the cachectic status of patients: severity of WL and muscle mass. Muscle mass was defined with skeletal muscle index (SMI) cut‐offs. 18 Men with body mass index (BMI) < 25 kg/m2 and SMI < 43 cm2/m2 or BMI ≥ 25 kg/m2 and SMI < 53 cm2/m2 and women with SMI < 41 cm2/m2 were considered as patients with low muscle mass (SMI < cut‐off), as opposed to patients with normal muscle mass (SMI > cut‐off). The severity of WL was defined based on a five‐level scoring system (grades 0–4). 19 Patients with grade 3 or 4 WL (BMI < 20 kg/m2 and WL < 6%; or BMI < 28 kg/m2 and 6% ≤ WL < 11%; or WL ≥ 11%) were considered weight‐losing, as opposed to weight‐stable patients with grade 0 to 2 WL (BMI > 20 kg/m2 and WL < 6%; or BMI > 28 kg/m2 and 6% ≤ WL < 11%). To study the structure and metabolic functions of skeletal muscle in cachectic cancer patients, men and women were separated into three groups: noncachectic (NC) patients [weight‐stable patients (grades 0 to 2 WL) with normal muscle mass (SMI > cut‐off)], patients with mild cachexia (MC) [weight‐stable patients (grades 0 to 2 WL) with low muscle mass (SMI < cut‐off) or weight‐losing patients (grade 3 or 4 WL) with normal muscle mass (SMI > cut‐off)], and patients with severe cachexia (SC) [weight‐losing patients (grade 3 or 4 WL) with low muscle mass (SMI < cut‐off)].
Computerized tomography scan analyses
Diagnostic CT images were used to determine body composition. 20 , 21 ; S9 One axial image of the third lumbar vertebra (L3) was selected for analysis of total skeletal muscle and fat cross‐sectional areas. CT image parameters included: without contrast, 1 to 5 mm slice thickness, 70 to 120 kVp, and ~100 to 600 mA. Tissues were identified anatomically and quantified within prespecified Hounsfield unit (HU) ranges: skeletal muscle (−29 to +150 HU), subcutaneous adipose tissue (−190 to −30 HU), intermuscular adipose tissue (−190 to −30 HU), and visceral adipose tissue (−150 to −50 HU). Total fat cross‐sectional area was computed. All images were analysed by a single trained observer with Slice‐O–Matic software (v.5.0; Tomovision, Magog, Canada).
High‐resolution oxygraphy
The measurement of mitochondrial muscle oxygen consumption was performed on permeabilized fibres using OROBOROS Oxygraph‐2k® (Oroboros Instrument). The detailed procedure and respirometry protocol can be found in the supporting information. The results were analysed using DatLab 6® software (Oroboros Instrument). Once the measurements completed, the biopsies were dried for 30 min at 37°C and then weighed. The oxygen consumption values were normalized to the dry weight of the muscle fibres.
Optical and electron microscopy
Detailed procedures can be found in the supporting information. Light microscopy images were prepared and myofibres area was manually analysed with Nikon Eclipse 80i microscope connected with Nikon DS‐Vi1 camera driven by NIS‐ELEMENTS D 4.4 (Nikon) software. For each patient, the median myofibres area was calculated on approximately 200 myofibres. Electron micrographs were recorded with a digital camera driven by Digital Micrograph software (GMS 3, Gatan, Pleasanton, CA, USA). For each patient, four cross‐sections and four longitudinal sections, each on a different myofibre, were used. Photographs were taken at random. Myofibrils area, mitochondrial area, and lipid droplets area were manually analysed with Fiji software (ImageJ 1.53f51, Wayne Rasband and contributors, NIH, USA), using polygon selections. For each patient, median myofibrils area was calculated on at least 30 myofibrils per section, median mitochondrial area was calculated on at least 30 mitochondria per section, and median lipid droplets area was calculated from all measurable lipid droplets.
Gene and protein expression
A portion of the biopsy was stored at 4°C in RNAlater™ Stabilization Solution (ThermoFisher Scientific Scientific). All biopsies were crushed using a cryo‐grinder, including a Cryolys cooling system (Bertin Instruments) and a Precellys 24 homogenizer (Bertin Instruments). Extractions of RNA, DNA, and proteins from the same sample were performed using the NucleoSpin® TriPrep (Macherey‐Nagel) kit. The muscle fibres were ground in the RP1 buffer provided with the kit, at 1 mL/10 mg fibre (with a maximum of ~25 mg biopsy), then lysed by adding β‐mercaptoethanol. DNA, RNA, and proteins were purified following the protocol provided by the manufacturer and stored at −80°C. Quantification of mitochondrial DNA and mRNA analyses were performed by qPCR and RT‐qPCR, respectively. The detailed procedure can be found in the supporting information. The primer sequences are listed in Tables S1 and S2. Protein expression levels were determined by western blot. Experimental procedure and the list of primary antibodies used can be found in the supporting information.
Statistical analysis
The statistical analyses were performed using GraphPad Prism® for Windows (v.6.01, La Jolla, California, USA). D'Agostino and Pearson omnibus normality tests were performed to verify the Gaussian normal distribution of continuous variables. We used Kruskal–Wallis test with Dunn's post hoc tests, Spearman correlation coefficients to compare non‐normal continuous variables, and Pearson correlation coefficients for normal distribution variables. Data are presented with interquartile range (IQR) box and min‐to‐max whiskers. Outliers were excluded using Grubbs' test α = 0.05. We considered P ≤ 0.05 to be statistically significant.
Despite the importance of men/women distinction, the analyses on the skeletal muscle biopsies could not be performed by separating the patients by gender due to a too small number of patients and the resulting lack of statistical power. However, men and women were distinguished by different symbols in each graph.
Results
Forty‐five patients were included in the METERMUCADIG (NCT02573974) clinical protocol. A CT scanner was recovered for all 45 patients, while a skeletal muscle biopsy was collected for 39 of them. Of the six patients without skeletal muscle biopsy, four died before their PAC insertion, during which the biopsy is collected; and for the other two, the biopsy was unusable, of poor quality and with too much fatty and fibrous connective tissue.
Patients characteristics at inclusion
Of the 45 patients included, there were 30 (67%) men and 15 (33%) women, with a median age at inclusion of 67 years (IQR, 59–77) (Table 1). Eighteen (40%) patients were managed for metastatic pancreatic cancer and 12 (27%) for metastatic colorectal cancer. At the same time, 5 (11%) patients with locally advanced pancreatic cancer and 10 (22%) patients with localized colon cancer that had undergone surgery were included. Nearly half of the patients had a World Health Organization performance status of 0. Eleven (24%) patients had type II diabetes, 10 (22%) had dyslipidaemia, 6 (13%) had heart failure, 3 (7%) had chronic inflammatory disease, and 2 (4%) had hypothyroidism. All these patients were under treatment, except for three patients with dyslipidaemia, who did not have corrective treatment for their condition. The median BMI and SMI were 22.7 kg/m2 (IQR, 21.1 to 26.3) and 44.5 cm2/m2 (IQR, 40.3 to 49.1) in men; and 20.8 kg/m2 (IQR, 19.5 to 25.3; ♂ vs. ♀ P = 0.296) and 36.2 cm2/m2 (IQR, 33.9 to 41.9; ♂ vs. ♀ P = 0.0002) in women, respectively.
Table 1.
Patients characteristics
| Characteristic | No. (%) | Median | IQR |
|---|---|---|---|
| Age (years) | 67.0 | 59.0–76.5 | |
| Sex | |||
| Women | 15 (33) | ||
| Men | 30 (67) | ||
| Cancer | |||
| Colorectal | 22 (49) | ||
| Pancreas | 23 (51) | ||
| Metastatic cancer | 30 (67) | ||
| WHO performance status (n = 44) | |||
| 0 | 20 (45) | ||
| 1 | 17 (39) | ||
| 2 | 5 (11) | ||
| 3 | 2 (5) | ||
| BMI (kg/m2) | 22.4 | 19.8–26.3 | |
| BMI category (kg/m2) | |||
| Underweight (<18.5) | 5 (11) | ||
| Normal weight (18.5 to 24.9) | 27 (60) | ||
| Overweight (25 to 29.9) | 9 (20) | ||
| Obese (≥30) | 4 (9) | ||
BMI, body mass index; WHO, World Health Organization.
There were 8 (18%) NC patients, and 18 (40%) and 19 (42%) patients with mild (MC) and severe (SC) cachexia, respectively. But a pectoralis major biopsy has been collected only for 6 NC, 17 MC, and 16 SC. There was no significant difference in age (NC, 73 years old, IQR 61.5–78.5; MC, 65 years old, IQR 55.8–74.5; SC, 68 years old, IQR 58.0–78.0; P = 0.506), distribution of colorectal and pancreatic (NC, 62.5%/37.5%; MC, 50%/50%; SC, 42%/58%; P = 0.628), metastatic or locally advanced cancers (NC, 62.5%/37.5%; MC, 61%/39%; 74%/26%; P = 0.699) between groups. For both men and women, we also observed no difference in BMI, fat mass, muscle strength, and C‐reactive protein (CRP) concentration between cachexia groups (Table 2). The brachial circumference of men with SC was significantly smaller compared with that of NC men (NC, 30.8 cm, IQR 27.8–36.5 vs. SC, 27.5 cm, IQR 24.1–29.6, P = 0.049). No such difference was found for women (Table 2). Women with SC appeared to have a smaller waist size, compared with women with MC (MC, 88.0 cm, IQR 85.0–109.5 vs. SC, 80.5 cm, IQR 79.0–85.0, P = 0.027). No such difference was found for men (Table 2). The analysis of several clinical haematological parameters, such as albumin, cholesterol, triglycerides, and adiponectin, revealed no difference upon comparing NC patients, patients with MC or SC (Table S3). Only serum creatinine was significantly decreased in patients with MC or SC compared with NC patients (NC, 76.5 μmol/L, IQR 68.5–104.0; MC, 60.0 μmol/L, IQR 53.5–71.5; SC, 59.0 μmol/L, IQR 50.0–72.0; NC vs. MC, P = 0.022 and NC vs. SC, P = 0.011). It correlated positively with SMI (Spearman P = 0.005; r = 0.419).
Table 2.
Patients characteristics per sex and cachexia groups
| Men (n = 30) | ||||||||||||
|---|---|---|---|---|---|---|---|---|---|---|---|---|
| Characteristic | Noncachectic (NC, n = 7) | Mild cachexia (MC, n = 13) | Severe cachexia (SC, n = 10) | P value | ||||||||
| No. (%) | Median | IQR | No. (%) | Median | IQR | No. (%) | Median | IQR | NC vs. MC | NC vs. SC | MC vs. SC | |
| Body weight loss (%) | 4.0 | 3.0–6.0 | 5.0 | 3.0–10.0 | 17.5 | 9.8–22.2 | 0.613 | 0.002 | 0.002 | |||
| BMI (kg/m2) | 24.3 | 21.5–30.8 | 22.6 | 21.0–24.7 | 21.3 | 18.2–26.3 | 0.213 | 0.085 | 0.530 | |||
| Body measurements | ||||||||||||
| Waist size, cm (n = 29) | 95.5 | 86.1–115.0 | 93.0 | 87.0–102.5 | 91.0 | 87.0–106.8 | 0.499 | 0.710 | 0.737 | |||
| Brachial circumference, cm (n = 29) | 30.8 | 27.8–36.5 | 28.5 | 25.5–30.5 | 27.5 | 24.1–29.6 | 0.180 | 0.049 | 0.395 | |||
| Average muscle strength, kg (n = 28) | 39.6 | 33.9–56.2 | 40.9 | 30.2–54.1 | 35.8 | 29.8–61.4 | 0.892 | 0.768 | 0.839 | |||
| Body composition parameters | ||||||||||||
| Skeletal muscle area, cm2 | 143.2 | 118.5–195.5 | 131.9 | 124.3–147.6 | 125.4 | 115.1–146.5 | 0.402 | 0.167 | 0.493 | |||
| Skeletal muscle index, cm2/m2 | 52.6 | 44.4–67.5 | 45.5 | 43.1–48.0 | 40.1 | 37.4–43.8 | 0.162 | 0.001 | 0.032 | |||
| Patients with low muscle mass | 0 | 6 (46) | 10 (100) | |||||||||
| Skeletal muscle density, HU (n = 26) | 29.5 | 25.3–32.8 | 32.8 | 27.7–39.1 | 26.6 | 21.7–34.8 | 0.258 | 0.620 | 0.063 | |||
| Total adipose tissues, cm2 | 234.8 | 120.9–477.7 | 290.1 | 168.3–374.6 | 284.7 | 211.9–473.0 | 0.790 | 0.856 | 0.611 | |||
| Estimated WFM, kg | 20.1 | 12.4–36.6 | 23.9 | 15.6–29.6 | 23.5 | 18.6–36.3 | 0.790 | 0.856 | 0.611 | |||
| Haematological parameters | ||||||||||||
| CRP, mg/L (n = 27) | 2.4 | 1.1–5.8 | 6.0 | 2.2–28.5 | 14.6 | 1.7–45.9 | 0.253 | 0.127 | 0.581 | |||
| Women (n = 15) | ||||||||||
|---|---|---|---|---|---|---|---|---|---|---|
| Characteristic | Noncachectic (NC, n = 1) | Mild cachexia (MC, n = 5) | Severe cachexia (SC, n = 9) | P value | ||||||
| No. (%) | Median | IQR | No. (%) | Median | IQR | No. (%) | Median | IQR | MC vs. SC | |
| Body weight loss (%) | 8.0 | nd | 9.0 | 0.0–21.5 | 16.0 | 10.5–17.0 | 0.226 | |||
| BMI (kg/m2) | 29.4 | nd | 23.0 | 19.5–28.8 | 20.0 | 19.5–22.4 | 0.298 | |||
| Body measurements | ||||||||||
| Waist size (cm) | 103.0 | nd | 88.0 | 85.0–109.5 | 80.5 | 79.0–85.0 | 0.027 | |||
| Brachial circumference (cm) | 34.0 | nd | 29.5 | 27.0–31.0 | 26.0 | 24.0–28.3 | 0.101 | |||
| Average muscle strength (kg) | 29.0 | nd | 21.8 | 19.6–27.8 | 19.7 | 16.5–24.9 | 0.298 | |||
| Body composition parameters | ||||||||||
| Skeletal muscle area (cm2) | 118.0 | nd | 105.0 | 93.2–136.0 | 85.4 | 79.4–104.5 | 0.083 | |||
| Skeletal muscle index (cm2/m2) | 44.4 | nd | 41.9 | 34.2–48.1 | 35.6 | 33.2–36.6 | 0.147 | |||
| Patients with low muscle mass | 0 | 2 (40) | 9 (100) | |||||||
| Skeletal muscle density, HU (n = 12) | nd | nd | 30.4 | 25.6–40.6 | 25.4 | 21.1–36.0 | 0.283 | |||
| Total adipose tissues (cm2) | 483.8 | nd | 363.8 | 176.0–530.1 | 164.4 | 149.9–278.7 | 0.298 | |||
| Estimated WFM (kg) | 37.0 | nd | 28.9 | 16.1–40.2 | 15.3 | 14.3–23.1 | 0.298 | |||
| Haematological parameters | ||||||||||
| CRP, mg/L (n = 13) | 52.8 | nd | 10.3 | 3.6–28.1 | 18.5 | 3.9–66.2 | 0.639 | |||
BMI, body mass index; CRP, C‐reactive protein; HU, Hounsfield unit; IQR, interquartile range; nd, not determined; WFM, whole‐body fat mass.
Skeletal muscle fibres area decreases with severity of cachexia in gastrointestinal cancer patients
We observed a significantly smaller median area of skeletal muscle fibres in patients with SC compared with NC patients (NC, 3352 μm2, IQR 2801–3843 vs. SC, 1771 μm2, IQR 1330–2823, P = 0.0052) (Figure 1A–B). The median area of the fibres correlated positively with SMI: the lower the SMI of the patients, the smaller the median area of their muscle fibres (Spearman P = 0.0007; r = 0.541) (Figure 1C). It also tended to correlate negatively with body WL (Pearson P = 0.054; r = −0.333) (Figure 1D). Median surface area of the myofibrils was not different between groups (Figure 1E).
Figure 1.
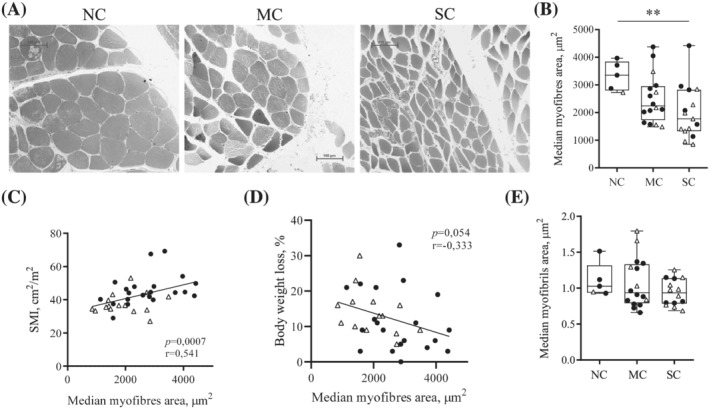
Pectoralis major myofibres area decreases with progression of cachexia in gastrointestinal cancer patients. (A) Representative observation by optical microscopy of pectoralis major myofibres stained with toluidine blue in noncachectic patients (NC), patients with mild cachexia (MC) or severe cachexia (SC). Scale 100 μm. (B) Median myofibres area. For each patient, the median myofibres area was calculated on approximately 200 myofibres. Correlations between median myofibres area and (C) skeletal muscle index (SMI) (Spearman); (D) body weight loss percentage (Pearson). (E) Median area of myofibrils observed by transmission electron microscopy. For each patient, four cross‐sections, each on a different myofibre, were used. Median myofibrils area was calculated on at least 30 myofibrils per section. Data are presented with IQR box and min‐to‐max whiskers and were compared using Kruskal–Wallis tests with Dunn's post hoc tests. Outliers were excluded using Grubbs' test α = 0.05. Men: black dots, women: white triangles. *P < 0.05, **P < 0.01.
Cancer cachexia is associated with decrease in MAFbx protein expression
We analysed the gene expression of two E3‐ligases of the ubiquitin‐proteasome pathway, as markers of muscle proteolysis. While mRNA and protein expression of MuRF1 remained unchanged across the groups, MAFbx protein content was lower in patients with SC or MC compared with NC patients (P = 0.001 and P = 0.004, respectively) (Figures 2A and S1). Moreover, MAFbx protein expression correlated positively with SMI (Spearman P = 0.013; r = 0.42) (Figure 2B). Study of the protein expression of Beclin, p62, and LC3BI, three markers of autophagy, revealed no significant difference between the groups (Figure 2C).
Figure 2.
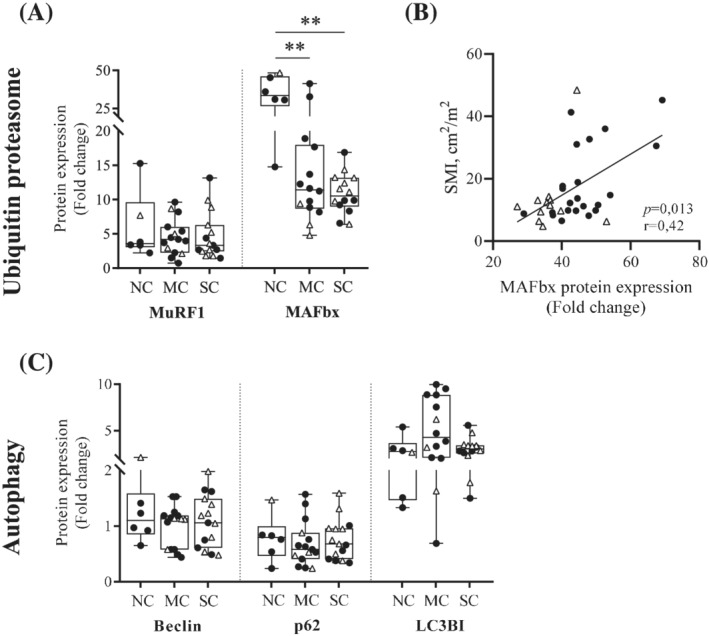
Cancer cachexia is associated with decrease in MAFbx protein expression in pectoralis major muscle. (A) Protein expression levels of two markers of the proteasome‐mediated degradation pathway: MuRF1 and MAFbx, measured in pectoralis major biopsies from noncachectic patients (NC), patients with mild cachexia (MC), or severe cachexia (SC). (B) Spearman correlation between the protein expression level of MAFbx and the skeletal muscle index (SMI). (C) Protein expression levels of three markers of autophagic proteolysis: Beclin, p62, and LC3BI. Protein expression levels were determined by western blot and normalized to Tubulin. Data are presented with IQR box and min‐to‐max whiskers and were compared using Kruskal–Wallis tests with Dunn's post hoc tests. Outliers were excluded using Grubbs' test α = 0.05. Men: black dots, women: white triangles. *P < 0.05, **P < 0.01.
Cancer cachexia leads to increased mitochondrial energy wasting
Median oxygen consumption in nonphosphorylating state (state 4) after addition of glutamate/malate/succinate was significantly increased in patients with SC compared with NC patients (NC, 11.1 pmol·s−1·mg−1, IQR 7.78–21.7 vs. SC, 24.1 pmol·s−1·mg−1, IQR 21.4–36.3, P = 0.028). The median value for patients with MC was intermediate but without significant difference compared with the other two groups (MC, 20.1 pmol·s−1·mg−1, IQR 14.4–31.5) (Figure 3A). Neither oxygen consumption in phosphorylating state (state 3), or uncoupled state, nor complex 4 activity‐related oxygen consumption were different between the three groups (Figure 3A). State 3/state 4 ratio was significantly decreased in cancer patients with SC compared with NC patients (Figure S2). Differences in mitochondrial surface area in transmission electron microscopy were visible between patients (Figure 3B), and this parameter tended to increase in patients with SC compared with patients with MC only (MC, 0.062 μm2, IQR 0.048–0.069 vs. SC, 0.070 μm2, IQR 0.054–0.092, P = 0.056) (Figure 3C). There was no difference in the amount of mitochondrial DNA (Figure 3D). Lastly, the expression of several markers of mitochondrial biogenesis (NRF2, PGC1α, and MTFA—Figures 4A,B and S1), fusion (OPA1, Mfn1, and Mfn2—Figures 4C,D and S1), and fission (Drp1, Mff, and Fis1—Figures 4E,F and S1) remained unchanged upon comparing NC patients, patients with MC or SC.
Figure 3.
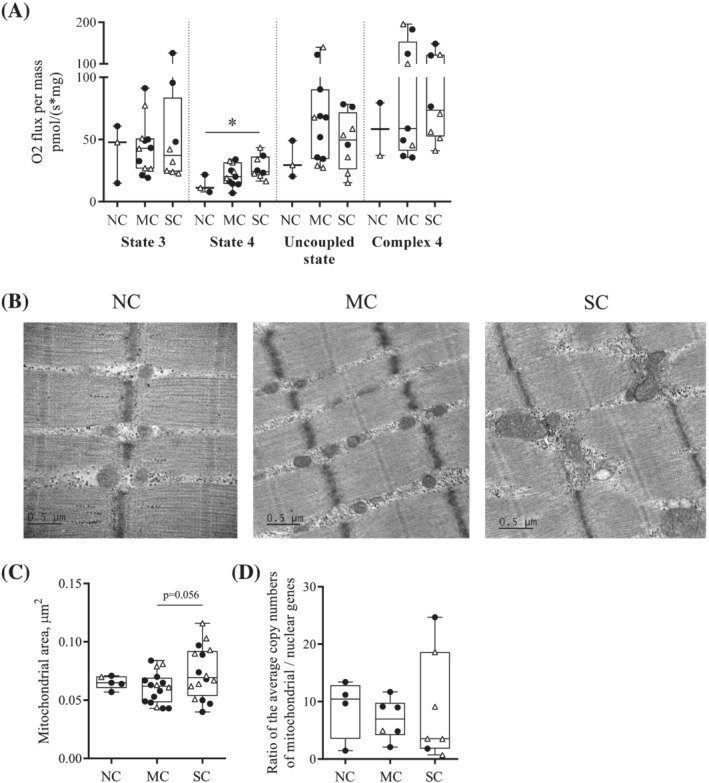
Cancer cachexia affects mitochondrial bioenergetics and structure in pectoralis major muscle. (A) Mitochondrial O2 consumption in permeabilized pectoralis major myofibres from noncachectic patients (NC), patients with mild cachexia (MC), or severe cachexia (SC). O2 consumption related to phosphorylation (state 3—ADP) and to energy waste (state 4—oligomycin); uncoupled state (FCCP); complex 4 (ascorbate and TMPD). (B) Representative observations in TEM (X10000) of longitudinal sections of pectoralis major from NC, MC, and SC patients. (C) Mitochondrial area analysis in TEM. For each patient, four cross‐sections and four longitudinal sections, each on a different myofibre, were used. Median mitochondrial area was calculated on at least 30 mitochondria per section. (D) Quantification of mitochondrial DNA by qPCR. Data are presented with IQR box and min‐to‐max whiskers and were compared using Kruskal–Wallis tests with Dunn's post hoc tests. Outliers were excluded using Grubbs' test α = 0.05. Men: black dots, women: white triangles. *P < 0.05.
Figure 4.
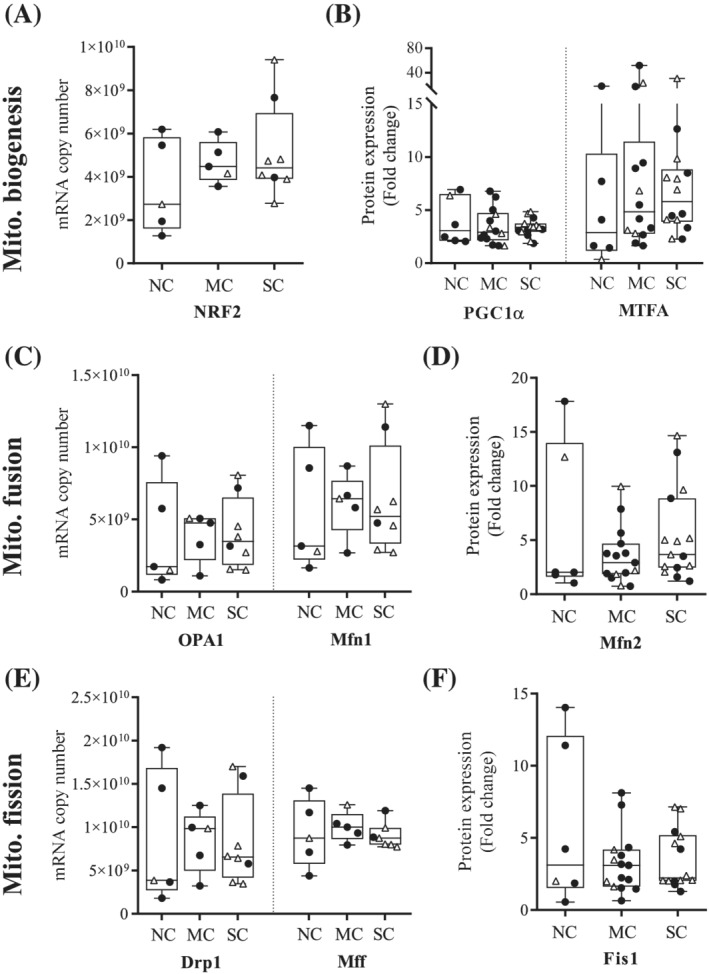
Cancer cachexia does not affect mitochondrial biogenesis, fusion, and fission in pectoralis major muscle. (A) mRNA and (B) protein expression of three markers of mitochondrial biogenesis: NRF2, PGC1α, and MTFA, measured in pectoralis major biopsies from noncachectic patients (NC), patients with mild cachexia (MC) or severe cachexia (SC). (C) mRNA and (D) protein expression of three markers of mitochondrial fusion: OPA1, Mfn1, and Mfn2. (E) mRNA and (F) protein expression of three markers of mitochondrial fission: Drp1, Mff, and Fis1. mRNA expression levels were determined by absolute RT‐qPCR, while protein expression levels were determined by Western Blot and normalized to Tubulin. Data are presented with IQR box and min‐to‐max whiskers and were compared using Kruskal–Wallis tests with Dunn's post hoc tests. Outliers were excluded using Grubbs' test α = 0.05. Men: black dots, women: white triangles.
Cancer cachexia does not affect intramyocellular lipid droplets
The median lipid droplets area did not differ between groups (Figure 5A). However, a precise quantification of the number of lipid droplets could not be performed because of the very large intrapatient heterogeneity in the distribution of lipid droplets within each fibre and between fibres. Therefore, we quantified mRNA expression of four perilipins and the protein expression of two of them as markers of lipid droplets. We found no association between the gene or protein expression of these four perilipins and the cachectic status of patients (Figures 5B,C and S1).
Figure 5.
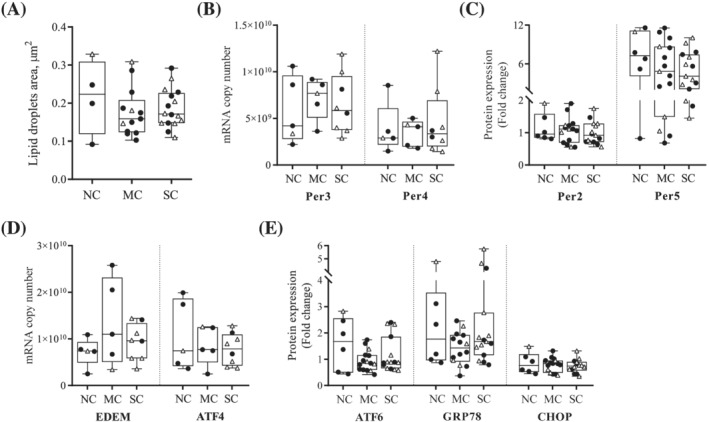
Cancer cachexia does not induce the accumulation of intramyocellular lipid droplets or ER stress in pectoralis major muscle. (A) Lipid droplets area analysis in TEM. For each patient, four cross‐sections and four longitudinal sections, each on a different myofibre, were used. Median area was calculated from all measurable lipid droplets. (B) mRNA expression and (C) protein expression of perilipins measured in pectoralis major biopsies from noncachectic patients (NC), patients with mild cachexia (MC) or severe cachexia (SC). (D) mRNA expression and (E) protein expression of five markers of ER stress: EDEM, ATF4, ATF6, GRP78, and CHOP. mRNA expression levels were determined by absolute RT‐qPCR, while protein expression levels were determined by Western Blot and normalized to Tubulin. Data are presented with IQR box and min‐to‐max whiskers and were compared using Kruskal–Wallis tests with Dunn's post hoc tests. Outliers were excluded using Grubbs' test α = 0.05. Men: black dots, women: white triangles.
Cancer cachexia does not induce endoplasmic reticulum stress
We analysed the mRNA and protein expression of several markers of ER stress: EDEM, ATF4, ATF6, GRP78, and CHOP (Figures 5D,E and S1) and observed no difference upon comparing NC patients, patients with MC or SC.
Discussion
The objective of the present study was to establish skeletal muscle structural and metabolic alterations in pectoralis major biopsies from cachectic patients with colorectal or pancreatic cancer.
The most original datum in our study is that mitochondrial oxygen consumption related to energy wasting was twice as high in pectoralis major muscle from cancer patients with SC compared with NC patients. To date, no clinical study has explored mitochondrial functionality in skeletal muscle of cancer patients with cachexia. Only preclinical studies had shown a decrease in the activity of some respiratory chain complexes 6 ; S3,S4 or oxidative phosphorylation uncoupling. 22 , 23 , 24 This doubling in energy wasting, by reduction in ATP production efficiency, could significantly contribute to cancer cachexia by increasing energy expenditure since skeletal muscle accounts for 15–30% of the basal energy expenditureS10 (refer to review 25 ). Moreover, increase in mitochondrial energy wasting associated to reduction to ATP production efficiency can participate to muscle fatigue. State 3/state 4 ratio was significantly decreased in cancer patients with SC compared with NC patients, confirming the hypothesis of coupling inefficiency associated with cachexia. Mitochondrial area was higher in cancer patients with SC, compared with patients with MC, close to being significant (P = 0.056). There was no significant difference in mRNA and protein expression of markers of mitochondrial biogenesis, fusion, and fission, and no difference in the amount of mitochondrial DNA between groups. Our findings are in agreement with de Castro et al. who reported an increase in mitochondrial intermyofibrillar area in MET and no change in mitochondrial DNA copy number in cachectic patients with gastric or colorectal cancer compared with NC patients. 7 It seems unlikely that the mitochondrial swelling observed in the present study was due to an increased quantity of mitochondria or to alteration of mitochondrial networks. However, further analyses of Drp1 protein expression (phosphorylation and dimerization) are required to verify this hypothesis. Dubinin et al. described a calcium‐dependent swelling of skeletal muscle mitochondria and its association with the opening of mitochondrial permeability transition pore in the context of Duchenne muscular dystrophy. 26 Indeed, calcium is thought to play an important role in regulating mitochondrial function. Recent work showed an inhibiting effect of calcium load on mitochondrial oxidative phosphorylation. 27 Further research is needed to confirm a disturbance of calcium homeostasis in skeletal muscle mitochondria of cachectic cancer patients to explain the morphological and metabolic abnormalities.
MuRF1 and MAFbx are considered as the main contributors for the increased proteolysis. 5 Surprisingly, myofibres atrophy was associated with a decrease in MAFbx protein expression, while MuRF1 protein expression remain unchanged between the three groups [whatever the cachexia classification (Figure S3)]. We also observed a significant positive correlation between MAFbx protein expression and SMI of patients. This observation goes in contradiction with the results of preclinical studies, which showed abundant evidence for increased proteolysis through the UPS pathway (refer to review 28 ). Regarding clinical studies, results were much more controversial: one study reported an increased expression of UPS markers (MuRF1 and polyubiquitinylated proteins) in gastric cancer patients with cachexia and/or muscle loss, 29 whereas numerous others have found no impairment in the regulation of proteolysis associated with cancer cachexia. 30 , 31 ; S11‐S13 To our knowledge, this is the first clinical study to show decrease in MAFbx protein expression in the skeletal muscle from cancer patients with cachexia. Bodine and Baehr listed several skeletal muscle atrophy models in which MAFbx, but not MuRF1, was activated, showing that an activation or downregulation of both E3 ubiquitin ligases is not essential for the process of ubiquitination. 32 Downregulation of MAFbx in the pectoralis major of cancer patients with SC could be explained by an ongoing regenerative process in the skeletal muscle, trying to counteract muscle wasting during cancer cachexia, as mentioned in two recent reviews. 33 , 34 Indeed, Okada et al. reported decreased expression of MAFbx in regenerating skeletal muscle after eccentric exercise. 35 It would be interesting to further investigate the proteasome‐mediated degradation pathway through other relevant ubiquitin ligases, as it seems likely that many others, with different substrate‐specificity, are involved in cancer cachexia. Fbxl22 36 and Musa1, 37 for example, would be valuable targets as they have been recently identified in the context of muscle atrophy. Analysis of myostatin‐related and IGF‐related signalling pathways would also be interesting to further improve our understanding on the interplay of molecular mechanisms underlying skeletal muscle wasting during cancer cachexia (refer to review 38 ).
Intramyocellular lipid droplets in pectoralis major muscle are not affected by cancer cachexia. Lipid droplets area, and ARNm and protein expression of perilipins, the most abundant proteins that cover the lipid droplets, remained unchanged between the three groups. Our data are in contradiction with those reported by Stephens et al., 12 where the rectus abdominis was sampled. Skeletal muscle in the abdomen being more exposed to adipose tissue than the pectoral muscle may be an explanation.
Pectoralis major muscle seems to be an interesting way to explore skeletal muscle alterations in cachectic cancer patients, regardless of their nutritional status. Most clinical studies that have investigated skeletal muscle have used biopsies from the rectus abdominis, which are frequently sampled during abdominal surgery. However, not all patients with colorectal or pancreatic cancer, especially advanced cancer, are eligible for pelvic surgery due to poor nutritional status. PAC was therefore a surgical opportunity to access sufficient biopsy from the pectoralis major for all patients, regardless of their nutritional status. To our knowledge, this is the first clinical study to use pectoralis major biopsies from cachectic cancer patients. We observed a significant skeletal muscle atrophy in cancer patients with SC compared with NC cancer patients. Only the myofibres area was affected, not the myofibrils. Median myofibres area correlated positively with SMI and tended to correlate negatively with body WL. This observation is consistent with two clinical studies including gastrointestinal cancer patients, 29 , 39 which showed a significant decrease in the cross‐sectional area of rectus abdominis myofibres associated with cachexia and muscle loss. This warrants further investigation in clinical and preclinical studies, on the hypothesis that cancer cachexia affects anatomically distinct muscle groups.
Cachexia classification is a central element for clinical studies. There are currently no established guidelines for cachexia classification for clinical studies. Most studies that have explored structural and metabolic parameters in skeletal muscle biopsies, have used the 2011 consensus, 1 or a single criterion of WL > 5% or 10% to constitute their groups of cachectic and NC cancer patients. However, a specified percentage of WL does not take into consideration the patient's BMI. Using only a specified percentage of WL has the disadvantage of grouping patients with different mortality risks and certainly different degrees of malnutrition. Therefore, by studying a total population of 8160 Europeans and Canadians with different types of cancer, a consortium of experts developed a robust five‐level scoring system (grades 0–4) incorporating the risk of decreased survival based on the patient's BMI and %WL. 19 For our clinical protocol, cachexia classification was adapted from the scoring system described above. 19 We used two criteria: severity of WL and muscle mass, based on SMI cut‐offs. 18 Patients were divided into three groups according to the severity of cancer cachexia: (i) NC: weight‐stable patients (grades 0 to 2 WL) with normal muscle mass (SMI > cut‐off); (ii) MC: weight‐stable patients (grades 0 to 2 WL) with low muscle mass (SMI < cut‐off) and weight‐losing patients (grade 3 or 4 WL) with normal muscle mass (SMI > cut‐off); and (iii) SC: weight‐losing patients (grade 3 or 4 WL) with low muscle mass (SMI < cut‐off).
The blood concentration of CRP, a well‐used marker of systemic inflammation, was similar between the three groups. Our results are consistent with previous studies that showed no significant difference in CRP serum concentration between cachectic and NC cancer patients. 30 ; S14‐S18 It was recently suggested that low levels of serum creatinine could be a prognostic biomarker of skeletal muscle atrophy in cancer patients. 40 Our data corroborate these findings.
Despite having included more patients than most clinical studies on cancer cachexia focusing on skeletal muscle alterations, the small number of patients in each group remains a limitation of the present study. The different parameters on biopsies could not be analysed for all patients due to lack of material. Larger studies in humans are essential to replicate these findings. Because results of clinical studies diverge, the mechanisms underlying skeletal muscle wasting characteristic of cancer cachexia are still far from being understood in patients. Additional clinical studies are essential to further the exploring and understanding of these mechanisms. It is also crucial to improve and standardize the diagnostic criteria for cancer cachexia to ameliorate the robustness of the data obtained in patients.
In conclusion, for the first time, we demonstrated an increase in mitochondrial energy wasting in pectoralis major of cachectic cancer patients. Similarly, a positive correlation between median myofibres area and SMI supports that the muscle wasting characteristic of cancer cachexia could be partially explained by a decrease in myofibres area. In addition, cancer cachexia is associated with a decrease in MAFbx protein expression, which could be a compensation mechanism in the pectoralis major to counteract muscle wasting. Pectoralis major muscle biopsy can be used to explore mechanisms underlying muscle wasting in cancer cachexia regardless of the nutritional status of patients.
Conflict of interest
The authors declare that they have no conflict of interest in connection with this article.
Funding
A. Dolly received financial support from the French Ministry of Higher Education, Research and Innovation and the French Society of Clinical Nutrition and Metabolism (SFNCM, Exceptional Research Prize 2018). METERMUCADIG clinical study promotion was supported by Institut National du Cancer (INCa, PLBio Grant # 2015‐115), Ligue Nationale Contre le Cancer (comités 22, 29, 37, 85), SFNCM ( Research Prize under the auspices of SFNCM 2014) and Canceropole Grand Ouest.
Supporting information
Figure S1: mRNA expression analysis
mRNA expression levels of (A) two markers of the proteasome‐mediated degradation pathway, (B) two markers of mitochondrial biogenesis, (C) one marker of mitochondrial fusion, (D) one marker of mitochondrial fission, (E) two markers of lipid droplets and (F) two markers of ER stress, determined by absolute RT‐qPCR. Data are presented with IQR box and min‐to‐max whiskers and were compared using Kruskal‐Wallis tests with Dunn's post hoc tests. Men: black dots, women: white triangles.
Figure S2: Cancer cachexia affects mitochondrial bioenergetics
Mitochondrial oxygen consumption ratio in permeabilized pectoralis major myofibers from non‐cachectic patients (NC), patients with mild cachexia (MC) or severe cachexia (SC).
Figure S3: MAFbx and MuRF1 protein expression depending on the cachexia classification
MuRF1 protein expression level measured in pectoralis major biopsies from (A) all patients or (B) men only who encountered −/+ 5% or 10% weight loss and from cancer patients with normal muscle mass (SMI > cutoff) vs patients with low muscle mass (SMI < cutoff). MAFbx protein expression level measured in pectoralis major biopsies from (C) all patients or (D) men only who encountered −/+ 5% or 10% weight loss and from cancer patients with normal muscle mass (SMI > cutoff) vs patients with low muscle mass (SMI < cutoff). Data are presented with IQR box and min‐to‐max whiskers and were compared using t tests. Men: black dots, women: white triangles.
Table S1. Primer sequences used for qPCR on DNA samples
Table S2. Primer sequences used for qPCR on RNA samples
Table S3. Patients clinical hematological parameters
CRP: C‐reactive Protein; HDL: High Density Lipoprotein; LDL: Low Density Lipoprotein; ns: not statistically significant
Data S1. Supplementary methods
Data S2. Supplementary references
Acknowledgements
Authors thank Elodie Roy, Claire Jollivet, and Sophie Gounin for technical support, data management, and patient's recruitment; Roseline Guibon, from the Department of Pathology, University Hospital of Tours, for histological analysis; Microscopy platform from University of Tours for TEM images. Authors thank Mihane Nayeri and Frederic Marques from the Department of Digestive, Oncological, Endocrine, Hepato‐Biliary, Pancreatic and Liver Transplant Surgery, University Hospital of Tours; Clémence Perray, Clémentine Duvivier, Driffa Moussata, and David Regnault from the Department of hepatogastroenterology and digestive oncology, University Hospital of Tours; and the association ARFMAD. The authors of this manuscript certify that they comply with the ethical guidelines for authorship and publishing in the Journal of Cachexia, Sarcopenia and Muscle.S19
Dolly A., Lecomte T., Tabchouri N., Caulet M., Michot N., Anon B., Chautard R., Desvignes Y., Ouaissi M., Fromont‐Hankard G., Dumas J.‐F., and Servais S. (2022) Pectoralis major muscle atrophy is associated with mitochondrial energy wasting in cachectic patients with gastrointestinal cancer, Journal of Cachexia, Sarcopenia and Muscle, 13, 1837–1849, 10.1002/jcsm.12984
Contributor Information
Adeline Dolly, Email: adelinedolly@outlook.fr.
Stéphane Servais, Email: stephane.servais@univ-tours.fr.
References
- 1. Fearon K, Strasser F, Anker SD, Bosaeus I, Bruera E, Fainsinger RL, et al. Definition and classification of cancer cachexia: an international consensus. Lancet Oncol 2011;12:489–495. [DOI] [PubMed] [Google Scholar]
- 2. Bachmann J, Heiligensetzer M, Krakowski‐Roosen H, Büchler MW, Friess H, Martignoni ME. Cachexia worsens prognosis in patients with resectable pancreatic cancer. J Gastrointest Surg 2008;12:1193–1201. [DOI] [PubMed] [Google Scholar]
- 3. Fearon KC, Voss AC, Hustead DS, Cancer Cachexia Study Group . Definition of cancer cachexia: effect of weight loss, reduced food intake, and systemic inflammation on functional status and prognosis. Am J Clin Nutr 2006;83:1345–1350. [DOI] [PubMed] [Google Scholar]
- 4. Armstrong VS, Fitzgerald LW, Bathe OF. Cancer‐associated muscle wasting—candidate mechanisms and molecular pathways. Int J Mol Sci 2020;21:9268. [DOI] [PMC free article] [PubMed] [Google Scholar]
- 5. Penna F, Ballarò R, Beltrà M, de Lucia S, García Castillo L, Costelli P. The skeletal muscle as an active player against cancer cachexia. Front Physiol 2019;10:10. [DOI] [PMC free article] [PubMed] [Google Scholar]
- 6. Julienne CM, Dumas J‐F, Goupille C, Pinault M, Berri C, Collin A, et al. Cancer cachexia is associated with a decrease in skeletal muscle mitochondrial oxidative capacities without alteration of ATP production efficiency. J Cachexia Sarcopenia Muscle 2012;3:265–275. [DOI] [PMC free article] [PubMed] [Google Scholar]
- 7. de Castro GS, Simoes E, Lima JDCC, Ortiz‐Silva M, Festuccia WT, Tokeshi F, et al. Human cachexia induces changes in mitochondria, autophagy and apoptosis in the skeletal muscle. Cancer 2019;11:1264. [DOI] [PMC free article] [PubMed] [Google Scholar]
- 8. Marzetti E, Lorenzi M, Landi F, Picca A, Rosa F, Tanganelli F, et al. Altered mitochondrial quality control signaling in muscle of old gastric cancer patients with cachexia. Exp Gerontol 2017;87:92–99. [DOI] [PubMed] [Google Scholar]
- 9. van der Ende M, Grefte S, Plas R, Meijerink J, Witkamp RF, Keijer J, et al. Mitochondrial dynamics in cancer‐induced cachexia. Biochim Biophys Acta Rev Cancer 2018;1870:137–150. [DOI] [PubMed] [Google Scholar]
- 10. Anoveros‐Barrera A, Bhullar AS, Stretch C, Esfandiari N, Dunichand‐Hoedl AR, Martins KJB, et al. Clinical and biological characterization of skeletal muscle tissue biopsies of surgical cancer patients. J Cachexia Sarcopenia Muscle 2019;10:1356–1377. [DOI] [PMC free article] [PubMed] [Google Scholar]
- 11. Bhullar AS, Anoveros‐Barrera A, Dunichand‐Hoedl A, Martins K, Bigam D, Khadaroo RG, et al. Lipid is heterogeneously distributed in muscle and associates with low radiodensity in cancer patients. J Cachexia Sarcopenia Muscle 2020;11:735–747. [DOI] [PMC free article] [PubMed] [Google Scholar]
- 12. Stephens NA, Skipworth RJE, Macdonald AJ, Greig CA, Ross JA, Fearon KCH. Intramyocellular lipid droplets increase with progression of cachexia in cancer patients. J Cachexia Sarcopenia Muscle 2011;2:111–117. [DOI] [PMC free article] [PubMed] [Google Scholar]
- 13. Fukawa T, Yan‐Jiang BC, Min‐Wen JC, Jun‐Hao ET, Huang D, Qian CN, et al. Excessive fatty acid oxidation induces muscle atrophy in cancer cachexia. Nat Med 2016;22:666–671. [DOI] [PubMed] [Google Scholar]
- 14. Barreiro E, Salazar‐Degracia A, Sancho‐Muñoz A, Gea J. Endoplasmic reticulum stress and unfolded protein response profile in quadriceps of sarcopenic patients with respiratory diseases. J Cell Physiol 2019;234:11315–11329. [DOI] [PubMed] [Google Scholar]
- 15. Bohnert KR, Gallot YS, Sato S, Xiong G, Hindi SM, Kumar A. Inhibition of ER stress and unfolding protein response pathways causes skeletal muscle wasting during cancer cachexia. FASEB J 2016;30:3053–3068. [DOI] [PMC free article] [PubMed] [Google Scholar]
- 16. Roy A, Kumar A. ER stress and unfolded protein response in cancer cachexia. Cancers (Basel) 2019;11:11. [DOI] [PMC free article] [PubMed] [Google Scholar]
- 17. Dolly A, Dumas J‐F, Servais S. Cancer cachexia and skeletal muscle atrophy in clinical studies: what do we really know? J Cachexia Sarcopenia Muscle 2020;11:1413–1428. [DOI] [PMC free article] [PubMed] [Google Scholar]
- 18. Martin L, Birdsell L, MacDonald N, Reiman T, Clandinin MT, McCargar LJ, et al. Cancer cachexia in the age of obesity: skeletal muscle depletion is a powerful prognostic factor, independent of body mass index. J Clin Oncol 2013;31:1539–1547. [DOI] [PubMed] [Google Scholar]
- 19. Martin L, Senesse P, Gioulbasanis I, Antoun S, Bozzetti F, Deans C, et al. Diagnostic criteria for the classification of cancer‐associated weight loss. JCO 2015;33:90–99. [DOI] [PubMed] [Google Scholar]
- 20. Mourtzakis M, Prado CMM, Lieffers JR, Reiman T, McCargar LJ, Baracos VE. A practical and precise approach to quantification of body composition in cancer patients using computed tomography images acquired during routine care. Appl Physiol Nutr Metab 2008;33:997–1006. [DOI] [PubMed] [Google Scholar]
- 21. Shen W , Punyanitya M, Wang Z, Gallagher D, St‐Onge M‐P, Albu J, et al. Total body skeletal muscle and adipose tissue volumes: estimation from a single abdominal cross‐sectional image. J Appl Physiol 2004;97:2333–2338. [DOI] [PubMed] [Google Scholar]
- 22. Smuder AJ, Roberts BM, Wiggs MP, Kwon OS, Yoo J‐K, Christou DD, et al. Pharmacological targeting of mitochondrial function and reactive oxygen species production prevents colon 26 cancer‐induced cardiorespiratory muscle weakness. Oncotarget 2020;11:3502–3514. [DOI] [PMC free article] [PubMed] [Google Scholar]
- 23. Halle JL, Pena GS, Paez HG, Castro AJ, Rossiter HB, Visavadiya NP, et al. Tissue‐specific dysregulation of mitochondrial respiratory capacity and coupling control in colon‐26 tumor‐induced cachexia. Am J Physiol Regulatory, Integr Comp Physiol 2019;317:R68–R82. [DOI] [PubMed] [Google Scholar]
- 24. Neyroud D, Nosacka RL, Judge AR, Hepple RT. Colon 26 adenocarcinoma (C26)‐induced cancer cachexia impairs skeletal muscle mitochondrial function and content. J Muscle Res Cell Motil 2019;40:59–65. [DOI] [PMC free article] [PubMed] [Google Scholar]
- 25. Argilés JM, López‐Soriano FJ, Busquets S. Muscle wasting in cancer: the role of mitochondria. Curr Opin Clin Nutr Metab Care 2015;18:221–225. [DOI] [PubMed] [Google Scholar]
- 26. Dubinin MV, EYu T, Tenkov KS, Starinets VS, Mikheeva IB, Sharapov MG, et al. Duchenne muscular dystrophy is associated with the inhibition of calcium uniport in mitochondria and an increased sensitivity of the organelles to the calcium‐induced permeability transition. Biochim Biophys Acta (BBA) ‐ Molecular Basis Dis 2020;1866:165674. [DOI] [PubMed] [Google Scholar]
- 27. Strubbe‐Rivera JO, Chen J, West BA, Parent KN, Wei G‐W, Bazil JN. Modeling the effects of calcium overload on mitochondrial ultrastructural remodeling. Appl Sci (Basel) 2021;11:2071. [DOI] [PMC free article] [PubMed] [Google Scholar]
- 28. Sandri M. Protein breakdown in cancer cachexia. Semin Cell Dev Biol 2016;54:11–19. [DOI] [PubMed] [Google Scholar]
- 29. Zhang Y, Wang J, Wang X, Gao T, Tian H, Zhou D, et al. The autophagic‐lysosomal and ubiquitin proteasome systems are simultaneously activated in the skeletal muscle of gastric cancer patients with cachexia. Am J Clin Nutr 2020;111:570–579. [DOI] [PubMed] [Google Scholar]
- 30. Stephens NA, Skipworth RJE, Gallagher IJ, Greig CA, Guttridge DC, Ross JA, et al. Evaluating potential biomarkers of cachexia and survival in skeletal muscle of upper gastrointestinal cancer patients. J Cachexia Sarcopenia Muscle 2015;6:53–61. [DOI] [PMC free article] [PubMed] [Google Scholar]
- 31. MacDonald AJ, Johns N, Stephens N, Greig C, Ross JA, Small AC, et al. Habitual myofibrillar protein synthesis is normal in patients with upper GI cancer cachexia. Clin Cancer Res 2015;21:1734–1740. [DOI] [PubMed] [Google Scholar]
- 32. Bodine SC, Baehr LM. Skeletal muscle atrophy and the E3 ubiquitin ligases MuRF1 and MAFbx/atrogin‐1. Am J Physiol Endocrinol Metab 2014;307:E469–E484. [DOI] [PMC free article] [PubMed] [Google Scholar]
- 33. Martin A, Freyssenet D. Phenotypic features of cancer cachexia‐related loss of skeletal muscle mass and function: lessons from human and animal studies. J Cachexia Sarcopenia Muscle 2021;12:252–273. [DOI] [PMC free article] [PubMed] [Google Scholar]
- 34. Bossola M, Marzetti E, Rosa F, Pacelli F. Skeletal muscle regeneration in cancer cachexia. Clin Exp Pharmacol Physiol 2016;43:522–527. [DOI] [PubMed] [Google Scholar]
- 35. Okada A, Ono Y, Nagatomi R, Kishimoto KN, Itoi E. Decreased muscle atrophy F‐box (MAFbx) expression in regenerating muscle after muscle‐damaging exercise. Muscle Nerve 2008;38:1246–1253. [DOI] [PubMed] [Google Scholar]
- 36. Hughes DC, Baehr LM, Driscoll JR, Lynch SA, Waddell DS, Bodine SC. Identification and characterization of Fbxl22, a novel skeletal muscle atrophy‐promoting E3 ubiquitin ligase. Am J Physiol Cell Physiol 2020;319:C700–C719. [DOI] [PubMed] [Google Scholar]
- 37. Milan G, Romanello V, Pescatore F, Armani A, Paik J‐H, Frasson L, et al. Regulation of autophagy and the ubiquitin‐proteasome system by the FoxO transcriptional network during muscle atrophy. Nat Commun 2015;6:6670. [DOI] [PMC free article] [PubMed] [Google Scholar]
- 38. Marceca GP, Londhe P, Calore F. Management of cancer cachexia: attempting to develop new pharmacological agents for new effective therapeutic options. Front Oncol 2020;10:298. [DOI] [PMC free article] [PubMed] [Google Scholar]
- 39. Johns N, Hatakeyama S, Stephens NA, Degen M, Degen S, Frieauff W, et al. Clinical classification of cancer cachexia: phenotypic correlates in human skeletal muscle. PLoS ONE 2014;9:e83618. [DOI] [PMC free article] [PubMed] [Google Scholar]
- 40. das Neves W, Alves CRR, de Souza Borges AP, de Castro G. Serum creatinine as a potential biomarker of skeletal muscle atrophy in non‐small cell lung cancer patients. Front Physiol 2021;12:625417. [DOI] [PMC free article] [PubMed] [Google Scholar]
Associated Data
This section collects any data citations, data availability statements, or supplementary materials included in this article.
Supplementary Materials
Figure S1: mRNA expression analysis
mRNA expression levels of (A) two markers of the proteasome‐mediated degradation pathway, (B) two markers of mitochondrial biogenesis, (C) one marker of mitochondrial fusion, (D) one marker of mitochondrial fission, (E) two markers of lipid droplets and (F) two markers of ER stress, determined by absolute RT‐qPCR. Data are presented with IQR box and min‐to‐max whiskers and were compared using Kruskal‐Wallis tests with Dunn's post hoc tests. Men: black dots, women: white triangles.
Figure S2: Cancer cachexia affects mitochondrial bioenergetics
Mitochondrial oxygen consumption ratio in permeabilized pectoralis major myofibers from non‐cachectic patients (NC), patients with mild cachexia (MC) or severe cachexia (SC).
Figure S3: MAFbx and MuRF1 protein expression depending on the cachexia classification
MuRF1 protein expression level measured in pectoralis major biopsies from (A) all patients or (B) men only who encountered −/+ 5% or 10% weight loss and from cancer patients with normal muscle mass (SMI > cutoff) vs patients with low muscle mass (SMI < cutoff). MAFbx protein expression level measured in pectoralis major biopsies from (C) all patients or (D) men only who encountered −/+ 5% or 10% weight loss and from cancer patients with normal muscle mass (SMI > cutoff) vs patients with low muscle mass (SMI < cutoff). Data are presented with IQR box and min‐to‐max whiskers and were compared using t tests. Men: black dots, women: white triangles.
Table S1. Primer sequences used for qPCR on DNA samples
Table S2. Primer sequences used for qPCR on RNA samples
Table S3. Patients clinical hematological parameters
CRP: C‐reactive Protein; HDL: High Density Lipoprotein; LDL: Low Density Lipoprotein; ns: not statistically significant
Data S1. Supplementary methods
Data S2. Supplementary references