

Abstract
Cis-regulatory changes are key drivers of adaptative evolution. However, their contribution to metabolic adaptation of organisms is less understood. Here we have utilized a unique vertebrate model, Astyanax mexicanus, different morphotypes of which survive in nutrient-rich surface and nutrient-deprived cave water, to uncover gene regulatory networks underlying metabolic adaptation. We performed genome-wide epigenetic profiling in the liver tissues of Astyanax and found that many of the identified cis-regulatory elements have genetically diverged and have differential chromatin features between surface and cave morphotypes, while retaining remarkably similar regulatory signatures between independently derived cave populations. One such cis-regulatory element in the hpdb gene harbors a genomic deletion in cavefish that abolishes IRF2 repressor binding and derepresses enhancer activity in reporter assays. Selection of this mutation in multiple independent cave populations supports its importance in cave adaptation, providing novel molecular insights into the evolutionary trade-off between loss of pigmentation and adaptation to food-deprived caves.
Cis-regulatory elements are major targets of evolution for shaping phenotypic diversity1–3 and helping organisms adapt to various environmental niches4,5. The role of cis-regulatory changes in the evolution of metabolic adaptations is less understood. The Mexican tetra, Astyanax mexicanus, with its two morphotypes—the river-dwelling surface fish and the cave-dwelling cavefish—provides an exceptional model system to study evolutionary changes at a genetic and genomic level6–8. The surface fish live in nutrient-rich rivers while the cave populations are well adapted to survive in the dark and nutrient-deprived caves, which they colonized around 150,000 years ago9,10. Importantly, many of the cave populations have independently adapted to different cave environments, allowing the study of whether the same genes and regulatory networks were utilized in adaptation or whether evolution took different paths to arrive at similar phenotypes11.
Missense mutations have been identified in key metabolic genes like insra and mc4r that help cavefish to survive in low-nutrient conditions12,13. However, the contribution of regulatory changes in the complex metabolic phenotypes of cavefish has not been investigated. Here we generated a high-resolution, genome-wide map of candidate cis-regulatory elements (CREs) in Astyanax mexicanus. We focused our study on the liver because of its central role in glucose and fat metabolism14. Analysis of the regulatory landscapes of two independent cave populations, Pachón and Tinaja, revealed remarkable similarity, indicating signs of repeated evolution at an epigenetic level. We further show that several CREs display different epigenetic states between surface fish and cavefish, which correlate with their ability to modulate varying levels of reporter gene expression. Analyses of one of these CREs in hpdb, a tyrosine metabolism pathway gene, showed that deletion of a binding site for Irf2 repressor protein in cavefish is sufficient to drive increased gene expression. This suggests a potential adaptive role for the mutation, with a trade-off between the conversion of tyrosine to melanin and TCA cycle intermediates. Our study not only demonstrates the value of using independently evolved populations to identify non-coding genomic loci relevant for cave adaptation, but also provides many candidates for future studies on metabolic adaptation.
Results
Genome-wide annotation of cis-regulatory elements.
We analyzed accessible chromatin, histone modifications, and gene expression to generate a genome-wide epigenetic landscape in the liver tissue of surface fish and two independently derived cave morphotypes—Pachón and Tinaja (Fig. 1a and Supplementary Fi. 1a)9,15–18. Using the surface fish genome as reference19, we identified a total of 94,175 accessible chromatin regions or putative cis-regulatory elements (CREs) across the three populations—68,002 in surface, 69,178 in Pachón and 73,762 in Tinaja (Supplementary Data 1). These CREs were distributed across the genomes, with 44.87% residing within 10 kb of a transcription start site (TSS) (Supplementary Fig. 1b).
Figure 1 |. Analysis of morphotype-biased accessible chromatin regions.
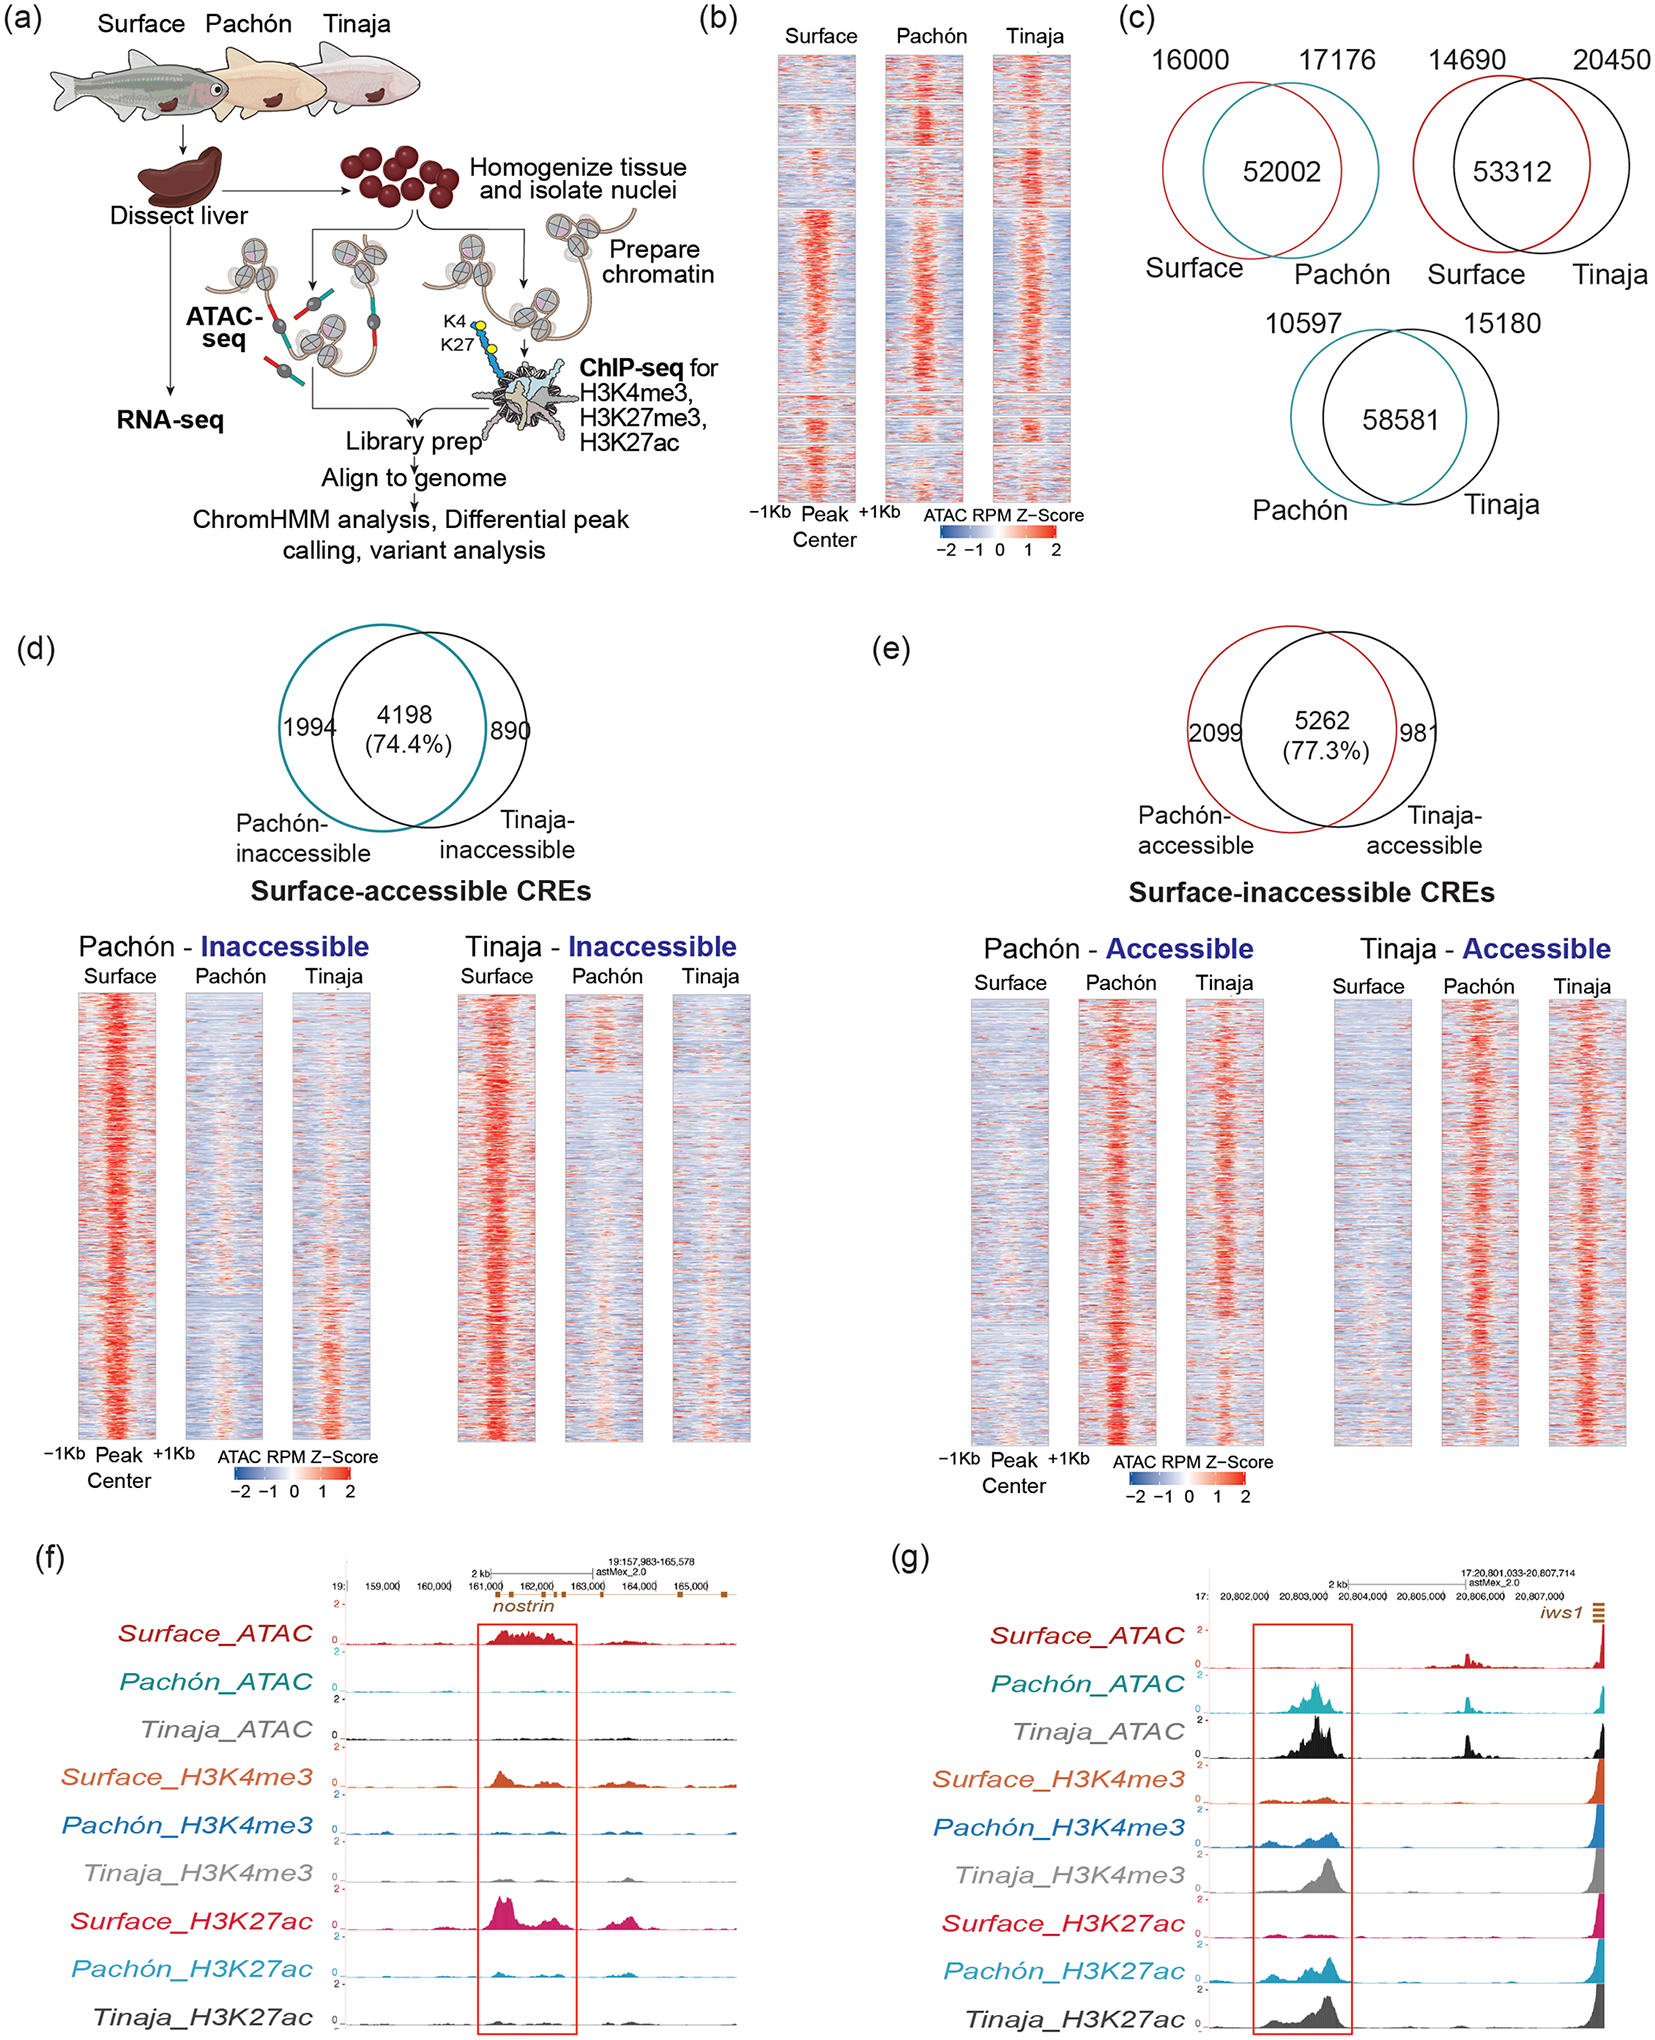
a, Schematic of the experimental design. b, Heatmap comparing ATAC-seq signals between morphotypes. While most loci have similar accessibility, others have varying degrees of accessibility across populations. c, Two-way comparisons of accessible chromatin regions represented as Venn diagrams. d, Venn diagram showing overlap of ATAC peaks between Pachón and Tinaja for surface-accessible CREs. Lower panels are heatmaps showing that most of the regions that are accessible in surface but inaccessible in Pachón are also inaccessible in Tinaja. e, Venn diagram showing overlap of ATAC peaks between Pachón and Tinaja for surface-inaccessible CREs. Lower panels are heatmaps showing that most of the regions that are inaccessible in surface but accessible in Pachón are also accessible in Tinaja. f, Browser shot showing epigenetic landscape for a surface-accessible CRE. y-axis denotes reads per million. g, Browser shot showing epigenetic landscape for a cave-accessible CRE. y-axis denotes reads per million.
We performed ChIP-seq for histone marks and further characterized the candidate CREs using ChromHMM, an automated computational pipeline for learning chromatin states based on a Hidden Markov Model20 (Supplementary Fig. 1c,d). Genomic regions marked with H3K4me3 were classified as active promoters and those with H3K27ac were classified as active enhancers (Supplementary Fig. 1c)21. In addition, regions with H3K27me3 were marked as repressed, while those marked with all three histone marks as poised21. Regions with low intensity of all histone marks were classified into low signal states for further analysis (Supplementary Fig. 1c). We observed that CREs marked as active and poised had accessible chromatin, while those marked as repressive and the low signal states had relatively inaccessible chromatin (Supplementary Fig. 1e). We performed bulk RNA-seq on liver tissues and observed that expression of genes was positively correlated with active and poised marks and inversely correlated with repressive marks (Supplementary Fig. 1e,f and Supplementary Data 2). Together, these analyses highlight that chromatin accessibility can serve as a means of identifying putative CREs that correlate with the expression of the associated genes in this system.
We further analyzed these open chromatin regions for sequence conservation across 11 fish species22. Regions marked by a chromatin feature were roughly 30% more conserved than randomly picked regions in the genome (Supplementary Fig. 2a; see example CRE in Supplementary Fig. 2b). We extended sequence conservation analyses to known regulatory regions in the human liver. We found that 94 out of 441 liver-specific human enhancers had sequence conservation and were marked as open chromatin in our dataset, indicating that some of the putative CREs we identified are conserved in vertebrates and could be involved in gene regulatory networks that control conserved metabolic processes (Supplementary Table 1)23.
Morphotype-biased CREs associate with key metabolic pathways.
To understand how cis-regulatory networks have evolved during cave adaptation, we classified regions into similarly or differentially accessible between the three populations (Fig. 1b). As expected, many loci (47,241) were invariant, while 33,176 were differentially accessible between surface and Pachón and 35,140 between surface and Tinaja (Fig. 1c). Interestingly, we identified only 25,777 differentially accessible regions between the two cave populations, suggesting a greater divergence between the surface and cave populations than between the cave populations (Fig. 1c). The global patterns for the active histone modifications also largely correlated with that of accessible chromatin (Supplementary Fig. 2c). We further analyzed highly differentially accessible regions mapping close (<10 kb) to genes and observed that 74.4% of the regions that were accessible in surface fish (surface-accessible CREs) lost accessibility in both the cave populations (Fig. 1d,f). Similarly, 77.4% of the regions that gained accessibility in Pachón compared to surface also gained accessibility in Tinaja (cave-accessible CREs) (Fig. 1e,g). As reflected in the heatmaps (Fig. 1d,e, lower panels), CREs that were differentially accessible between surface and one of the cave morphs were differentially accessible between surface and the other cave morph as well. These comparisons indicate that both the cave populations have gained or lost accessible chromatin states with regulatory potential in a similar set of genomic regions during evolution. A similar trend was seen in the genome-wide pattern of histone modifications and gene expression between the two cavefish populations compared to surface (Supplementary Fig. 2d,e). This high degree of similarity in the chromatin landscape of the two cave populations points towards modifications of existing regulatory circuitry in the surface fish and suggests that the system is robustly wired to use similar sets of gene regulatory mechanisms in independently derived populations, indicating repeated or parallel evolution on an epigenetic level. To further understand the repeated cave-adaptive cis-regulatory features, we focused on regions that were similarly biased in both cave populations, i.e. cave-accessible CREs (c-CREs), and compared with the surface-accessible CREs (s-CREs) regions.
While changes in cis-regulatory elements do not show a strict correlation with expression changes of nearby genes, there is evidence that CREs tend to control nearby genes24–29. In addition, studies have shown that evolutionarily biased enhancers associated with transcriptional changes are often linked to phenotypic variations3. Therefore, to focus on stronger CRE-gene correlation, we analyzed CREs within 10 kb of the TSS of genes17,27,28 (Fig. 2a). We observed a significant correlation (P < 0.05; see Methods for details) between morphotype-biased CREs and expression of nearby genes (Fig. 2a,b). We observed that s-CRE associated genes were enriched in circadian clock, lipid metabolism, and TGF-β signaling pathways (Fig. 2c), while c-CREs displayed enrichment of pathways involved in lipid metabolism and immune function (Fig. 2d). Notably, lipid metabolism pathway genes enriched near s-CREs comprised catabolic genes (lipases and fatty acid binding proteins) (Fig. 2e) that are upregulated in surface, while lipid metabolism pathway genes near c-CREs highlighted lipid signaling and anabolic genes (fatty acid synthase and acyl CoA synthetases) that are upregulated in cavefish (Fig. 2f). These findings are in line with previous studies showing increased fat accumulation in cavefish12,30. Network analysis of the genes associated with c-CREs showed upregulation of lipid synthesis pathways; specifically, genes such as fasn, which is a fatty acid synthase gene, glucose-6-phosphate dehydrogenase (g6pd), and slc30a8, which is a zinc transporter involved in insulin function, were upregulated in cavefish (Supplementary Fig. 3a)31–33.
Figure 2 |. Morphotype-biased accessible chromatin regions associate with key metabolic pathway genes.
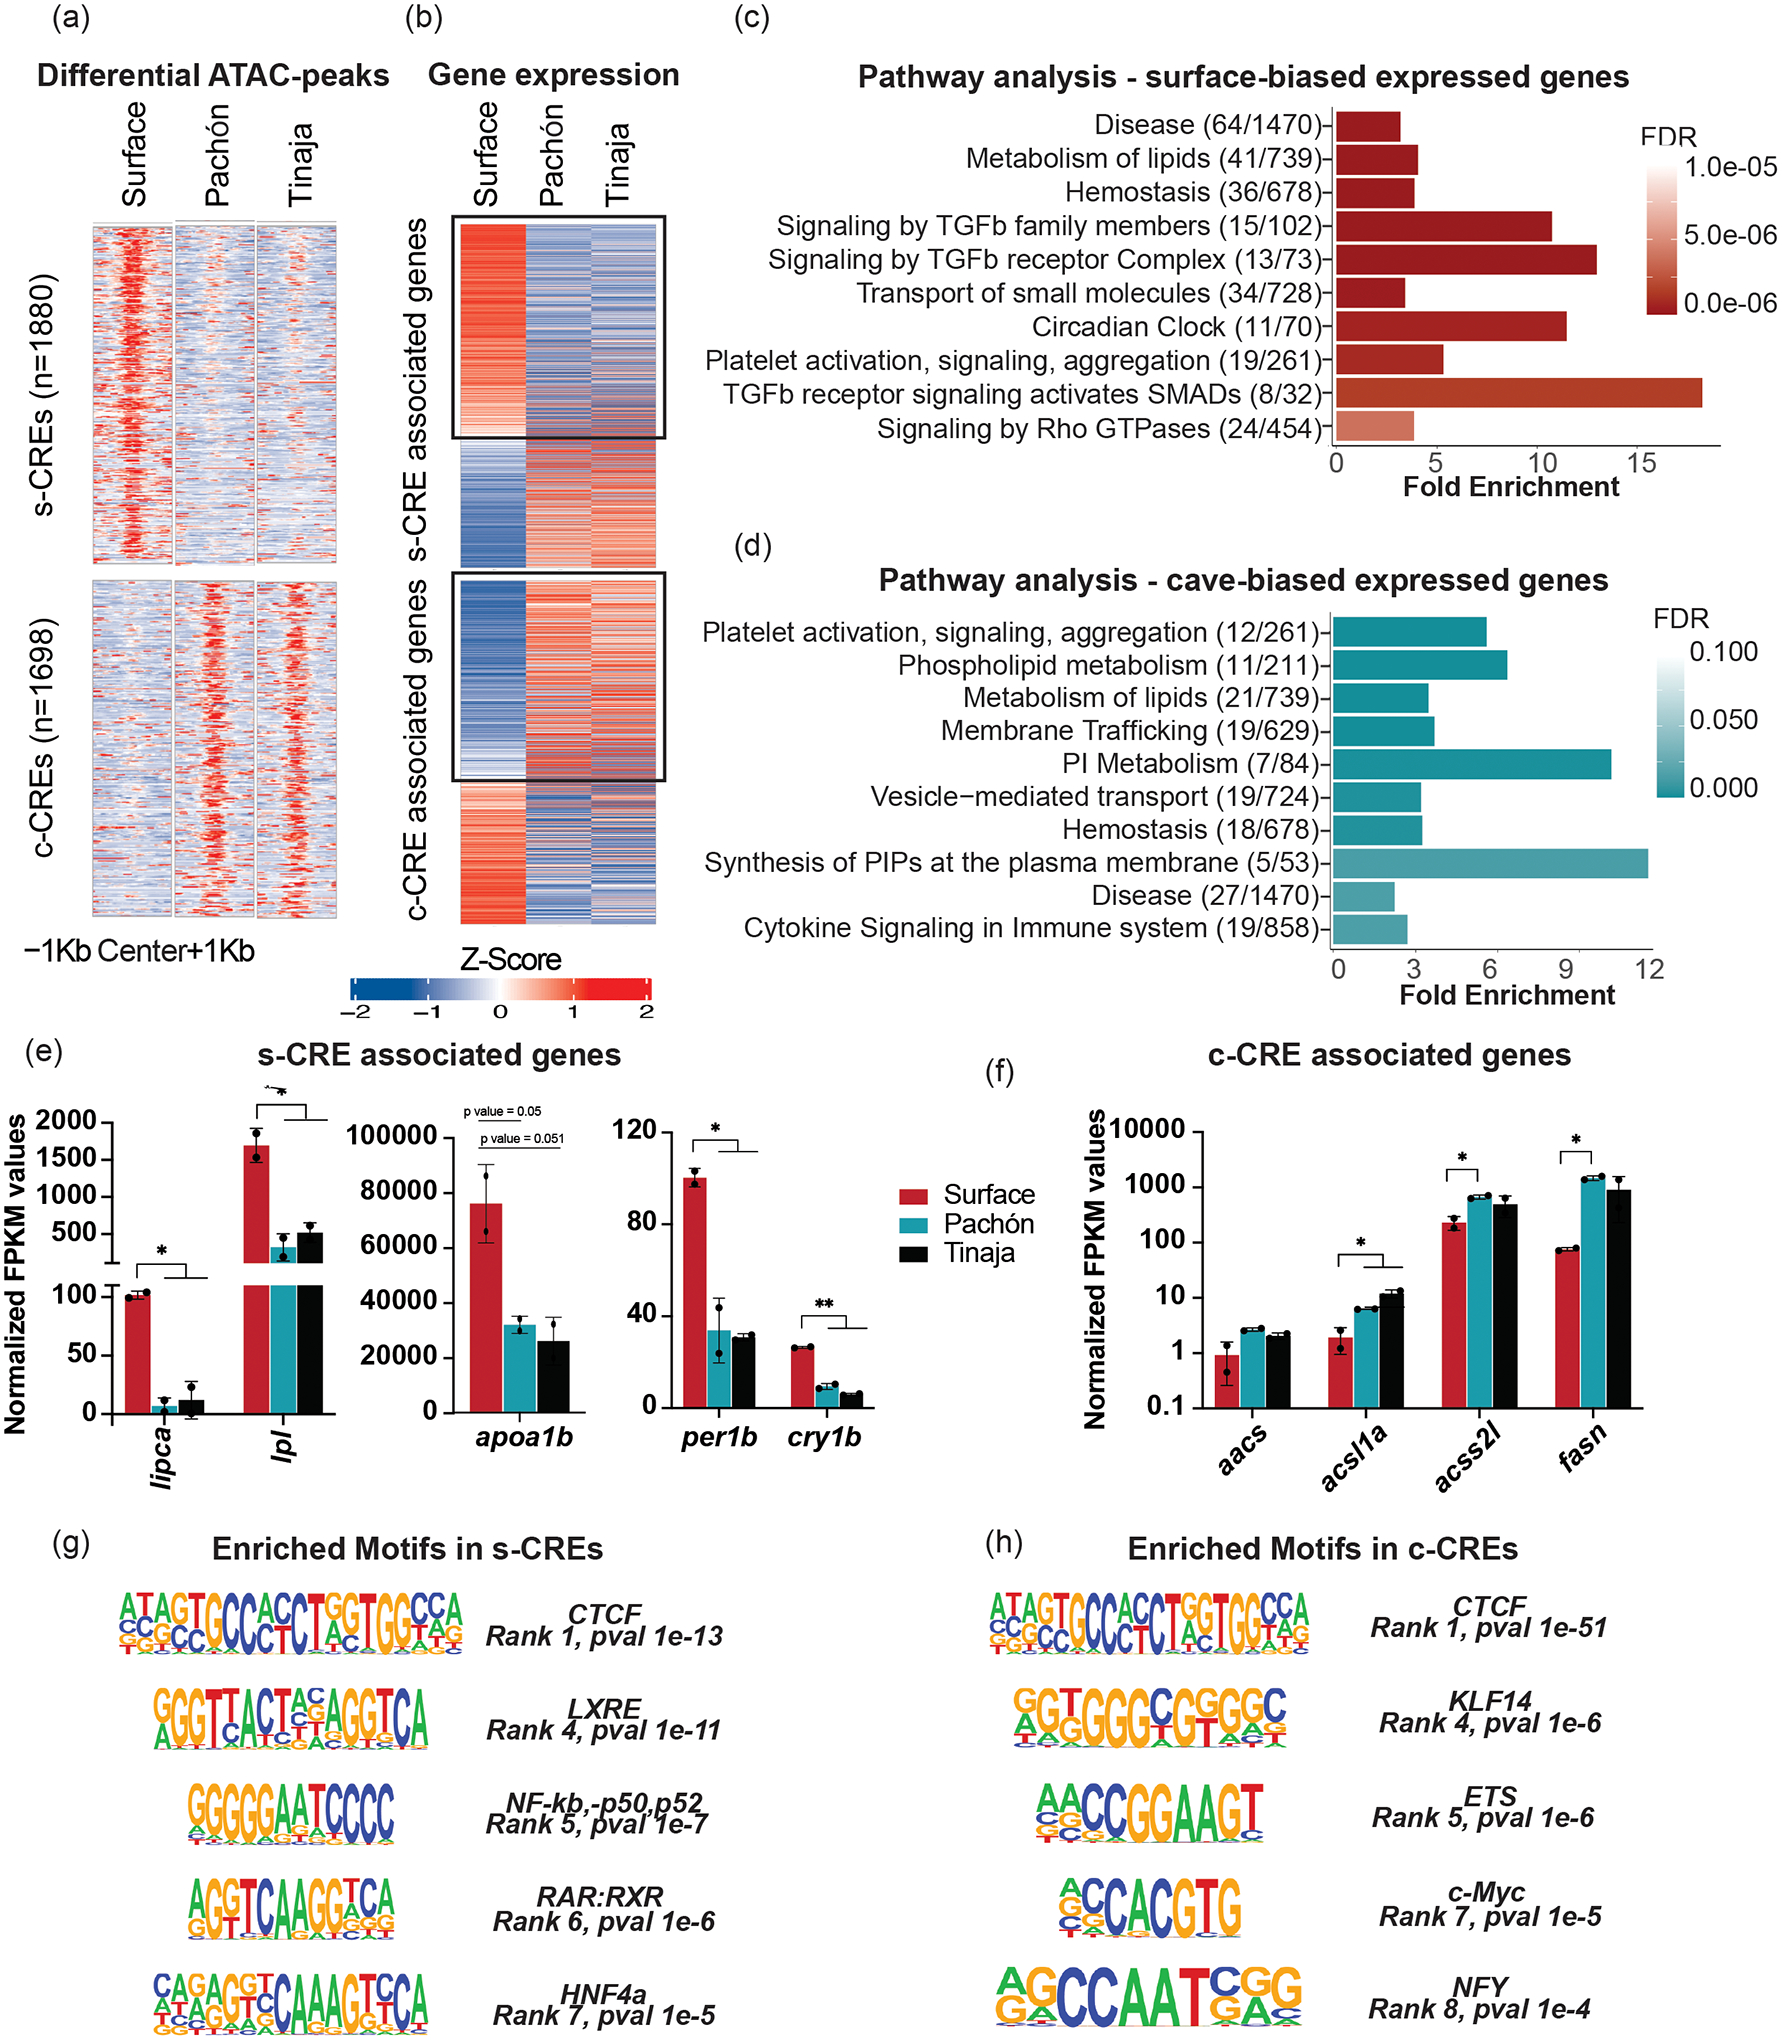
a, Heatmaps depicting z-scores of ATAC signal at the s-CREs (top panel) and c-CREs (bottom panel). The numbers in parentheses indicate the number of peaks in the corresponding panel of the heatmap. b, Heatmaps depicting z-scores for expression of genes associated to s-CREs and c-CREs. c,d, Pathways/reactomes (using GSEA) enriched in genes in proximity (<10 kb of TSS) of s-CREs (c) and c-CREs (d) and showing the same bias in expression. The figures in parentheses represent the number of genes in our list / total number of genes in that reactome. The x-axis represents fold change, and the colors of the bars reflect the FDR value as shown in the color panel on the right side. PI, phosphatidylinositol; PIPs, phosphatidylinositol phosphates. e, Expression levels of genes associated with s-CREs belonging to ‘lipid metabolism (catabolism)’ and ‘circadian rhythm’ reactomes. The graph represents average values +/− s.d. from n = 2 biologically independent RNA-seq experiments. P-values are derived from edgeR and are adjusted for multiple hypothesis testing. lipca, hepatic triacylglycerol lipase a; lpl, lipoprotein lipase; apoa1b, apolipoprotein 1a; per1b, period 1b; cry1b, cryptochrome circadian regulator 1b. f, Expression levels of genes associated with c-CREs belonging to ‘lipid metabolism (anabolism)’. The graph represents average values +/− s.d. from n = 2 biologically independent RNA-seq experiments. P-values are derived from edgeR and are adjusted for multiple hypothesis testing. aacs, acetoacetyl-CoA synthetase; acsl1a, long-chain-fatty-acid-CoA ligase 1; acss2l, acyl-CoA synthetase short chain family member 2; fasn, fatty acid synthase. g, Motifs enriched in s-CREs. CTCF, CCCTC binding factor; LXRE, liver X receptor; NFkb, nuclear factor kappa-light-chain-enhancer of activated B cells p50–52 subunits; RAR:RXR, retinoic acid receptor:retinoic X receptors; HNF4a, hepatocyte nuclear factor 4a. h, Motifs enriched in c-CREs. KLF14, Krüppel-like factor; ETS, E26 transformation-specific; c-Myc, cellular myelocytomatosis oncogene; Nfy, nuclear transcription factor Y. *P < 0.05 and **P < 0.005 using two-tailed Student’s t-test.
Genetic changes in CREs cause differential functional output.
The differential accessibility of the s-CREs and c-CREs could either be due to differences in trans-acting factors or differences in the sequence of the putative CREs itself. To understand the role of specific transcription factors (TFs) in the differential accessibility, we analyzed enriched binding motifs of TFs in s-CREs and c-CREs. In s-CREs, we observed enrichment for motifs of nuclear receptors—Retinoic acid receptor (RXR), Liver X receptor (LXR), and HNF4A—which are known to regulate glucose and lipid metabolism (Fig. 2g)34–36, confirming the results from the pathway analysis (Fig. 2c). Similar analysis for c-CREs revealed enrichment of binding sites for NFY and KLF14 (Fig. 2h). NFY regulates lipid metabolism via the leptin pathway37 and KLF14 represses TGF-β signaling38, a pathway that is enriched in surface fish but not in cavefish (Fig. 2c,d). Notably, we found the consensus motif for CTCF, a regulatory element-binding and genome-organizing factor, to be enriched in both s-CREs and c-CREs, supporting their putative function as regulatory regions of the genome along with the role of CTCF in the 3D organization of the genome during evolution39,40. Together, these analyses point to key liver TFs and pathways that likely influence metabolism via the identified CREs.
Binding of transcription factors can directly impact the epigenetic status and function of CREs18. We reasoned that the differential accessibility of the s-CREs and c-CREs could be due to mutations and/or differential expression of the TFs that recognize the cognate motifs enriched in the analysis. Notably, a recent study identified a mutation in hnf4a19 that may lead to differences in its downstream targets between surface fish and cavefish. Indeed, network analysis showed many direct and indirect targets of Hnf4a to be differentially expressed between surface and Pachón (Supplementary Fig. 3b,c) that could be a consequence of changes to the CREs of these genes. Next, we queried the liver transcriptome data for the TFs whose motifs were enriched (Fig. 2g,h) and found little or no significant expression difference between morphotypes (Supplementary Fig. 4a). Lastly, mutations in CREs themselves could result in downstream gene expression changes41.
To explore the causal role of polymorphisms/mutations in CREs in differential gene regulation, we did a comprehensive analysis of SNPs and indels within all putative CREs. Using GATK variant calling tool, we identified a total of 527,644 SNPs and 183,958 indels between morphotypes using raw reads of the ATAC-seq datasets. We first analyzed our SNP data and found that 27.4% of the peaks had no SNPs, while the rest of the peaks had anywhere between 1 and 169 SNPs per peak (Fig. 3a shows distribution for 1–30 SNPs/peak). Similarly, 27.1% of peaks had no indels, while the rest of the peaks had between 1 and 44 indels (Fig. 3b shows distribution for 1–30 indels/peak). There were 123,611 SNPs between surface and Pachón and 138,278 SNPs between surface and Tinaja. Only 66,056 SNPs were similarly variant between surface and both cave populations (Supplementary Fig. 4b). We observed a similar trend for indels (Supplementary Fig. 4c). The extent of heterozygosity was greater in surface for both SNPs and indels, in line with earlier observations indicating greater genetic diversity in surface fish and higher inbreeding in cave populations42 (Fig. 3c,d). To assess whether genetic changes in CREs underlie differential chromatin accessibility, we compared SNP frequency in surface-accessible peaks to that in Pachón- and Tinaja-accessible peaks (differential peaks with P-value < 0.001). We observed a small but statistically significant increase in the SNP frequency in both Pachón- and Tinaja-accessible peaks compared to surface-accessible peaks (Fig. 3e,f). This result suggests that sequence differences drive the evolution of newly accessible regions in cavefish.
Figure 3 |. Analysis of genetic changes underlying accessible chromatin regions.
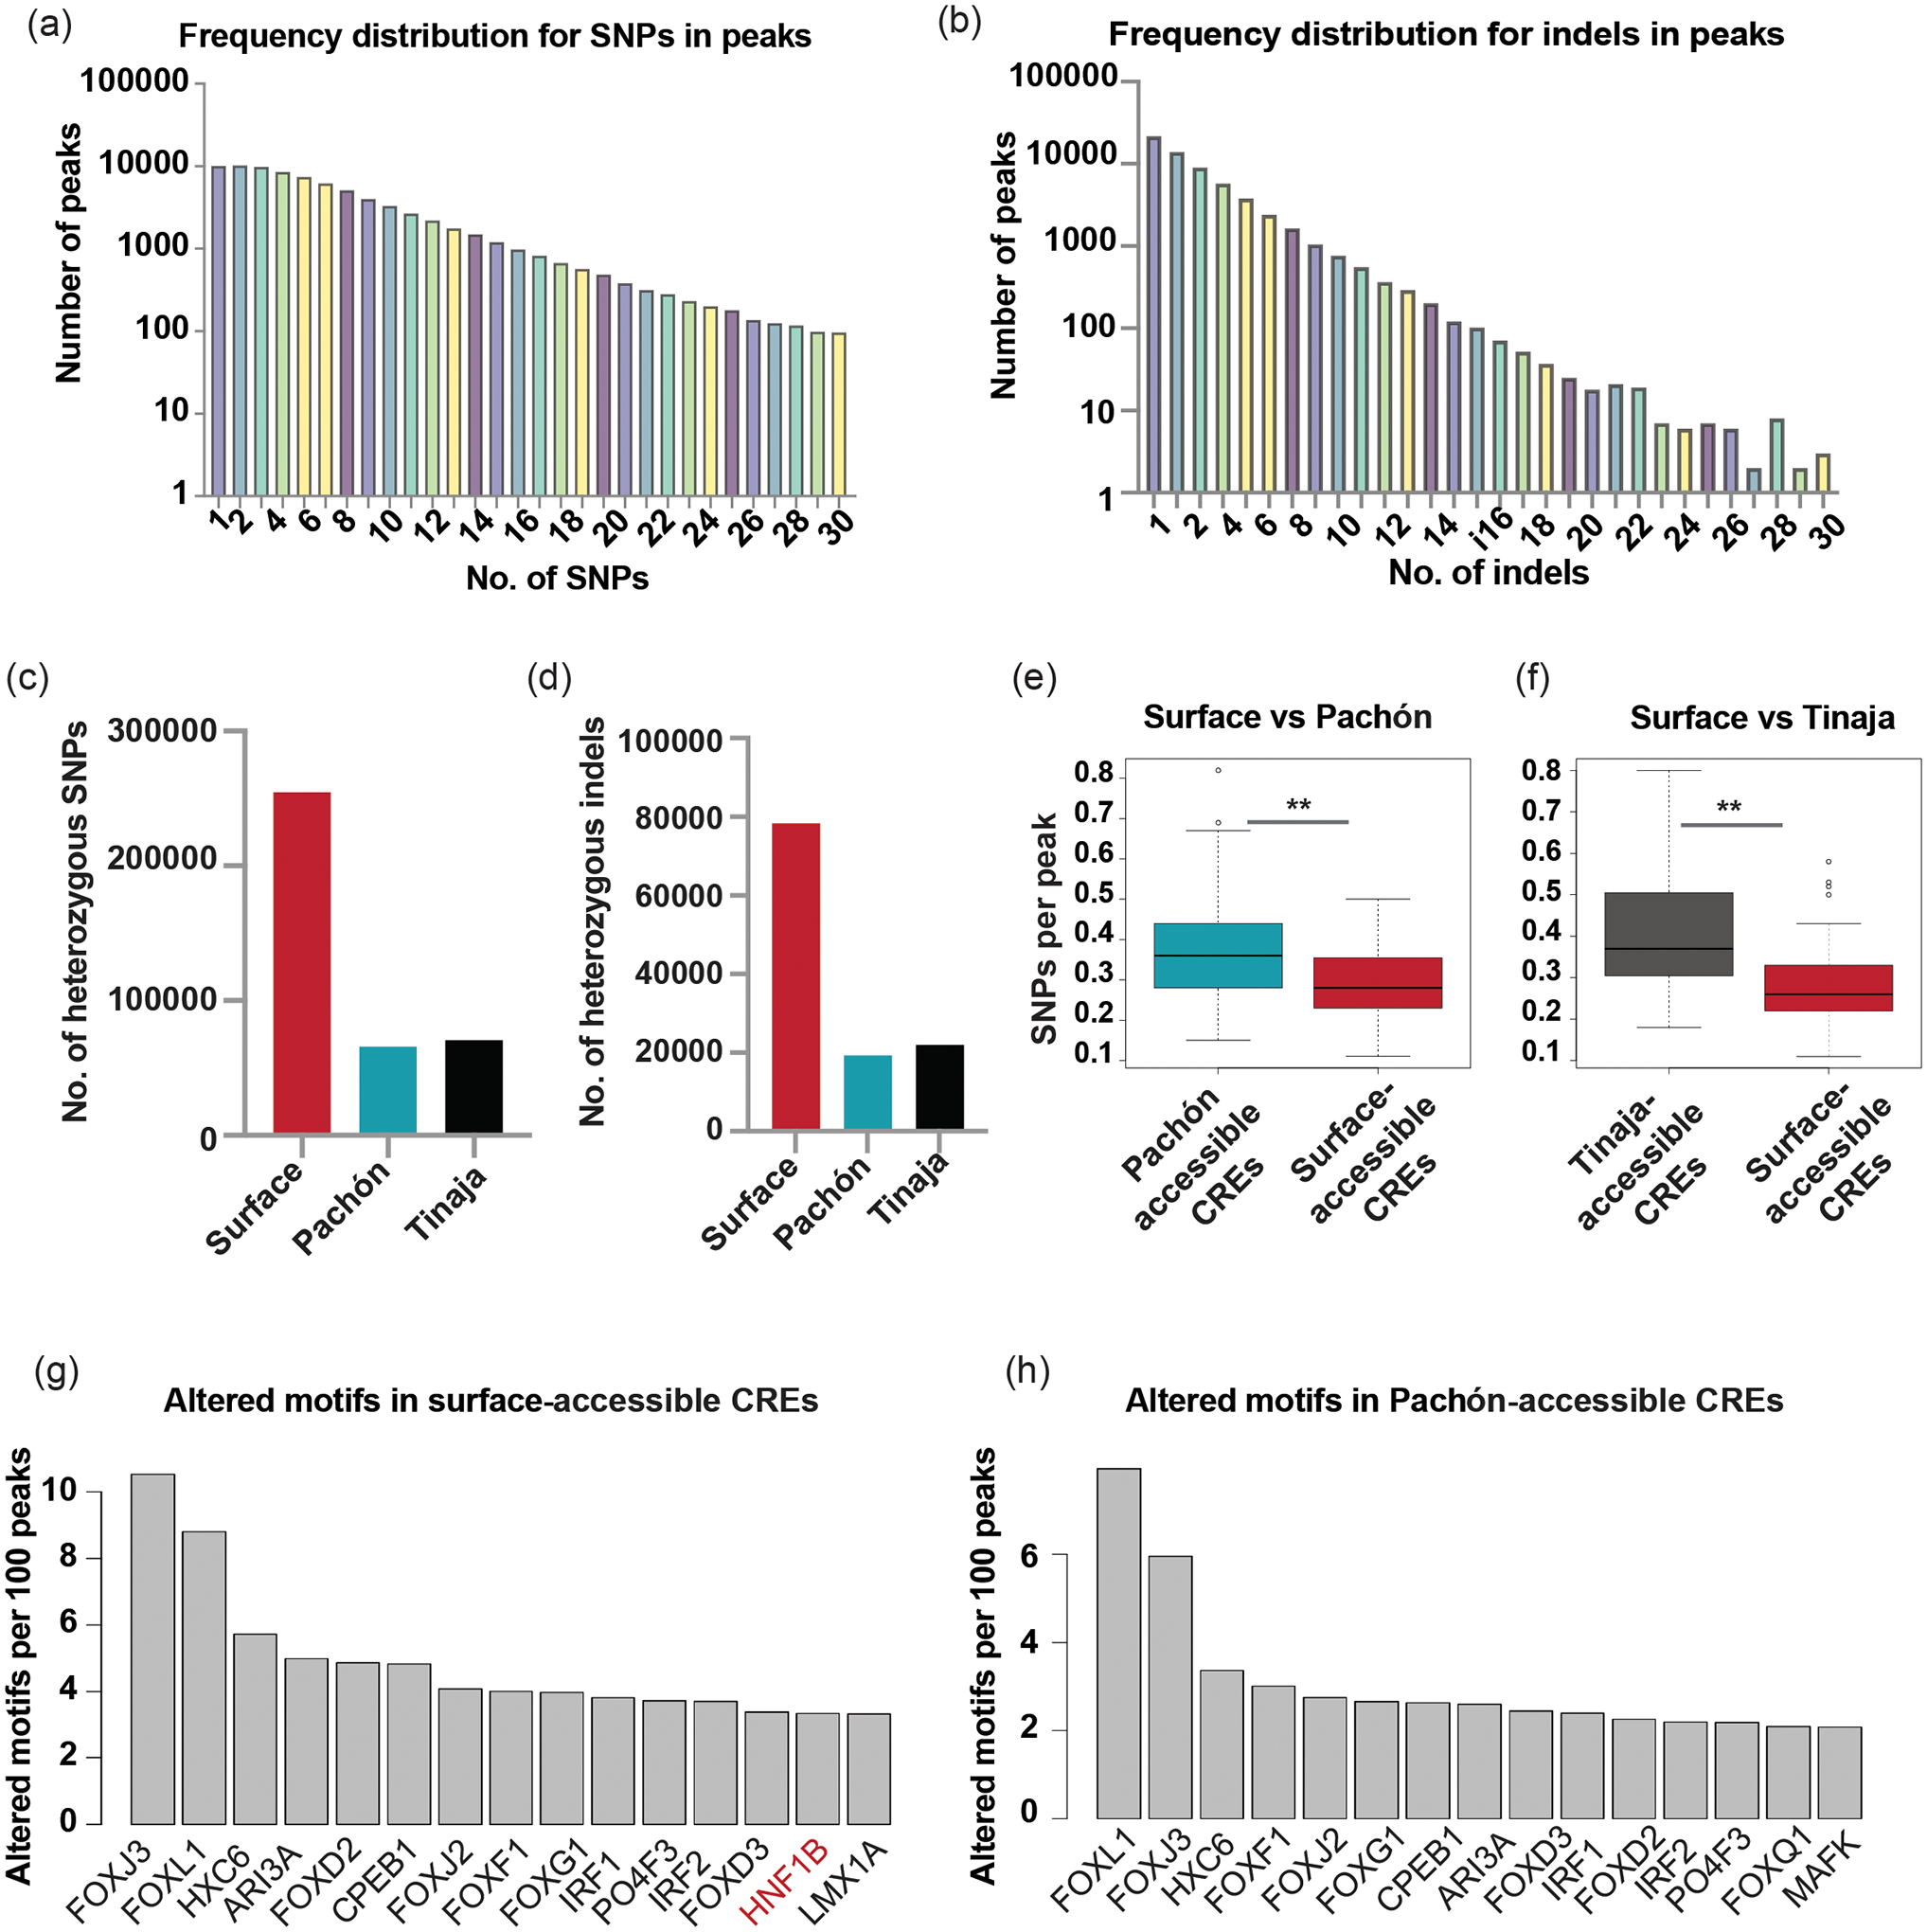
a, Bar plot showing frequency distribution of SNPs under ATAC-seq peaks. b, Bar plot showing frequency distribution of indels under ATAC-seq peaks. c, Bar plot showing number of heterozygous SNPs in the different morphotypes. d, Bar plot showing number of heterozygous indels in the different morphotypes. e, Boxplot comparing SNP density per peak in Pachón-accessible and surface-accessible CREs. **P = 3.52 × 10⁻⁴ using Mann-Whitney U test. f, Boxplot comparing SNP density per peak between Tinaja-accessible and surface-accessible CREs. **P = 4.29 × 10⁻¹⁰ using Mann-Whitney U test. The center line in the boxplots indicates the median with box edges at the 25th and 75th percentiles. The whiskers indicate 1.5 * the interquartile distance, or the minima or maxima, whichever value is closest to the median. g,h, Bar plot showing number of altered TF motifs in surface-accessible CREs (g) and Pachón-accessible CREs (h). There are more altered motifs for HNF1B in surface-accessible CREs than in Pachón-accessible CREs.
To delve deeper into the functional consequence of sequence differences in differential peaks, we investigated whether these SNPs could have effects on transcription factor (TF) binding. We used an R package ‘motifBreakR’ and predicted ‘altered motifs’, which are TF motifs overlapping with SNP(s) that could potentially alter TF binding (Fig. 3g)43. In our entire dataset, we observed that 48.2% (254,554 SNPs) of the identified SNPs had the potential to alter TF motifs, resulting in a total of 1,497,297 altered TF binding motifs. Among the differentially accessible CREs, 33% of Pachón-accessible CREs consisted of at least one altered motif, while 41% of the surface-accessible CREs contained at least one altered motif. Interestingly, HNF1B (hepatocyte nuclear factor 1b) that regulates glucose metabolism and is implicated in diabetes44 was one of the top 15 TFs with altered motifs in surface-accessible CREs (Fig. 3g) but not in Pachón-accessible CREs (Fig. 3h). This analysis highlights the abundance of altered TF motifs occurring within CREs that could potentially alter CRE activity and thereby could have significant effects on downstream gene expression patterns between surface and Pachón.
To functionally validate our prediction on mutated CREs affecting gene expression, we used a luciferase reporter assay and examined activity of a selected set of surface-biased and cave-biased CREs. To narrow down CREs to test in reporter assays, we considered only differentially accessible CREs that carried at least one polymorphism (SNP or indel) between surface and either of the cave populations and were within 10 kb of a TSS. Next, to enable downstream characterization of the CRE and its associated gene, we selected those CREs whose associated genes were annotated with gene names on Ensembl (Biomart)45. Lastly, to ensure better CRE-to-gene association, we selected those CREs whose associated gene expression was biased in the same direction as the chromatin accessibility between morphotypes (Fig. 4a). For these 466 candidate CREs, we manually evaluated additional parameters such as the degree of difference in the expression of associated gene, maintenance of differential chromatin features in the flanking genomic regions, and relevance of the associated gene in metabolism (see Methods for details). This resulted in a total of 25 differentially accessible CREs for functional validation (Fig. 4a and Supplementary Table 2).
Figure 4 |. Functional validation of differentially accessible CREs.
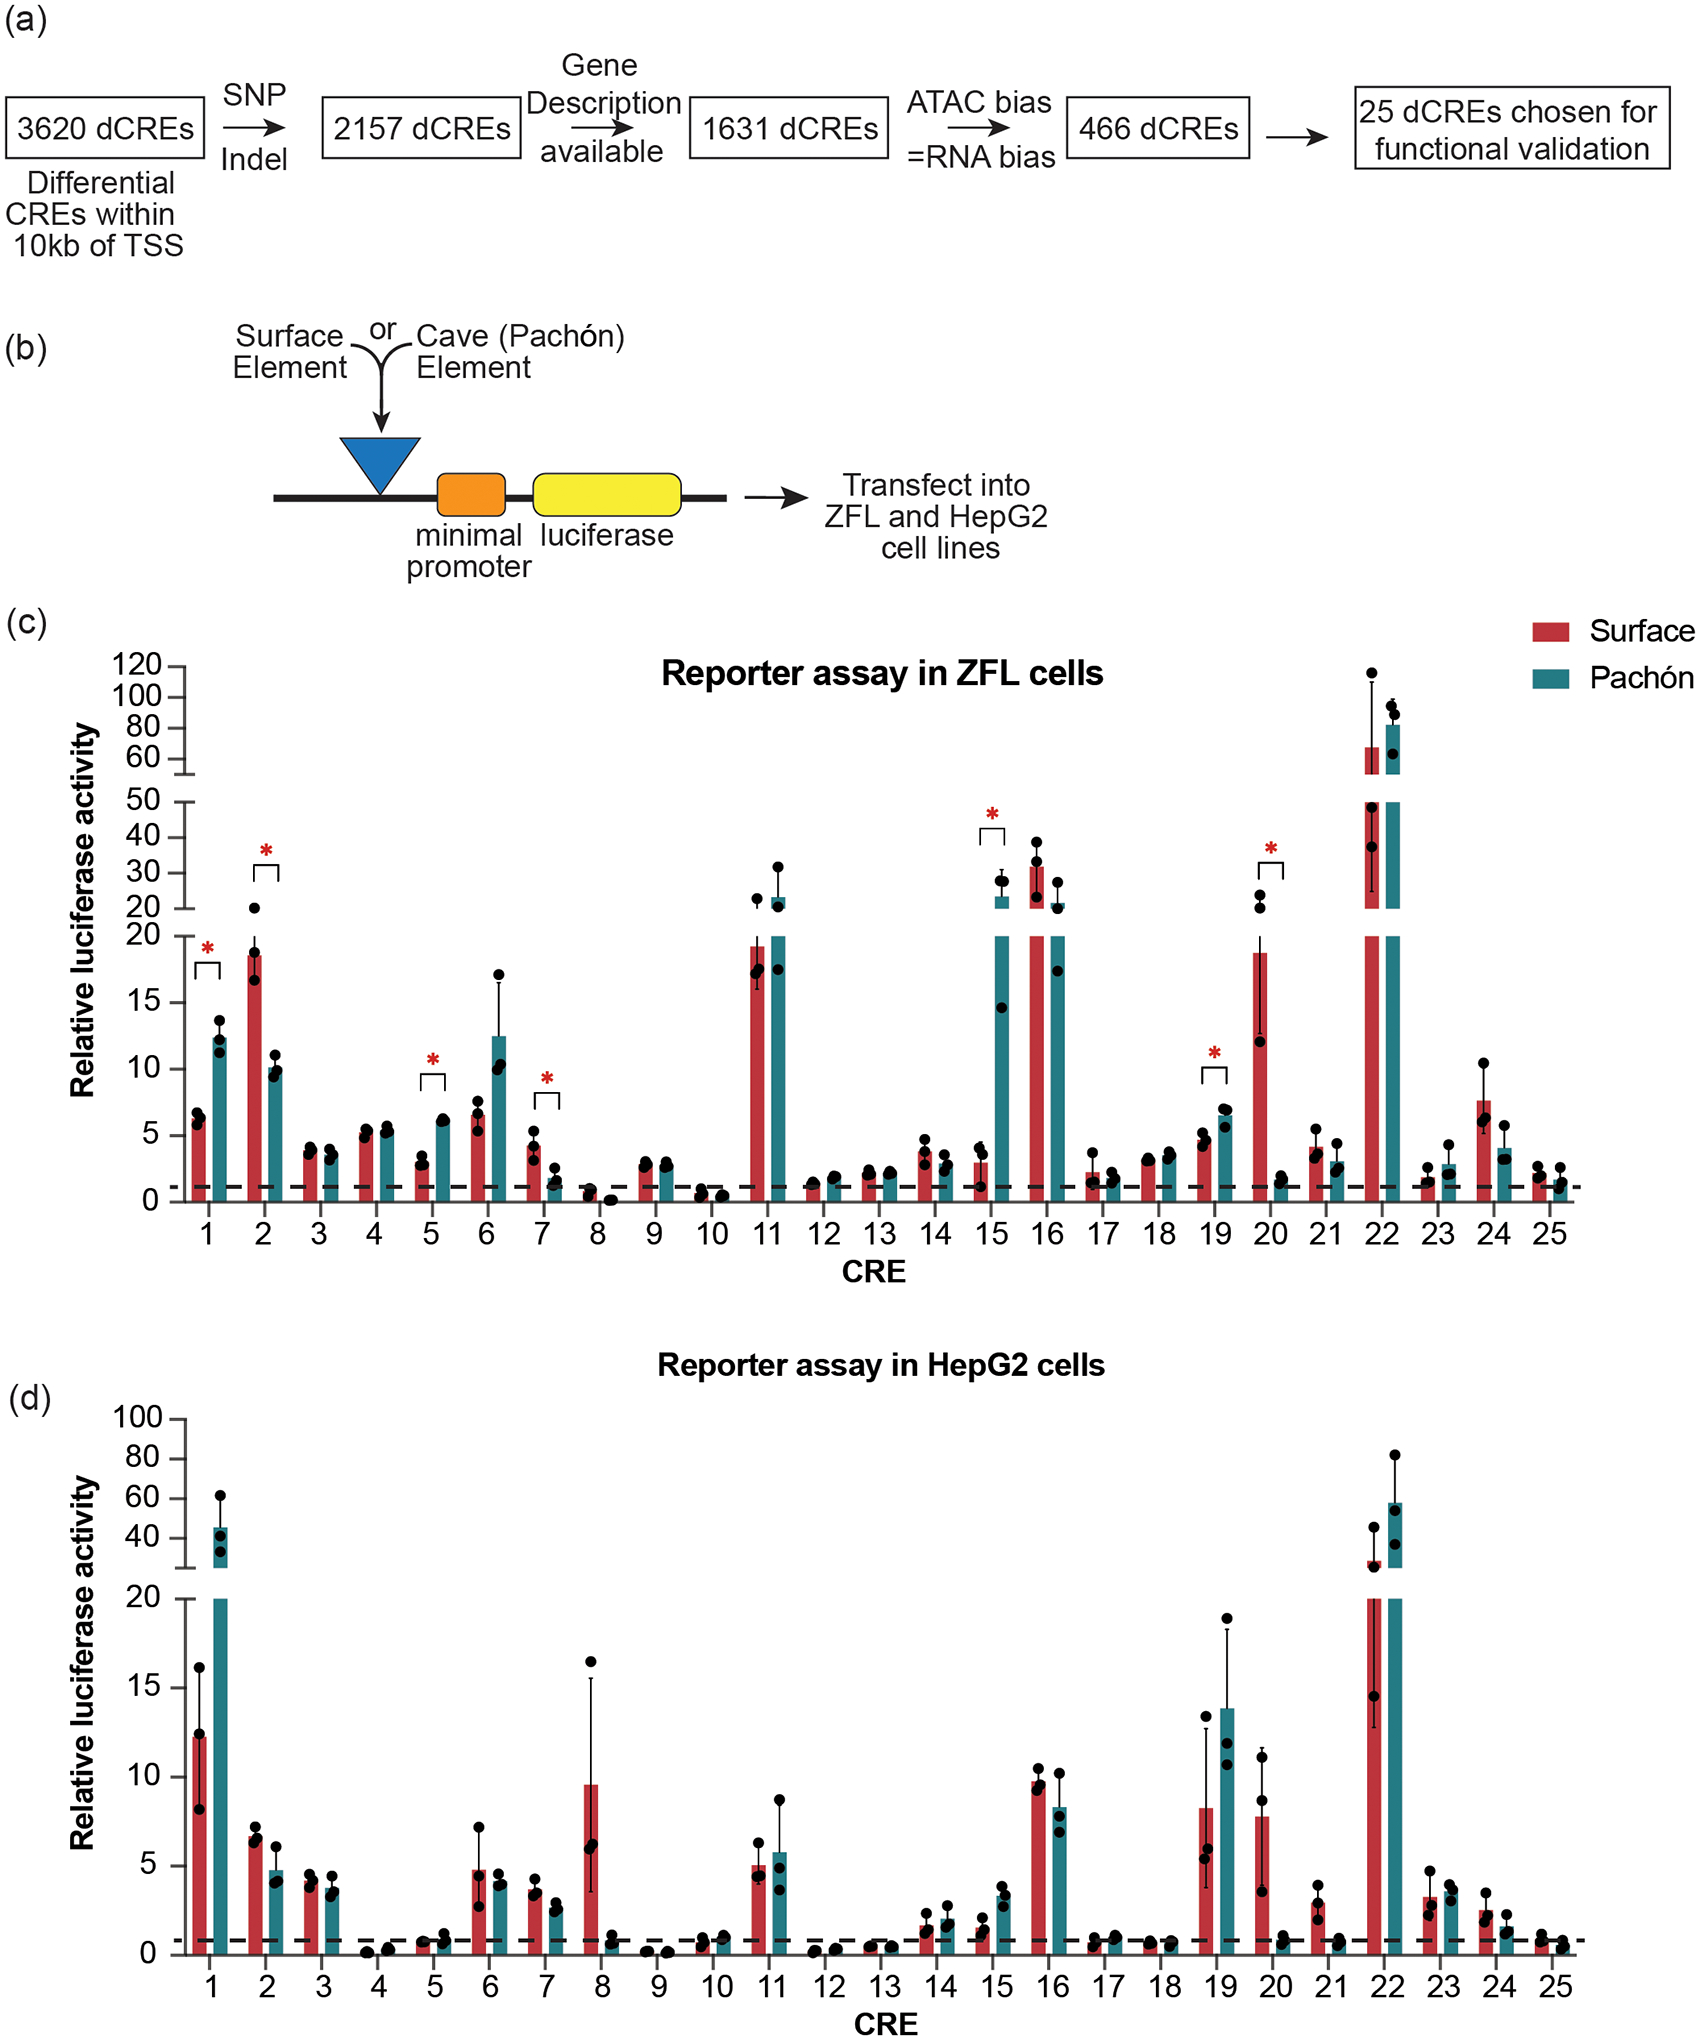
a, Flowchart showing the process of selection of candidate differential CREs for functional testing. b, Schematic of the reporter construct used for assaying enhancer activity in cell lines. c,d, Enhancer activity for the 25 enhancer candidates each from surface and Pachón tested using luciferase assay in ZFL cells (c) and HepG2 cells (d). The * indicates candidates whose enhancer activity is significantly different between surface and Pachón CRE constructs (*P < 0.05 using two-tailed Student’s t-test). The graph represents mean values and error bars represent standard deviation between 3 biological replicates. The horizontal dashed line marks activity of vector alone (normalized to 1).
To functionally test the CREs in vivo, we generated transient transgenic Astyanax (Supplementary Fig. 5a,b) and zebrafish (Supplementary Fig. 5a,c) embryos for several CREs by Tol2-mediated transgenesis in fertilized eggs as described previously46,47. The embryos were injected with the surface or cave constructs of CREs and GFP expression was examined after 3–5 dpf (Supplementary Fig. 5). We observed enhanced GFP expression compared to vector control, suggesting robust enhancer activity for several of these CREs. To take a more quantitative approach for comparing activities of surface and cave elements, we switched to reporter assays in cell lines. In the absence of available Astyanax liver cell lines, we performed luciferase reporter assays in the zebrafish liver cell line (ZFL) and the human liver cell line (HepG2) (Fig. 4b–d). We tested surface and Pachón alleles for each of the 25 CREs in replicates. We found that 80% of the tested CREs (20 out of 25) (Fig. 4c) mediated expression 2-fold or higher than the empty vector control, indicating their ability to function as enhancers in ZFL cell lines. We observed 32% of these CREs were also functional in human cells (Fig. 4d), suggesting conservation of regulatory function across large evolutionary distances. For 7 out of the 20 functional CREs, the surface and cave alleles displayed differential enhancer capabilities when tested in ZFL cells, while 5 out of 8 CRE enhancers were differential in HepG2 (Fig. 4c,d). These results show that our selection criteria are not sufficient to predict the outcome in the reporter assay in vitro. This can be due to several reasons. First, the reporter assays have been performed in cell lines from different species, and the cellular environment in cell lines could be different from that of adult Astyanax liver. Second, the CREs are being tested out of their genomic context. Third, not all SNPs/indels will necessarily result in a functional consequence. Nonetheless, these reporter assays give us a strong and robust tool to functionally annotate as well as identify CREs that differ in their activity solely due to underlying sequence differences. Combining the results from ZFL and HepG2, we identified CRE_1, CRE_7, CRE_15 and CRE_20 to maintain their differential reporter output in both cell lines tested, confirming that polymorphisms in the underlying DNA sequences of these CREs are causal for differences in their ability to drive reporter expression.
Deletion of repressor binding site increases CRE_15 activity.
We further characterized the cave-biased CRE_15 and generated stable transgenic lines for both S-CRE-15 and P-CRE-15 in zebrafish (Supplementary Fig. 5d). We observed reporter expression in the anterior gut and liver region, suggesting a tissue-specific expression pattern for this CRE (hereafter CRE-hpdb) similar to its nearby gene (744 bp away) hpdb (4-hydroxyphenylpyruvate dioxygenase b, ENSAMXG00000015502) (Fig. 5a). Hpdb catalyzes the first unidirectional step in tyrosine catabolism and is upregulated in Tinaja and the most upregulated gene in the transcriptome of Pachón (Supplementary Fig. 6a and Supplementary Data 2), which we also validated using qPCR (Fig. 5b).
Figure 5 |. Detailed characterization of CRE_15.
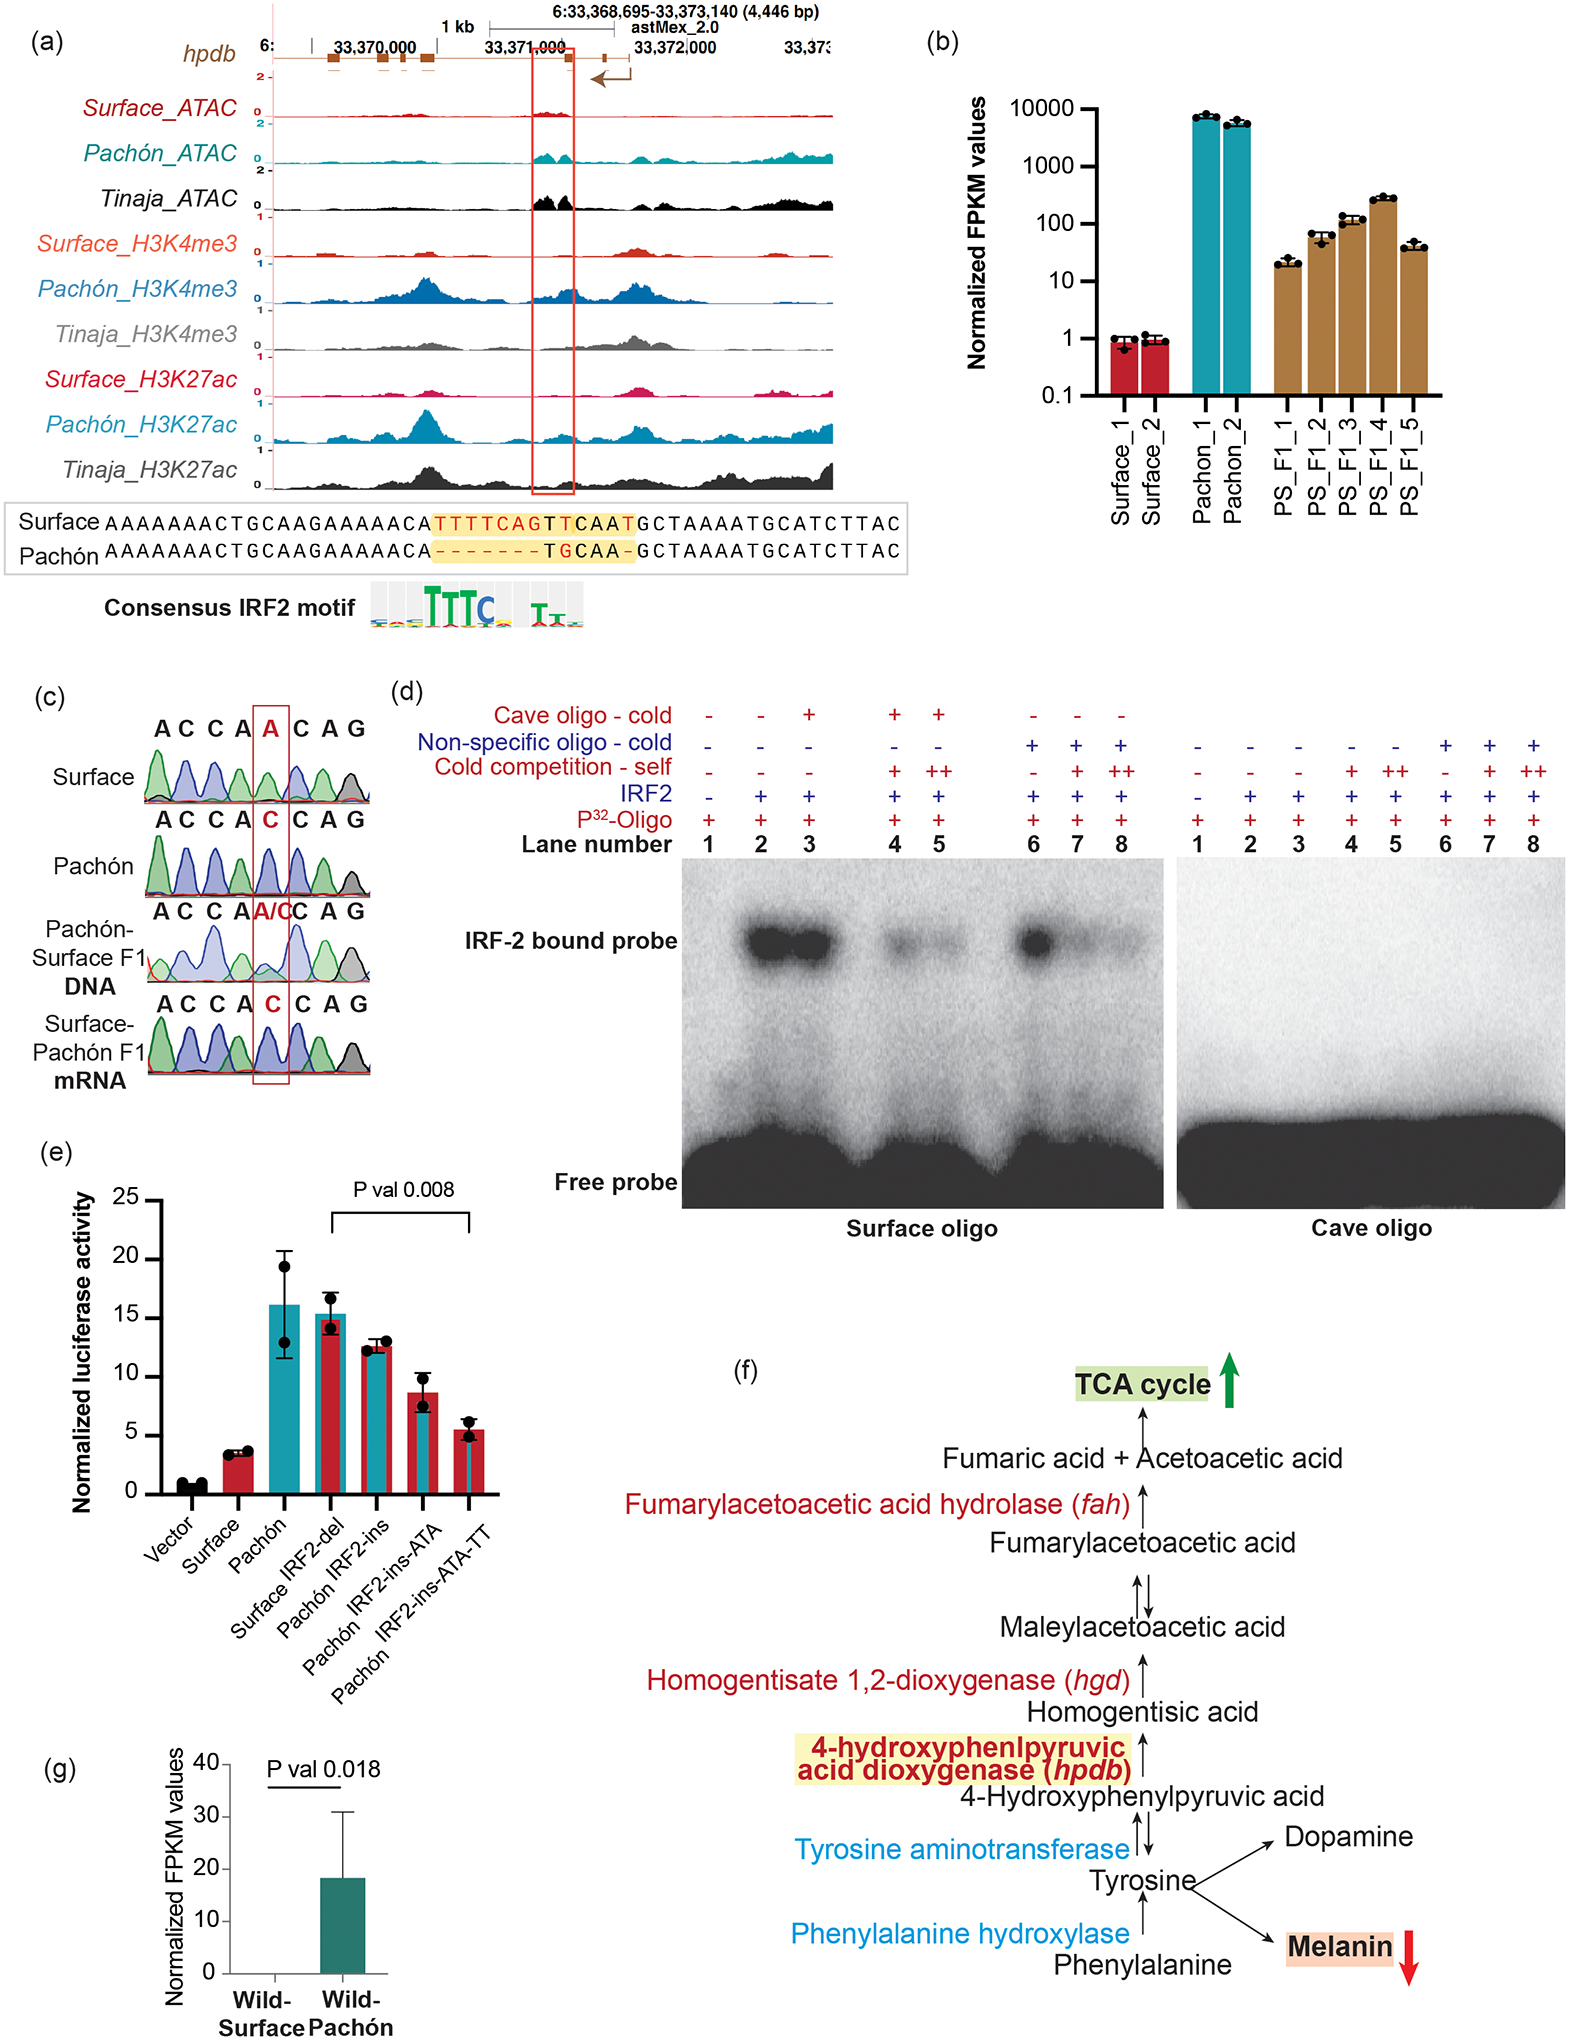
a, UCSC genome browser shot showing various chromatin features at the genomic region around CRE_Hpdb. y-axis denotes reads per million. The red box indicates the location of the CRE_15 (744 bp from the TSS). The lower panel shows the sequence of the region of CRE_Hpdb that contains the deletion of the predicted IRF2 binding site. The cognate IRF2 motif is also shown. b, hpdb RNA levels using qPCR in livers of adult surface fish, Pachón cavefish and Pachón-surface F1 hybrids. Each bar represents data from one individual fish. Error bars represent standard deviation between 3 technical replicates of qPCR. All values are relative to Surface_1 fish normalized to 1. c, Chromatograms from the sequencing of the SNP within exon 12 of the hpdb gene used to distinguish surface and Pachón alleles. d, Representative gel (for 3 independent experiments) showing gel-shift assay for recombinant IRF2 binding on surface fish and cavefish oligo spanning the IRF2 binding site. Excess 32P-labeled oligo runs at the bottom while IRF2-bound surface oligo runs slower. Self-competition was done using 200× (+) and 400× (++) unlabeled oligos. Cavefish oligomer and a random oligomer were used as non-specific competitors. Radiolabeled surface oligo binds the protein and does not get competed out by excess unlabeled cave or non-specific oligo. Cavefish oligo fails to bind any IRF2. e, Relative luciferase activities for vector alone and various alleles of CRE_Hpdb – surface, Pachón, S-CRE_Hpdb without IRF2 binding site (surfaceIRF2-del) and P-CRE_Hpdb with the IRF2 binding site restored (PachónIRF2-ins), PachónIRF2-ins with additional mutations converting Pachón allele to Surface allele (PachónIRF2-ins-ATA and PachónIRF2-ins-ATA-TT). P-value was calculated using two-tailed Student’s t-test. The graph represents average values +/− s.d. from n = 3 biological replicates. f, Schematic of pathways that use tyrosine in the cell. A decreased demand for melanin in cavefish could in principle lead to increased availability of tyrosine for other pathways. g, hpdb RNA levels in wild-caught surface fish and Pachón cavefish livers RNA-seq data50. The graph represents average values +/− s.d. from n = 3 biologically independent RNA-seq experiments. P-value was calculated using two-tailed Student’s t-test.
We next assessed whether the decreased expression of hpdb in surface fish is due to cis-mediated repression or due to the presence of some trans-acting factor(s) using Pachón-surface F1 hybrids48. The qPCR quantification of hpdb expression in surface and Pachón matched the RNA-seq data, and the livers of the F1 hybrid fish expressed intermediate levels of the RNA, indicating that the Pachón allele is incompletely dominant (Fig. 5b). We monitored allele-specific expression levels by taking advantage of the presence of a synonymous SNP in exon 12 of the hpdb coding region to distinguish the parental alleles (Fig. 5c). While we detected both alleles in the DNA samples, we detected expression only from the Pachón allele in the mRNA samples. This suggests that the increased expression of hpdb in Pachón is mediated by changes in cis.
We identified several small deletions in the CRE-hpdb sequence in Pachón that are predicted to abolish a binding motif for the repressor protein Irf2 (Fig. 5a, lower panel). As there was no significant difference between irf2 expression between surface and Pachón (Supplementary Fig. 6b), we explored the possibility that differential binding of Irf2 protein could be linked to the regulatory difference in CRE-hpdb by using an in vitro electromobility shift assay (EMSA) (Fig. 5d). We carried out EMSA using γ-32P labeled 20-bp oligonucleotides from the surface fish enhancer containing the Irf2 binding site and the corresponding 20-bp region from the Pachón enhancer lacking that site. We used recombinant human IRF2 protein as the DNA-binding domain between Astyanax and human is highly conserved (Supplementary Fig. 6c). IRF2 binds to the oligo based on the surface fish sequence, while very weak or no binding was observed with the Pachón probe, showing altered affinity of this region for the IRF2 protein (Fig. 5d). Non-specific competition with an unrelated oligo did not hamper the robust DNA-protein interaction (Fig. 5d), while addition of 200× (20 pmol) (lanes 4 and 7) and 400× (40 pmol) (lanes 5 and 8) unlabeled self-competitor weakened the interaction, confirming the specificity of the binding. These results suggest that the deletion in P-CRE-hpdb prevents the IRF2 repressor from binding, which in turn could affect the activity of this regulatory region.
We next tested whether the lack of an IRF2 site is sufficient to abolish repression in vitro. Using the cell-based luciferase assay, we found that specifically deleting the IRF2 motif in the surface allele of CRE-hpdb (SurfaceIRF2-del, now similar to the Pachón allele) restored expression (Fig. 5e). This suggests that IRF2 is indeed a repressor of CRE-hpdb. Next, we asked whether repression could be rescued by adding back the IRF2 binding site to the Pachón sequence. Surprisingly, we noted that the addition of the IRF2 site was not sufficient to cause significant repression (PachónIRF2-ins) (Fig. 5e), suggesting that other sequence changes have occurred in Pachón that prevent repression by IRF2. We sequentially converted two more sites to the Pachón alleles (Supplementary Data 3) (PachónIRF2-ins-ATA and PachónIRF2-ins-ATA-TT), causing restoration of the repressive activity of the IRF2 site insertion in P-CRE-hpdb (Fig. 5e). This suggests that, while deleting the IRF2 binding site is sufficient to release repression, other mutations have contributed to the differential activity of the CRE.
Deletion of IRF2 binding site as an adaptive trait.
Tyrosine serves as a substrate for several important compounds in the cell, including melanin, dopamine and certain intermediates for ketone body formation and the TCA cycle (Fig. 5f). An accumulation of excess tyrosine in cells has been reported in cave populations that are mutant for melanin formation and in surface fish upon abrogation of melanin formation by knocking down oca249. We also noticed in our liver transcriptome data that the expression of genes encoding enzymes that convert tyrosine to L-Dopa (tyrosinase and tyrosine hydroxylase) is very low (Supplementary Fig. 6d). In a nutrient-deprived condition, it could be a thrifty strategy to divert the excess tyrosine to produce TCA intermediates and ketone bodies for energy storage and production.
To investigate this possibility, we genotyped 23 wild-caught surface fish, 23 wild Pachón fish, and one each of Tinaja, Yerbaniz, Piedras, and Japonés cavefishes. We found that the IRF2 site deletion is fixed in all cavefish samples, except for the Japonés individual, which was heterozygous (Supplementary Fig. 6e), while all surface fishes had the wild-type sequence. This supports previously published data, where we found the expression of hpdb from wild Pachón to be higher than wild surface fish (Fig. 5g)50. These observations suggest that the mutation is under positive selection41,49. We further analyzed the expression of other relevant enzymes in the tyrosine catabolism pathway and found that genes encoding enzymes hpdb, hgd and fah, which catalyze unidirectional steps in the tyrosine catabolism pathway, are also expressed higher in Pachón than in surface livers (Fig. 5b and Supplementary Fig. 6f). This supports our hypothesis that excess tyrosine in the cells is being repurposed via the TCA cycle.
Discussion
In this study, we utilized Astyanax mexicanus, an evolutionary genetic model system, to address the question of how changes in the cis-regulatory elements of the genome can help cavefish adapt to the extreme cave environment characterized by absence of light and nutrient deprivation. Our analysis uncovered many putative cis-regulatory elements that are differentially regulated between surface and cave morphotypes. We found surface-biased CREs to be associated with key genes related to lipid catabolism, circadian rhythm and TGF-β signaling, while cave-biased CREs were associated with lipid anabolism genes and immune system. The biased enrichment of motifs for key transcription factors like LXR and HNF4A in s-CREs, and NFY and KLF14 in c-CREs, points to key transcription factor networks that could be linked to changes in the above metabolic pathways. These global regulatory changes reveal how adaptation to the cave environment has modified the regulatory architecture of the genome to support physiological traits and metabolic processes in cavefish compared to surface fish.
Our study also highlights that the genome-wide chromatin architecture of the two cavefish morphotypes, Pachón and Tinaja, were more similar to each other than to the surface fish. This is in line with the previously observed phenotypic convergence in these independently derived cavefish populations like loss of visible eyes and pigment, accumulation of excess fat, insulin resistance, etc.12,30,51. One interesting hypothesis supporting this observation is that selection has repeatedly acted on existing transcriptional gene regulatory networks in the animals upon exposure to new environments.
Functional validation of our genome-wide analyses in cell culture assays revealed that a large proportion of CREs have altered activities, potentially due to trans-acting effects, while some arise due to underlying genetic changes. Our analyses of genetic variation underlying differentially accessible CREs suggest its contribution to the gain of accessible chromatin regions in cavefish. Detailed genetic and functional characterization of an enhancer of the hpdb gene affirmed the role of cis-regulatory changes in controlling the cave-biased expression of hpdb in the liver. The hpdb gene is part of the tyrosine metabolism pathway and converts tyrosine to TCA cycle intermediate fumarate and ketone body acetoacetate. It has been shown that the absence of melanin, as seen in cavefish, results in more tyrosine and dopamine in the body49. An intriguing possibility supported by the presence of this mutated CRE in multiple cave populations is that, in the liver, excess tyrosine can be converted to fumarate and acetoacetate as a measure to use any available nutrient for energy production by cavefish.
We expect many other differentially accessible regions identified in our study to be involved in the metabolic adaptation of cavefish to their low-nutrient environment. We propose that Astyanax mexicanus, with its contrasting morphotypes and independently derived cave populations, presents an effective system to unravel global gene regulatory pathways and networks important in physiological adaptation of species to new and changing environments that could give insights towards a better understanding of conserved metabolic processes in vertebrate physiology.
Methods
Astyanax husbandry.
Astyanax are housed in polycarbonate or glass fish tanks on racks (Pentair, Apopka, FL). Both the surface fish and the cavefish are maintained under the exact same lab conditions. They are provided with the same food, and both kept under the same 14:10 light:dark cycle. As we are mainly interested in understanding the genetic changes between the morphotypes, maintaining them under the same conditions helps negate out potential environmental effects. Each rack uses an independent recirculating aquaculture system with mechanical, chemical, and biologic filtration, and UV disinfection. Water quality parameters are maintained within safe limits (upper limit of total ammonia nitrogen range 1 mg/L; upper limit of nitrite range 0.5 mg/L; upper limit of nitrate range 60 mg/L; temperature set-point of 22 °C; pH 7.65, specific conductance 800 μS/cm; dissolved oxygen >90%. Water changes range from 20–30% daily (supplemented with Instant Ocean Sea Salt (Blacksburg, VA)). Adult fish are fed three times a day during breeding weeks and once per day during non-breeding weeks on a diet of Mysis shrimp (Hikari Sales USA, Inc., Hayward, CA) and Gemma 800 (Skretting USA, Tooele, UT). Animal husbandry was according to IACUC approved protocol 2019–084 approved for Stowers Institute for Medical Research.
Zebrafish husbandry.
Zebrafish are housed in polycarbonate fish tanks on racks (Pentair Aquatic Eco-Systems, Inc., Apopka, FL) with a 14:10 h light:dark photoperiod. Racks are supplied by two recirculating aquaculture systems with mechanical, chemical, biological filtration, and UV disinfection. Water quality parameters are maintained within safe limits (upper limit of total ammonia nitrogen range 0.5 mg/L; upper limit of nitrite range 0.5 mg/L; upper limit of nitrate range 40 mg/L; temperature set-point 28.5 °C; pH 7.60, specific conductance 500 μS/cm; dissolved oxygen >85%. Water changes range from 20–30% daily (supplemented with Instant Ocean Sea Salt (Spectrum Brands, Inc., Blacksburg, VA)). Adult zebrafish are fed twice daily with one feed of hatched Artemia (1st instar) (Brine Shrimp Direct, Inc., Ogden, UT) and one feed of Zeigler Adult Diet (Zeigler Bros, Inc., Gardners, PA). Embryos up to 5 dpf were maintained at 28.5 °C in E2 embryo media. Animal husbandry was according to IACUC approved protocol 2019–078 (zebrafish) approved for Stowers Institute for Medical Research.
ATAC-seq.
For harvesting tissues, the fish were euthanized in MS-222 and immediately dissected. Dissections were performed in the morning (3 h after light turns on) after fasting the fish overnight. Livers were dissected from 3 fish each for surface, Pachón and Tinaja populations and divided into two parts for RNA-seq and ATAC-seq. ATAC-seq was performed as per Buenrostro et al.52 with some modifications to accommodate the use of whole tissues as starting material instead of cells. Livers were homogenized (30–40 strokes) using the loose pestle of Dounce homogenizer in lysis buffer (10 mM Tris·Cl, pH 7.4, 10 mM NaCl, 3 mM MgCl2, 0.1% (v/v) Igepal CA-630) to prepare nuclei. Rupturing of cell membrane and obtainment of nuclei was confirmed using Trypan blue staining under a phase contrast microscope. Nuclei were counted under microscope and ~70,000 nuclei were taken and spun down at 1,500g at 4 °C. The nuclei were resuspended in transposition mixture (25 μl TD of 2× reaction buffer from Nextera kit, 2.5 μl TDE1 Tn5 Transposase from Nextera kit, 22.5 μl nuclease-free water) and incubated at 37 °C for 22–24 min. The reaction was purified, and the library was prepared as per the original protocol52. Paired-end sequencing was performed using the Illumina Next-seq Mid-output mode. Quality control data consisting of number of reads per sample and number of peaks obtained are available in Supplementary Table 3.
RNA-seq.
The part of the livers that was used for RNA-seq was frozen and later used for RNA extraction using the Qiagen RNeasy kit. RNA-seq and ATAC-seq were performed using the same liver samples in order to get maximum possible correlation between chromatin accessibility. Libraries were prepared according to manufacturer’s instructions using the TruSeq Stranded mRNA Prep Kit (Illumina). The resulting libraries were purified using the Agencourt AMPure XP system (Beckman Coulter) then quantified using a Bioanalyzer (Agilent Technologies) and a Qubit fluorometer (Life Technologies). Libraries were re-quantified, normalized, pooled and sequenced on an Illumina HiSeq 2500 instrument as 50-bp single read. Following sequencing, Illumina Real Time Analysis version 1.18.64 and bcl2fastq2 v2.20 were run to demultiplex reads and generate FASTQ files.
Chromatin immunoprecipitation.
Adult livers were dissected and fixed in 1% formaldehyde for 15 min. Chromatin was prepared using the MAGnify Low Cell ChIP-Seq Kit (Thermo Fischer). Antibodies were validated by western blotting (Supplementary Fig. 6g). Anti-tubulin antibody was used for loading control. Anti-histone antibodies were used in 1:1,000 dilution and anti-tubulin was used in 1:10,000 dilution. ChIP was done for H3K4me3 (Millipore, # 07–473), H3K27ac (Abcam, # ab4729), and H3K27me3 (Abcam, # ab195477). 200,000 cells and 1 μg of antibody were used for each sample. Libraries were prepared using the KAPA HTP Library Prep Kit for Illumina and Bioo Scientific NEXTflex DNA barcodes. The resulting libraries were purified using the Agencourt AMPure XP system (Beckman Coulter) then quantified using a Bioanalyzer (Agilent Technologies) and a Qubit fluorometer (Life Technologies). Post amplification size selection was performed on all libraries using a Pippin Prep (Sage Science). Libraries were re-quantified, normalized, pooled and sequenced on Illumina HiSeq 2500 instrument as 50-bp single read. Following sequencing, Illumina Real Time Analysis version 1.18.64 and bcl2fastq2 v2.18.0.12 were run to demultiplex reads and generate FASTQ files.
RNA-seq analysis.
Reads were aligned to astMex_2.0 and gene models from Ensembl 96 with STAR version 2.6.1c53 with --outFilterMultimapNmax 2 and --quantMode GeneCounts to generate a count table. The gene counts were analyzed in R using the edgeR library54 to identify genes differentially expressed between Pachón vs. surface and Tinaja vs. surface fish. P-values were adjusted for multiple hypothesis testing by the method of Benjamini and Hochberg55.
ChIP-seq and ATAC-seq analyses.
The surface fish genome, publicly available on Ensembl since 2017 (astMex_2.0), was used as the reference genome for all analysis in the study unless otherwise mentioned. Approximately 40 million reads were produced for each sample. For analysis of chromatin marks, FASTQ files were aligned to astMex_2.0 using bowtie2 under default parameters. Reads mapping to the mitochondrial chromosome were filtered out using samtools prior to calling peaks with MACS2 under default parameters. ATAC-seq data was aligned to astMex_2.0 using bowtie2 with the following parameters: -X 2000 –very-sensitive. More than 80% of the reads successfully mapped to the reference genome (Supplementary Table 3). Duplication rate was assessed at less than 0.4% per sample using Picard MarkDuplicates. Fragment size distribution was examined with ATACseqQC56 from Bioconductor, indicating mean fragment length of 200 bases, and decreasing in frequency with a periodicity of 200 bp. Peaks were called with MACS2 using default parameters. Supplementary Table 3 gives the number of peaks obtained for each fish type. For each chromatin mark and the ATAC data set, a reference set of peaks was created for each type of fish by reducing peaks from multiple replicates to a single peak set, and only keeping peaks observed in at least two replicates. The ATAC peak reference loci were quantified across all samples by tallying read overlaps in R and analyzed for differential accessibility between fish using edgeR54 to calculate logFC ratios and P-values for each locus. ATAC peak loci with average CPM values less than 1 were not considered for further analysis. P-values were adjusted by Benjamini-Hochberg55, and those with a value less than 0.0001 were considered differentially open between the two morphotypes. ATAC-seq loci were then scored for overlap (1 or 0) with each chromatin mark and mapped to the nearest gene using the GenomicRanges library in R. For analysis of ChromHMM, pathway and motif enrichment we used CREs within 10 kb of the nearest TSS.
Heatmaps.
Heatmaps for signals around transcription start sites (TSS), i.e. promoters, show the reads per million (RPM) normalized to ChIP-seq signals around TSS regions (2 kb upstream and downstream) of 18,836 transcripts. Transcripts were selected by: (i) Ensembl 94 protein-coding genes; (ii) longest transcript for each gene; (iii) no overlapping transcripts. The 4-kb TSS regions were binned into 100 bins (40 bp per bin) and average RPM signal was calculated for each bin. TSS regions were ordered based on average ATAC signals in decreasing order.
Heatmaps for differentially accessible CREs consist of 1,698 cave-biased and 1,880 surface-biased peaks with q-value < 0.05. In addition, the differential peaks had q-values < 0.05 for both Pachón vs. surface and Tinaja vs. surface. Conversely, invariant peaks represented in the heatmap had q-values (Pachón vs. surface, Tinaja vs. surface, and Pachón vs. Tinaja) were all greater than 0.90 (1,991 peaks). We plotted the reads per million (RPM) normalized ATAC signals (row scaled as Z-scores) in ±1-kb regions around peak centers using R package EnrichedHeatmap57. We plotted the expression (normalized TPM, row-scaled) of the nearest gene (within 10-kb region) for differentially accessible CREs in the three morphotypes. Genes are ordered based on average fold change between surface fish and cavefish. For surface-biased peaks, genes express higher in surface fish than cavefish (one-sided t-test P-values are 0.014 for surface vs. Pachón and 0.052 for surface vs. Tinaja); and for cave-biased peaks, genes express higher in cavefish than surface fish (one-sided t-test P-values are 0.033 for Pachón vs. surface and 0.031 for Tinaja vs. surface).
Conservation.
All conservation analyses were done using the AstMex1 genome. Genomic Evolutionary Rate Profiling (GERP) regions and their conservation scores for 11 fish conservation were obtained from Ensembl. To obtain evolutionarily conserved CREs, overlap was seen between open chromatin regions and evolutionarily constrained regions from GERP. We omitted exons from the GERP regions in order to prevent bias from the highly conserved exonic regions. To obtain the background level of conservation, size-matched random sets of regions were obtained from the genome and the process was iterated 1,000 times. To find orthologs of known human liver enhancers, human multiz100way genome alignments were downloaded from UCSC and pairwise alignments between human (hg19) and cavefish (astMex1) were extracted using UCSC utilities (mafSpeciesSubset). Then bedtools (v2.26.0) was used to map human enhancers to their nearest conserved regions58.
ChromHMM.
We applied ChromHMM (v1.15) on H3K27ac, H3K4me3, and H3K27me3 histone marks for three morphotypes types (surface, Pachón, and Tinaja). Cavefish genome for ChromHMM was built using Ensembl 94 cavefish genome and annotation release. ChIP-seq BAM files were binarized using BinarizeBam command with bin size (-b option) of 200 and Poisson threshold (-p option) of 0.001. Next we built a 7-state hidden Markov model (HMM) using LearnModel with default parameters.
ChromHMM state distribution.
ATAC consensus peaks were resized to 400 bp around peak center. Cavefish genome was binned into 200-bp non-overlapping bins using bedtools makewindows command. We then assigned a ChromHMM state to each ATAC peak or genome bin, requiring the state covered at least 50% of the ATAC peak or genome bin. Next, ChromHMM state distribution was calculated for ATAC peaks and genome bins by counting the occurrences of each assigned state.
ChromHMM state enrichment.
We randomly placed the ATAC consensus peaks (resized to 400 bp) onto cavefish genome using bedtools shuffle (with -noOverlapping option) command. This shuffling process was repeated 1,000 times. For each shuffled ATAC peaks, we computed its ChromHMM state distribution in the same way mentioned above and calculated the log2 enrichment ratio between the true and shuffled distribution. The bar plot showed the average enrichment ratio and the standard deviation (n = 1,000) for each ChromHMM state.
Motif and pathway analysis.
Motif enrichment analysis was done using HOMER59 with the command ‘findMotifsGenome.pl -size given’ and known vertebrate motifs were analyzed. Pathway (Reactome) analysis was performed using Molecular Signatures Database of the Gene Set Enrichment Analysis60,61 with default parameters after converting Astyanax Ensembl gene IDs to Human IDs.
Variant calling.
Reads from paired-end ATAC-seq FASTQ files were aligned to the astMex_2.0 Surface fish genome from Ensembl and marked by Read Group with BWA mem version 0.7.17. BAM files were merged and deduplicated using GATK62. Reads were processed for calling variants with HaplotypeCaller using a GATK best practices pipeline implemented with Snakemake. Two rounds of bootstrapping with filtering were used to create a reference set of variants for Base Quality Score Recalibration prior to calling variants against astMex_2.0. SNPs and indels were selected and hard filtered based on GATK generic hard filtering recommendations, in brief, for SNPs: QD < 2.0, FS > 60.0, MQ < 40.0, ReadPosRankSum < -8.0, and for indels: QD < 2.0, FS > 200.0, ReadPosRankSum < -20.0. To normalize for varying peak width, we focused on a 200-bp region spanning the peak center. In addition, we ensured that all SNPs considered for this analysis must be called in both surface and cave sequences to avoid any bias due to lack of SNP call. These fish are laboratory stocks and likely somewhat inbred; thus, we had little power to assign allele frequencies between cave and surface pooled samples. For all analyses, we concentrate on differences that were completely fixed in our data set between the surface genotypes and the cave genotypes.
motifBreakR.
Single nucleotide polymorphisms in cavefish and surface fish were annotated for their potential effect on transcription factor binding motifs from the HOCOMOCO database from MotifDB 1.30 from Bioconductor using the R package motifBreakR43,63. The main function of the package was run with the following parameters: filterp=TRUE, threshold=1e-4, method=“ic”, and bkg=c(A=0.25, C=0.25, G=0.25, T=0.25).
Selection of candidates for functional testing.
We set a series of criteria by which we selected differential CRE candidates for functional testing. After selecting for candidates with polymorphisms, a well annotated neighboring gene and a biased gene expression, we were left with 466 candidates to choose from. We first looked at the details of the genomic context of the CRE. We checked if the flanking regions of the CRE maintained the biased epigenetic signature and that there were no major unbiased peaks in the immediate flanking regions. We next looked for various characteristics of the neighboring gene. We selected CREs that were associated to genes with highly differential expression levels in our RNA-seq analysis for example, Nos and Hpdb. Lastly, we reviewed literature and focused on CREs associated with genes that were involved in metabolic processes like carbohydrate or fat metabolism or pathways that maintain health of the tissues like inflammatory pathway, etc. Supplementary Table 2 lists the final list of candidates tested in reporter assays along with details of the epigenetic signature and the associated genes.
Cloning and reporter assays.
Candidate CREs from surface, Pachón and Tinaja genomes were amplified from genome or synthesized commercially (GenScript) and cloned into pGL4.23 (Promega) and HLC47 vectors using Gibson assembly (NEB, Cat # E2611). All primers used in the study along with their descriptions are listed in Supplementary Table 4.
Reporter assays were performed in Astyanax surface fish embryos and zebrafish embryos, adult zebrafish liver cell line ZFL and human liver cell line HepG2. For zebrafish microinjections, differential CRE candidates were cloned into a Tol2-based vector with minimal c-fos promoter and downstream GFP. In general, a minimum of 100 embryos were injected to monitor activity for each construct due to mosaicism and position effects of integration. Embryos, representative of >40% of the injected ones, are depicted in the pictures. Astyanax and zebrafish larvae were anesthetized using buffered MS-222 and immersed in 3% methyl cellulose in a depression slide and imaged using Leica Stereomicroscope.
For luciferase reporter assays, the CRE candidates were cloned into the pGL4.23 vector (Promega) at the EcoRV site upstream to a minimal promoter driving firefly luciferase gene. To control for transfection efficiency, a pRLTK vector (Promega) that expressed Renilla luciferase gene was co-transfected. All transfections were done using Lipofectamine LTX with Plus reagent (Cat # 15338030) in 24-well plates with 350 ng of test construct and 150 ng of control plasmid. Luciferase activity was measured 48 h post transfection using a luminometer (Victor X Light, Perkin Elmer). All constructs were done in 2 or more replicates and relative enhancer activity was calculated by normalizing empty vector to 1. Significance was determined using two-tailed Student’s t-test.
Electromobility shift assays.
Gel-shift assays were performed using recombinant Human IRF2 protein (Sigma, #SRP6338). 10 pmol of single-stranded oligos for surface fish IRF2 binding site and corresponding mutant cavefish IRF2 site were end-labeled with 32P radioisotope using polynucleotide kinase, annealed with complementary strands to make double-stranded oligos and purified using G-25 spin columns (GE Healthcare, #27–5325-01). Binding reactions were set up as follows: 1× binding buffer (5× binding buffer: 50 mM Tris 7.5, 375 mM NaCl, 5 mM EDTA, 30% glycerol, 15 mM spermidine, 5 mM DTT), 50 ng/μL polydI•dC, 0.25 μg protein, 100 fmol of labeled target probe and 25 pmol of mutant or non-specific oligo in a final volume of 20 μL. The binding reaction was set up in cold and then incubated at room temperature for 20 min. DNA-protein complexes were separated on non-denaturing 6% DNA retardation gels (Invitrogen, #EC63655BOX) at 100V constant voltage for 50 min. Post-run, the gel was fixed in gel fixation solution (40% v/v methanol, 10% v/v acetic acid) for 30 min and exposed to Phosphor Imaging screen overnight and imaged using Typhoon scanner.
Data availability.
Original data underlying this manuscript can be accessed from the Stowers Original Data Repository at http://www.stowers.org/research/publications/libpb-1538. The ATAC-seq, ChIP-seq and RNA-seq data can be found at GEO accession number GSE153052.
Code availability.
All the code used for the analysis can be accessed from the Stowers Original Data Repository at http://www.stowers.org/research/publications/libpb-1538.
Supplementary Material
Genomic coordinates of all CREs identified in the study
Raw read counts for RNA-seq data
Acknowledgements
We are grateful to the cavefish and aquatics core facilities at the Stowers Institute for support and husbandry of the cavefish and zebrafish. DNA samples for wild-caught Tinaja, Yerbaniz, Piedras and Japonés cavefish were generously provided by Richard Borowsky, and Bill Jeffery provided Astyanax liver samples for preliminary ChIP experiments. We thank Malcolm Cook for help with motif analysis software, Kyle Weaver for helping with high-throughput genotyping, and Mark Miller for illustrations. We thank Robb Krumlauf and Julia Zeitlinger for useful inputs throughout the study and critical reading of the manuscript. N.R. is supported by institutional funding, NIH Grants 1DP2AG071466-01 and R01 GM127872, and NSF EDGE award 1923372. R.P. was supported by a grant (no. PE 2807/1-1) from Deutsche Forschungsgemeinschaft.
Footnotes
Competing Interests
The authors declare no competing interests.
References
- 1.Wittkopp PJ & Kalay G Cis-regulatory elements: molecular mechanisms and evolutionary processes underlying divergence. Nat. Rev. Genet 13, 59–69 (2011). [DOI] [PubMed] [Google Scholar]
- 2.Long HK, Prescott SL & Wysocka J Ever-changing landscapes: transcriptional enhancers in development and evolution. Cell 167, 1170–1187 (2016). [DOI] [PMC free article] [PubMed] [Google Scholar]
- 3.Prescott SL et al. Enhancer divergence and cis-regulatory evolution in the human and chimp neural crest. Cell 163, 68–83 (2015). [DOI] [PMC free article] [PubMed] [Google Scholar]
- 4.Thompson AC et al. A novel enhancer near the Pitx1 gene influences development and evolution of pelvic appendages in vertebrates. Elife 7, e38555 (2018). [DOI] [PMC free article] [PubMed] [Google Scholar]
- 5.Partha R et al. Subterranean mammals show convergent regression in ocular genes and enhancers, along with adaptation to tunneling. Elife 6, e25884 (2017). [DOI] [PMC free article] [PubMed] [Google Scholar]
- 6.Gore AV et al. An epigenetic mechanism for cavefish eye degeneration. Nat. Ecol. Evol 2, 1155–1160 (2018). [DOI] [PMC free article] [PubMed] [Google Scholar]
- 7.Jeffery WR Astyanax surface and cave fish morphs. Evodevo 11, 14 (2020). [DOI] [PMC free article] [PubMed] [Google Scholar]
- 8.Krishnan J & Rohner N Sweet fish: Fish models for the study of hyperglycemia and diabetes. J. Diabetes 11, 193–203 (2019). [DOI] [PubMed] [Google Scholar]
- 9.Bradic M, Beerli P, Garcia-de Leon FJ, Esquivel-Bobadilla S & Borowsky RL Gene flow and population structure in the Mexican blind cavefish complex (Astyanax mexicanus). BMC Evol. Biol 12, 9 (2012). [DOI] [PMC free article] [PubMed] [Google Scholar]
- 10.Herman A et al. The role of gene flow in rapid and repeated evolution of cave-related traits in Mexican tetra, Astyanax mexicanus. Mol. Ecol 27, 4397–4416 (2018). [DOI] [PMC free article] [PubMed] [Google Scholar]
- 11.Coghill LM, Darrin Hulsey C, Chaves-Campos J, Garcia de Leon FJ & Johnson SG Next generation phylogeography of cave and surface Astyanax mexicanus. Mol. Phylogenet. Evol 79, 368–374 (2014). [DOI] [PubMed] [Google Scholar]
- 12.Riddle MR et al. Insulin resistance in cavefish as an adaptation to a nutrient-limited environment. Nature 555, 647–651 6 (2018). [DOI] [PMC free article] [PubMed] [Google Scholar]
- 13.Aspiras AC, Rohner N, Martineau B, Borowsky RL & Tabin CJ Melanocortin 4 receptor mutations contribute to the adaptation of cavefish to nutrient-poor conditions. Proc. Natl. Acad. Sci. USA 112, 9668–9673 (2015). [DOI] [PMC free article] [PubMed] [Google Scholar]
- 14.Rui L Energy metabolism in the liver. Compr. Physiol 4, 177–197 (2014). [DOI] [PMC free article] [PubMed] [Google Scholar]
- 15.Dowling TE, Martasian DP & Jeffery WR Evidence for multiple genetic forms with similar eyeless phenotypes in the blind cavefish, Astyanax mexicanus. Mol. Biol. Evol 19, 446–455 (2002). [DOI] [PubMed] [Google Scholar]
- 16.Gross DS & Garrard WT Nuclease hypersensitive sites in chromatin. Annu. Rev. Biochem 57, 159–197 (1988). [DOI] [PubMed] [Google Scholar]
- 17.Daugherty AC et al. Chromatin accessibility dynamics reveal novel functional enhancers in C. elegans. Genome Res 27, 2096–2107 (2017). [DOI] [PMC free article] [PubMed] [Google Scholar]
- 18.Klemm SL, Shipony Z & Greenleaf WJ Chromatin accessibility and the regulatory epigenome. Nat. Rev. Genet 20, 207–220 (2019). [DOI] [PubMed] [Google Scholar]
- 19.Warren WC et al. A chromosome-level genome of Astyanax mexicanus surface fish for comparing population-specific genetic differences contributing to trait evolution. Nat. Commun 12, 1447 (2021). [DOI] [PMC free article] [PubMed] [Google Scholar]
- 20.Ernst J & Kellis M ChromHMM: automating chromatin-state discovery and characterization. Nat. Methods 9, 215–216 (2012). [DOI] [PMC free article] [PubMed] [Google Scholar]
- 21.Zhou VW, Goren A & Bernstein BE Charting histone modifications and the functional organization of mammalian genomes. Nat. Rev. Genet 12, 7–18 (2011). [DOI] [PubMed] [Google Scholar]
- 22.Cooper GM et al. Distribution and intensity of constraint in mammalian genomic sequence. Genome Res 15, 901–913 (2005). [DOI] [PMC free article] [PubMed] [Google Scholar]
- 23.Villar D et al. Enhancer evolution across 20 mammalian species. Cell 160, 554–566 (2015). [DOI] [PMC free article] [PubMed] [Google Scholar]
- 24.Schmidt D et al. Five-vertebrate ChIP-seq reveals the evolutionary dynamics of transcription factor binding. Science 328, 1036–1040 (2010). [DOI] [PMC free article] [PubMed] [Google Scholar]
- 25.Hong JW, Hendrix DA & Levine MS Shadow enhancers as a source of evolutionary novelty. Science 321, 1314 (2008). [DOI] [PMC free article] [PubMed] [Google Scholar]
- 26.Wong ES et al. Decoupling of evolutionary changes in transcription factor binding and gene expression in mammals. Genome Res 25, 167–178 (2015). [DOI] [PMC free article] [PubMed] [Google Scholar]
- 27.Hariprakash JM & Ferrari F Computational biology solutions to identify enhancers-target gene pairs. Comput. Struct. Biotechnol. J 17, 821–831 (2019). [DOI] [PMC free article] [PubMed] [Google Scholar]
- 28.Mifsud B et al. Mapping long-range promoter contacts in human cells with high-resolution capture Hi-C. Nat. Genet 47, 598–606 (2015). [DOI] [PubMed] [Google Scholar]
- 29.Fishilevich S et al. GeneHancer: genome-wide integration of enhancers and target genes in GeneCards. Database (Oxford) 2017, bax028 (2017). [DOI] [PMC free article] [PubMed] [Google Scholar]
- 30.Xiong S, Krishnan J, Peuss R & Rohner N Early adipogenesis contributes to excess fat accumulation in cave populations of Astyanax mexicanus. Dev. Biol 15, 297–304 (2018). [DOI] [PubMed] [Google Scholar]
- 31.Flannick J et al. Loss-of-function mutations in SLC30A8 protect against type 2 diabetes. Nat. Genet 46, 357–363 (2014). [DOI] [PMC free article] [PubMed] [Google Scholar]
- 32.Eissing L et al. De novo lipogenesis in human fat and liver is linked to ChREBP-beta and metabolic health. Nat. Commun 4, 1528 (2013). [DOI] [PMC free article] [PubMed] [Google Scholar]
- 33.Ham M et al. Glucose-6-phosphate dehydrogenase deficiency improves insulin resistance with reduced adipose tissue inflammation in obesity. Diabetes 65, 2624–2638 (2016). [DOI] [PubMed] [Google Scholar]
- 34.He Y et al. The role of retinoic acid in hepatic lipid homeostasis defined by genomic binding and transcriptome profiling. BMC Genomics 14, 575 (2013). [DOI] [PMC free article] [PubMed] [Google Scholar]
- 35.Laurencikiene J & Ryden M Liver X receptors and fat cell metabolism. Int. J. Obes. (Lond) 36, 1494–1502 (2012). [DOI] [PMC free article] [PubMed] [Google Scholar]
- 36.Weissglas-Volkov D et al. Common hepatic nuclear factor-4alpha variants are associated with high serum lipid levels and the metabolic syndrome. Diabetes 55, 1970–1977 (2006). [DOI] [PubMed] [Google Scholar]
- 37.Lu YH, Dallner OS, Birsoy K, Fayzikhodjaeva G & Friedman JM Nuclear Factor-Y is an adipogenic factor that regulates leptin gene expression. Mol. Metab 4, 392–405 (2015). [DOI] [PMC free article] [PubMed] [Google Scholar]
- 38.Truty MJ, Lomberk G, Fernandez-Zapico ME & Urrutia R Silencing of the transforming growth factor-beta (TGFbeta) receptor II by Kruppel-like factor 14 underscores the importance of a negative feedback mechanism in TGFbeta signaling. J. Biol. Chem 284, 6291–6300 (2009). [DOI] [PMC free article] [PubMed] [Google Scholar]
- 39.Phillips-Cremins JE et al. Architectural protein subclasses shape 3D organization of genomes during lineage commitment. Cell 153, 1281–1295 (2013). [DOI] [PMC free article] [PubMed] [Google Scholar]
- 40.Kentepozidou E et al. Clustered CTCF binding is an evolutionary mechanism to maintain topologically associating domains. Genome Biol 21, 5 (2020). [DOI] [PMC free article] [PubMed] [Google Scholar]
- 41.Chan YF et al. Adaptive evolution of pelvic reduction in sticklebacks by recurrent deletion of a Pitx1 enhancer. Science 327, 302–305 (2010). [DOI] [PMC free article] [PubMed] [Google Scholar]
- 42.Bradic M, Teotonio H & Borowsky RL The population genomics of repeated evolution in the blind cavefish Astyanax mexicanus. Mol. Biol. Evol 30, 2383–2400 (2013). [DOI] [PMC free article] [PubMed] [Google Scholar]
- 43.Coetzee SG, Coetzee GA & Hazelett DJ motifbreakR: an R/Bioconductor package for predicting variant effects at transcription factor binding sites. Bioinformatics 31, 3847–3849 (2015). [DOI] [PMC free article] [PubMed] [Google Scholar]
- 44.Raile K et al. HNF1B abnormality (mature-onset diabetes of the young 5) in children and adolescents: high prevalence in autoantibody-negative type 1 diabetes with kidney defects. Diabetes Care 31, e83 (2008). [DOI] [PubMed] [Google Scholar]
- 45.Howe KL et al. Ensembl 2021. Nucleic Acids Res 49, D884–D891 (2021). [DOI] [PMC free article] [PubMed] [Google Scholar]
- 46.Fisher S et al. Evaluating the biological relevance of putative enhancers using Tol2 transposon-mediated transgenesis in zebrafish. Nat. Protoc 1, 1297–1305 (2006). [DOI] [PubMed] [Google Scholar]
- 47.Parker HJ, Bronner ME & Krumlauf R A Hox regulatory network of hindbrain segmentation is conserved to the base of vertebrates. Nature 514, 490–493 (2014). [DOI] [PMC free article] [PubMed] [Google Scholar]
- 48.Wittkopp PJ, Haerum BK & Clark AG Evolutionary changes in cis and trans gene regulation. Nature 430, 85–88 (2004). [DOI] [PubMed] [Google Scholar]
- 49.Bilandzija H, Ma L, Parkhurst A & Jeffery WR A potential benefit of albinism in Astyanax cavefish: downregulation of the oca2 gene increases tyrosine and catecholamine levels as an alternative to melanin synthesis. PLoS One 8, e80823 (2013). [DOI] [PMC free article] [PubMed] [Google Scholar]
- 50.Krishnan J et al. Comparative transcriptome analysis of wild and lab populations of Astyanax mexicanus uncovers differential effects of environment and morphotype on gene expression. J. Exp. Zool. B Mol. Dev. Evol 334, 530–539 (2020). [DOI] [PubMed] [Google Scholar]
- 51.Jeffery WR Regressive evolution in Astyanax cavefish. Annu. Rev. Genet 43, 25–47 (2009). [DOI] [PMC free article] [PubMed] [Google Scholar]
Methods-only references
- 52.Buenrostro JD, Wu B, Chang HY & Greenleaf WJ ATAC-seq: a method for assaying chromatin accessibility genome-wide. Curr. Protoc. Mol. Biol 109, 21.29.1–21.29.9 (2015). [DOI] [PMC free article] [PubMed] [Google Scholar]
- 53.Dobin A et al. STAR: ultrafast universal RNA-seq aligner. Bioinformatics 29, 15–21 (2013). [DOI] [PMC free article] [PubMed] [Google Scholar]
- 54.Robinson MD, McCarthy DJ & Smyth GK edgeR: a Bioconductor package for differential expression analysis of digital gene expression data. Bioinformatics 26, 139–140 (2010). [DOI] [PMC free article] [PubMed] [Google Scholar]
- 55.Benjamini Y & Hochberg Y Controlling the false discovery rate: a practical and powerful approach to multiple testing. Journal of the Royal Statistical Society: Series B (Methodological) 57, 289–300 (1995). [Google Scholar]
- 56.Ou J et al. ATACseqQC: a Bioconductor package for post-alignment quality assessment of ATAC-seq data. BMC Genomics 19, 169 (2018). [DOI] [PMC free article] [PubMed] [Google Scholar]
- 57.Gu Z, Eils R, Schlesner M & Ishaque N EnrichedHeatmap: an R/Bioconductor package for comprehensive visualization of genomic signal associations. BMC Genomics 19, 234 (2018). [DOI] [PMC free article] [PubMed] [Google Scholar]
- 58.Quinlan AR & Hall IM BEDTools: a flexible suite of utilities for comparing genomic features. Bioinformatics 26, 841–842 (2010). [DOI] [PMC free article] [PubMed] [Google Scholar]
- 59.Heinz S et al. Simple combinations of lineage-determining transcription factors prime cis-regulatory elements required for macrophage and B cell identities. Mol. Cell 38, 576–589 (2010). [DOI] [PMC free article] [PubMed] [Google Scholar]
- 60.Subramanian A et al. Gene set enrichment analysis: a knowledge-based approach for interpreting genome-wide expression profiles. Proc. Natl. Acad. Sci. USA 102, 15545–15550 (2005). [DOI] [PMC free article] [PubMed] [Google Scholar]
- 61.Mootha VK et al. PGC-1alpha-responsive genes involved in oxidative phosphorylation are coordinately downregulated in human diabetes. Nat. Genet 34, 267–273 (2003). [DOI] [PubMed] [Google Scholar]
- 62.Van der Auwera GA et al. From FastQ data to high confidence variant calls: the Genome Analysis Toolkit best practices pipeline. Curr. Protoc. Bioinformatics. 43, 11.10.1–11.10.33 (2013). [DOI] [PMC free article] [PubMed] [Google Scholar]
- 63.Kulakovskiy IV et al. HOCOMOCO: towards a complete collection of transcription factor binding models for human and mouse via large-scale ChIP-Seq analysis. Nucleic Acids Res 46, D252–D259 (2018). [DOI] [PMC free article] [PubMed] [Google Scholar]
Associated Data
This section collects any data citations, data availability statements, or supplementary materials included in this article.
Supplementary Materials
Genomic coordinates of all CREs identified in the study
Raw read counts for RNA-seq data
Data Availability Statement
Original data underlying this manuscript can be accessed from the Stowers Original Data Repository at http://www.stowers.org/research/publications/libpb-1538. The ATAC-seq, ChIP-seq and RNA-seq data can be found at GEO accession number GSE153052.