

Abstract
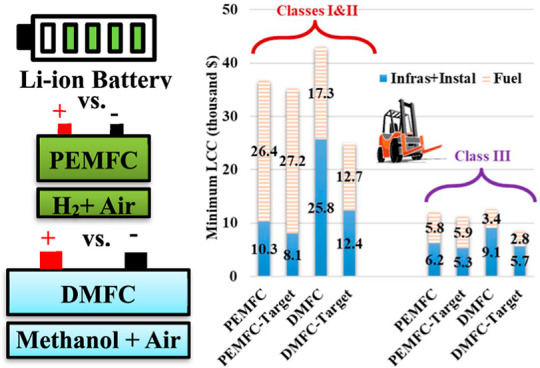
This study compared the life cycle cost (LCC) of LiFePO4 battery, proton exchange membrane fuel cell (PEMFC), and direct methanol fuel cell (DMFC) as the main power source of electric forklifts. The battery showed the lowest LCC over 10 years ($14,935) among the three power sources, thanks to the significant price reduction in recent years. The fuel cost accounted for more than 70% of the total LCC of PEMFC ($36,682) when the hydrogen price was $8/kg. The LCC of DMFC ($41,819) with the current performance and catalyst loading (0.2 W/cm2, 6 mgPGM/cm2) was 12% higher than the LCC of PEMFC ($36,682). The LCC of DMFC ($25,050) will be 28.9% lower than that of PEMFC if both PEMFC and DMFC reach the target performance and catalyst loading set by the U.S. Department of Energy (1 W/cm2, 0.125 mgPGM/cm2 for PEMFC and 0.3 W/cm2, 3 mgPGM/cm2 for DMFC). The smaller fleet size will significantly increase the LCC of PEMFC due to the high cost of hydrogen fueling and storage infrastructure. For forklift users with less than 50 units, which account for 80% of forklift users, DMFC will be even more cost-effective due to the significantly lower cost of methanol infrastructure.
1. Introduction
Many industries and customers are looking for new power generation methods due to the depletion of conventional fossil fuels and the environmental impact of burning fossil fuels. This has sparked various studies and policies focused on fundamental research and deployment of various alternative energies.1 A fuel cell is a promising technology with high efficiency to replace conventional power generation technologies relying on fossil fuels.2 There has been tremendous progress to improve performance, reduce cost, and expand the reliability of fuel cell systems in the past decades.3 Fuel cells have been deployed in transportation, manufacturing, warehousing, and recreational and entertainment products.4,5 This study investigates the technical readiness and economic feasibility of proton exchange membrane fuel cells (PEMFCs) and direct methanol fuel cells (DMFCs) for material handling applications, specifically electric forklifts powered by rechargeable batteries or fuel cells.
Forklifts are commonly used in logistical and industrial fields and construction applications. A forklift and a passenger vehicle have a significant difference in stability. Most manufacturers apply a counterweight on the rear side of the forklift to prevent forklifts from falling to the loaded side. The counterweight helps the forklift to lower the center of gravity and ensure its stability. Forklifts operate at low speed to mitigate the high-power consumption caused by their heavy weight. Typical work environments also require reduced speed and frequent stops for safety. Forklifts’ average and maximum velocities are much lower than passenger vehicles. The top indoor speed of forklifts is about 8 miles per hour and 3 miles per hour in the area where pedestrians are present in the United States.6
There are seven classes of forklifts classified by their functions, methods of propulsion, and work environment by the Occupational Safety and Health Administration (OSHA).7 Forklifts in different classes have different specifications and expectations. There are two primary propulsion methods applied to forklifts: electric motors (classes I, II, III, and VI) and internal combustion engines (ICEs) (classes IV, V, VI, and VII). Powertrains of electric-motor-powered forklifts use electricity generated by fuel cells or stored in batteries. ICEs applied in forklifts typically consume fossil fuels such as gasoline, diesel, and propane. This study will focus on classes I (electric motor rider trucks), II (electric motor narrow aisle trucks), and III (electric motor hand trucks or hand/rider trucks) forklifts. Figure 1 shows the number and fractions of forklift shipments within the United States in the last 25 years.8 There have been more shipments of electric trucks (classes I, II, and III) than ICE-based trucks (classes IV and V) in the past 25 years. The fraction of electric forklift shipments experienced a significant increase during the last two economic recessions (2000 and 2008). There were more than twice as many shipments of electric forklifts as ICE units in 2020. Although the current electric forklift market mainly uses the lead-acid battery as the power source, the market share of rechargeable lithium-ion (Li-ion) batteries is increasing quickly due to technological improvements (better performance and lower cost) over the past few years. The installation cost of a lead-acid battery is much lower than a Li-ion battery with the same energy. However, the easier maintenance, shorter charging time, higher efficiency, and longer lifetime of the Li-ion battery lead to a lower life cycle cost (LCC) than a lead-acid battery.
Figure 1.

(a) Historical U.S. factory shipments and (b) fractions of electric and ICE trucks.
Fuel-cell-based power sources are very efficient and can reduce greenhouse gas (GHG) and particulate matter emissions. Unlike batteries, fuel-cell-based power sources store energy in the fuel (hydrogen or methanol) rather than the fuel cell, enabling the detachment of delivered energy from generated power. Simply using a larger fuel tank rather than building a bigger fuel cell engine can increase the vehicle’s driving range. Furthermore, it is much faster to refill a fuel cell (a few minutes) than charge a battery (a few hours). With the excellent technology improvement of rechargeable batteries (mainly Li-ion batteries) and fuel cells, both Li-ion batteries and hydrogen-driven PEMFCs have been applied to material-handling applications. DMFCs powered by liquid methanol have also attracted attention as the main power source of material-handling devices10 because liquid methanol is much cheaper, abundant, and easier to deliver than hydrogen. Based on the survey result conducted by Modern Materials Handling11 in 2020 and the U.S. Department of Energy (PGM)’s data, there are over 35,000 fuel cell forklifts as of Oct 2020.12 This study estimated that fuel-cell-powered forklifts occupy about 4% of the entire forklift industry.
This study will compare the LCC of Li-ion batteries, PEMFCs, and DMFCs as the primary power sources of classes I, II, and III forklifts using current and target performance and cost information. The LCC includes the infrastructure, initial purchasing, and fuel costs over the lifetime (10 years). Please note that this analysis does not include the cost of the lift trucks themselves. Comparing different technologies’ technical and economic feasibility can help users, manufacturers, and decision-makers identify the most promising power supply technology that could greatly benefit material-handling applications.
2. Methods and Calculation
2.1. Representative Forklift
The lifespan and energy consumption of the power source can vary depending on the model type of the forklift, the number of shifts per day, the operating hour per shift, and the fuel or electricity capacity. Manufacturers suggest replacing the forklift every 10,000–20,000 h of operation. According to the research done by the National Renewable Energy Laboratory (NREL) in 2013, users reported lift truck lifetimes ranged from 5 to 15 years with an average lifetime of 10 years.13 To simplify the total cost analysis calculation, this study assumes the average lifetimes of the forklift and the primary power sources (Li-ion battery, PEMFC, and DMFC) to be ten years. The assumption of a 10-year lifetime for PEMFCs is consistent with the fuel cell durability target of 20,000 h set by EU’s Fuel Cells and Hydrogen Joint Undertaking (FCH 2 JU).14 However, the technology readiness level of DMFCs is lower than PEMFCs. While PEMFCs can already meet DOE’s 2020 targets of catalyst loading and power density,15 only very few lab-scale DMFC experiments can get close to DOE’s target performance.16,17 In addition, there is limited regulation or research on the lifetime of DMFCs.10,18 For simplicity of comparison, this study assumes that DMFCs have the same 10-year lifetime as PEMFCs and uses model-simulated performance as the target performance of DMFCs. Although these assumptions have a favorable bias benefiting DMFCs, this study’s quantitative comparisons can still shed light on the economic feasibility of these three different types of power sources. Based on the survey results from NREL’s previous study, classes I and II forklifts operate 2400 h, fuel cell forklifts consume 300 kg of H2 (10,000 kW h), and battery forklifts consume 6600 kW h electricity annually.13 The average power and energy consumption of different classes of forklifts are summarized below:
The average power consumption is 2.75 kW for classes I and II forklifts;
The average power consumption is 0.55 kW for classes III forklifts.
The annual electricity consumption is 6600 kW h for class I and II forklifts.
The annual electricity consumption is 1320 kW h for class III forklifts.
2.2. Cost of Batteries
The rechargeable Li-ion battery technology has made significant progress in increasing the energy density and decreasing the price. The unit price of battery has been reduced from more than $1000/kW h in 2010 to around $150/kW h in 2019.19,20 Among various commercial Li-ion batteries, this study focuses on lithium iron phosphate (LiFePO4) due to its advantage of safety, stable performance under low temperature, and low cost.21 The detailed cost of LiFePO4 battery packs to meet the power and energy demands of different classes of forklifts is estimated using Argonne National Laboratory’s BatPac4.0 model,22 assuming production of 10,000 packs per year. Table 1 summarizes data used in the analysis to derive the battery cost of $6445 and $5768 for classes I or II and class III forklifts.
Table 1. Battery Design and Material Cost from the BatPac Model.
| positive electrode: LiFePO4 | cost of the positive electrode, $/kg | ||
| positive active material’s specific capacity, mA h/g | 150 | active material | $14.00 |
| void volume fraction, % | 25 | carbon | $6.60 |
| positive foil thickness, mm | 15 | binder | $9.50 |
| maximum positive electrode thickness, μm | 120 | solvent (NMP) | $3.10 |
| negative electrode: graphite | cost of the negative electrode, $/kg | ||
| negative active material’s specific capacity, mAh/g | 360 | active material | $12.50 |
| N/P capacity ratio after formation | 1.20 | carbon black | $6.60 |
| void volume fraction, % | 34 | binder | $10.00 |
| negative current collector thickness, μm | 10 | solvent (water) | $0.00 |
| separator thickness, μm | 15 | Al foil, $/m2 | $0.30 |
| Cu foil, $/m2 | $1.20 | ||
| maximum charging current density, mA/cm2 | 9.00 | separator, $/m2 | $1.10 |
| electrolyte, $/L | $15.00 |
2.3. Cost of Fuel Cells
The PEMFC cost of $1840/kW and $6964/kW are used for classes I and II and Class III forklifts, respectively.23 The DMFC cost is estimated to be $3772/kW and $9701/kW for classes I and II and class III forklifts, respectively. The detailed analyses to derive these values are discussed as follows. The cost of PEMFC, including the fuel cell stack and balance of the plant, is based on Battelle’s cost analyses of 1 and 5 kW fuel cell systems with 10,000 units in 2017.23 The cost of DMFC is derived from the cost of PEMFC because both fuel cells have almost identical stack structures, including end plates, bipolar plates, seal, oxygen delivery system, cooling system, and membrane electrode assemblies (MEAs). The MEA includes the gas diffusion layer (GDL), microporous layer (MPL), catalyst layer (CL), and proton exchange membrane (PEM). The GDL, MPL, and PEM in a DMFC are identical to those in a PEMFC. The major difference is that DMFCs use much higher catalyst loading (anode: 4.5 mgPtRu/cm2; cathode: 1.5 mgPt/cm2) than PEMFCs (anode: 0.1 mgPt/cm2; cathode: 0.25 mgPt/cm2). Therefore, the cost of a DMFC is higher than that of a PEMFC per active area of MEA. Table 2 shows the cost per unit area of PEMFC and DMFC stacks for class III and classes I and II forklifts.
Table 2. Fuel Cell Cost Break Down.
| PEMFC |
DMFC-current |
|||
|---|---|---|---|---|
| 1 kW | 5 kW | 1 kW | 5 kW | |
| components cost | $435.63 | $1031.71 | $3173.40 | $10,693.07 |
| assembly and conditioning | $145.87 | $171.16 | $145.87 | $171.16 |
| balance of plant (BOP) | $6382 | $7996 | $6382 | $7996 |
| total | $6963.50 | $9198.87 | $9701.27 | $18,860.23 |
| $/kW | $6963.50 | $1839.77 | $9701.27 | $3772.05 |
| $/cm2 | $2.49 | $0.87 | $3.46 | $1.78 |
The catalyst reduction and performance improvement of fuel cells will reduce the cost of each MEA and the number of MEAs required. This study estimates the fuel cell stack cost considering these factors and assumes the assembly cost and BOP remain unchanged. Tables 3 and 4 show the cost of a 1 and 5 kW PEMFC and DMFC with current and target performance set by the U.S. Department of Energy (DOE).
Table 3. Cost Breakdown of a 1 kW Fuel Cell.
| 1 kW fuel cell | PEMFC | DMFC-current | PEMFC-target | DMFC-target |
|---|---|---|---|---|
| components | $436 | $3173 | $274 | $1342 |
| assembly | $146 | $146 | $146 | $146 |
| BOP | $6382 | $6382 | $6382 | $6382 |
| total | $6963.5 | $9701.3 | $6801.7 | 7870.4 |
Table 4. Cost Breakdown of a 5 kW Fuel Cell.
| 5 kW fuel cell | PEMFC | DMFC | PEMFC-target | DMFC-target |
|---|---|---|---|---|
| components | $1032 | $10,693 | $656 | $4220 |
| assembly | $171 | $171 | $171 | $171 |
| BOP | $7996 | $7996 | $7996 | $7996 |
| total | $9199 | 18,860 | $8823 | $12,387 |
| cost per kW | $1839.8 | $3772.1 | $1764.6 | $2477.4 |
2.4. Capital Cost
The infrastructure cost of the storage and distribution of hydrogen is high. The hydrogen infrastructure cost was estimated to be up to $1 M per site.24 In comparison, the methanol infrastructure cost was estimated to be about $75,000 per site.24 The NREL study estimated that the annualized cost of hydrogen infrastructure (including the capital, operating, and maintenance costs) is $3700 per lift truck.13 NERL made the estimation assuming a fleet size of 58 units. This study uses the same estimated hydrogen infrastructure cost per truck and assumes the methanol infrastructure cost per truck is 1 order of magnitude lower ($370 per truck).
2.5. Fuel Cost
Forklifts mainly run on three different types of fuel: gasoline, propane, and electricity. Fuel cells that drive forklifts run on hydrogen and methanol. Figure 2 shows the price of each fuel in the last four years. The average price units for each fuel type are converted to dollars per gasoline gallon equivalent (GGE) in Table 5. The energy prices of $0.11/kW h, $8/kg,25 and $0.41/kg are used for electricity, hydrogen, and methanol, respectively, as a fixed fuel price in the baseline 10-years cost analysis. Data from U.S. DOE’s Clean Cities Alternative Fuel Price Report shows that fuel cell car users’ hydrogen costs varied between $13.68/GGE and $16.55/GGE between Jan 2016 and Oct 2021, with an average of $15.41/GGE. Even though the reported retail prices of hydrogen are high, the price will steadily decrease with the increasing production volume. The technology improvements and cost reductions of hydrogen separation membranes,26 storage, transportation, and distribution27 will also decrease the hydrogen cost. Therefore, this study uses $8/kg as the benchmark hydrogen price and carries out the sensitivity analysis assuming the hydrogen price varies between $4/kg and $12/kg. The assumed hydrogen cost is within the range of reported hydrogen cost by water electrolysis28,29 and coal gasification.30 It is higher than the reported cost of steam methane reforming, but this baseline cost is reasonable when both hydrogen production and distribution are included.31,32
Figure 2.
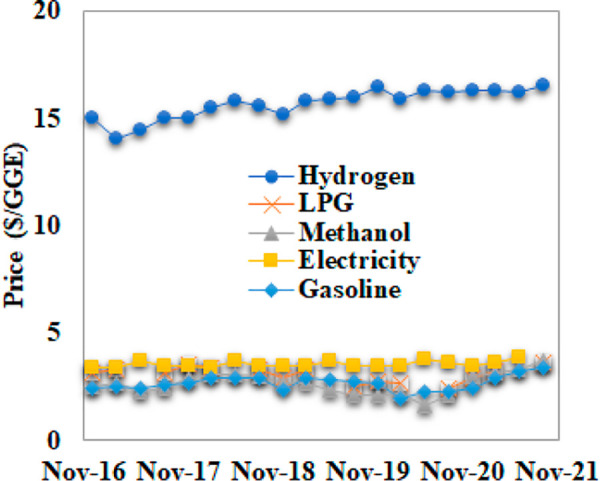
Retail fuel price in the past four years.
Table 5. Average Retail Price of Fuel per Unit Mass in the Past Four Years.
| hydrogen | LPG | methanol | electricity | gasoline | |
|---|---|---|---|---|---|
| energy content (MJ/kg or kW h) | 119.93 | 49.6 | 19.7 | 3.6 | 46.4 |
| energy content (GGE/kg/kW) | 0.989 | 0.409 | 0.162 | 0.030 | 0.383 |
| unit price ($/GGE) | 15.41 | 3.02 | 2.51 | 3.54 | 2.62 |
| unit price ($/kg or $/kW h) | 15.23 | 1.23 | 0.41 | 0.11 | 1.00 |
2.6. Fuel Cell Performance
This study uses the performance of the state-of-the-art PEMFC and DMFC tested under 80 °C and air with 50 kPa backpressure (Figure 3a) as the baseline performance.17,33 Cell voltage, power density, and efficiency as functions of the operating current density are derived based on these performance data. The following voltage equations are applied to describe the voltage of the fuel cell at a given current density, i
| 1a |
| 1b |
where Ru is the universal gas constant, 8.314 J/mol/K; F is the Faraday constant, 96485 C/mol; and T is the operating temperature of the fuel cell, 80 °C. Critical parameters such as exchange current density, i0; crossover current density, iXO; limiting current density, iL; and ohmic resistance, R, of the fuel cell are fitted based on the performance curve shown in Figure 3a. Equation 1b considers the activation loss by the anode and cathode reactions separately because the overpotential caused by both half-reactions is significant in DMFCs. The theoretical voltages, E0, of PEMFC and DMFC are calculated to be 1.17 and 1.20 V at 80 °C and 50 kPa air backpressure. The power density and efficiency of the fuel cell can be calculated based on the voltage equation
| 2 |
and
| 3 |
where the overall efficiency considers both the fuel efficiency ηfuel(i) and voltage efficiency ηvolt(i) of the fuel cell. Figure 3b shows an example of the performance and efficiency change of a DMFC with its operating current density based on collected experimental data.
Figure 3.

(a) Polarization (voltage vs current density) curves of a representative PEMFC and DMFC (b) derived efficiency, voltage, and power performance of a DMFC as an example.
It could be seen from Figure 3a that PEMFC driven by H2 has much better performance than DMFC: higher voltage and power density at any given current density. Also, because the fuel crossover in DMFC is much higher than in PEMFC, the fuel efficiency of DMFC is typically much lower than PEMFC. As a result, the overall efficiency of a DMFC is lower than that of a PEMFC. Although the power density, voltage, and efficiency of a DMFC are lower than those of a PEMFC driven by H2, liquid methanol has a much higher energy density per volume and much lower cost than H2. Therefore, the LCC of DMFCs could be lower than PEMFCs. The total LCC in a 10-year term was simulated by home-written Python codes based on fuel cell performance and estimated costs.
3. Results and Discussion
3.1. LCC of Battery, PEMFC, and DMFC
Assuming the battery and charger both have an efficiency of 90%, the energy cost to deliver 6600 kW h (classes I and II) and 1320 kW h (class III) electricity annually for ten years using a battery as the power source is estimated to be $8490 and $1698, respectively. As a result, the LCC of a battery pack is $14,935 and $7466 for classes I and II and class III forklifts, respectively.
The installation cost, fuel cost, and total LCC of fuel cells depend strongly on the operating current density (Figure 4). The increase of current density increases the power density and decreases the size of the fuel cell used to generate the same amount of power. As a result, the installation cost of a fuel cell decreases with increasing current density. On the contrary, increasing the current density will decrease the efficiency of the fuel cell and increase the fuel cost over the lifetime. The minimum LCC of $36,682 and $12,050 are obtained at a moderate current density: 521 and 764 mA/cm2 for PEMFCs applied to classes I and II and class III forklifts, respectively. The cross symbols in the figure indicate the operating point with the minimum LCC. The high price of hydrogen results in a high fuel cost over the life cycle. The hydrogen fuel cost accounts for 72 and 48% of the overall LCC for classes I and II (Figure 4a) and Class III forklifts (Figure 4c), respectively. Like a PEMFC, the installation cost of a DMFC decreases, while the fuel cost increases with the increase of current density. The minimum LCC of $43,023 and $12,562 are obtained at 591 and 646 mA/cm2 for classes I and II (Figure 4b) and class III forklifts, respectively, using DMFCs (Figure 4d). The LCC of a DMFC-based power supply is 17% higher than that of a PEMFC-based power supply for classes I and II forklifts. The cost difference (4%) is insignificant for class III forklifts.
Figure 4.

LCC of (a) PEMFC and (b) DMFC for class I and II forklifts and LCC of (c) PEMFCs and (d) DMFCs for class III forklifts.
3.2. Fuel Cell Performance Improvement and Cost Reduction
Both the PEMFC and DMFC have experienced significant improvement in performance and reduction in catalyst loading in the past decade. DOE had set the technical targets for PEMFCs to reach more than 1 W/cm2 peak power density with no more than 0.125 mgPGM/cm2. Meanwhile, our team is leading a research project to develop low-cost and high-performance DMFCs sponsored by the DOE. The project targets to improve DMFC’s peak power density to 0.3 W/cm2 and reduce the catalyst loading to 3 mgPGM/cm2 by 2023.34 The improvement of performance and cost reduction of fuel cells could reduce the LCC of fuel cells making the fuel cell an economically feasible technology for forklift applications. Figure 5a compares the polarization curves of PEMFC’s and DMFC’s current performance and target performance. The target performance of DMFC was derived based on a model study35 and the target performance of PEMFC was from a DOE report,33 both of which are shown as curves without markers. To meet the power and energy consumption of the representative forklift, the improvement of fuel cell performance leads to decreased fuel cell cost and reduced fuel cost.
Figure 5.

(a) Polarization curves of fuel cells and (b) corresponding LCCs applied to a class I or class II forklift.
The fuel cell cost reduction will lead to lower LCC, as shown in Figure 5b. Because the balance of plant (BOP) dominates (92% in 1 kW PEMFC and 87% in 5 kW PEMFC) the cost of small fuel cell systems, the unit cost of a DMFC ($2477.4/kW) with the improved performance and reduced catalyst loading is only 28.8% higher than that of PEMFC ($1764.6/kW). After meeting the target performance and catalyst loading, the minimum LCC of DMFC significantly reduces from $43,023 to $25,050 (by 41.8%), while the minimum LCC of PEMFC only reduces from $36,682 to $35,253 (by 3.9%). The cost reduction of PEMFC has a limited impact on the LCC because the hydrogen cost of PEMFC accounts for 72% of the LCC (Figure 4a). The cost reduction of DMFC from $3772.1/kW to $2477.4/kW makes the minimum LCC of DMFC ($25,050) 28.9% lower than that of a PEMFC ($35,253) for a class I or class II forklifts. DMFCs also have a cost advantage as the power source for smaller class III forklifts than PEMFCs (Figure 6): the minimum LCC of a DMFC ($8552) is 23.6% lower than that of a PEMFC ($11,198).
Figure 6.
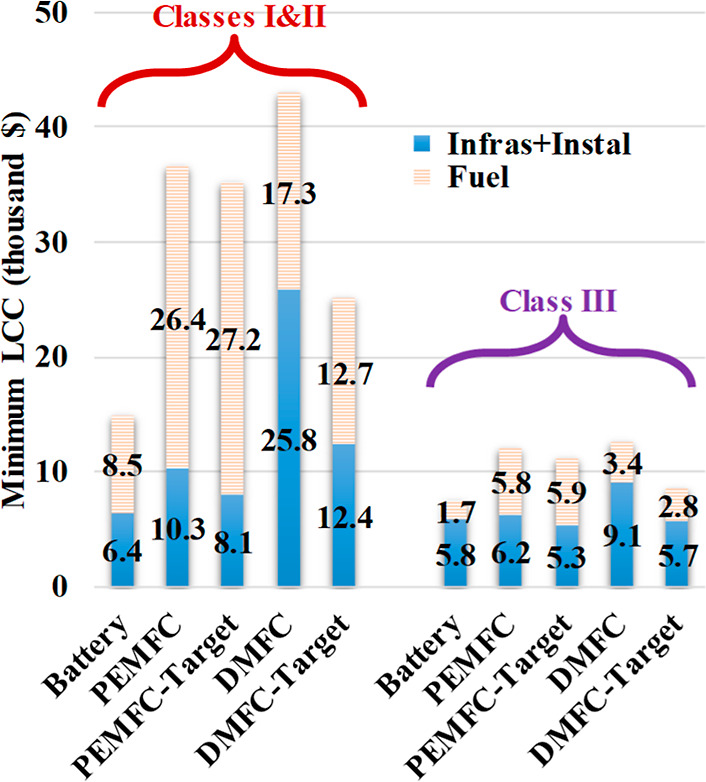
The minimum LCCs applied to class I or II or III forklifts.
3.3. Sensitivity Analysis
To investigate the sensitivity of results to economic and operating conditions, this study varies the values of the major input parameters (fuel cell price, fuel price, average power supply, annual energy supply) between 50 and 200% of the baseline values. Results shown in Figure 7 show the changes in minimum LCC when the input parameter varies. The baseline LCCs of PEMFC, DMFC, and DMFC-Target are $36,682, $43,023 and $26,917 for classes I and II forklifts. The baseline LCCs of PEMFC, DMFC, and DMFC-Target are $12,050, $12,816, and $8048 for class III forklifts. The LCC of PEMFC is very sensitive to the hydrogen price. Because the fuel cost accounts for most of PEMFC’s LCC, if the hydrogen price is doubled (to $16/GGE), the minimum LCC will be increased by 70% (to $62,373). On the contrary, the minimum LCC of the PEMFC only increases by 16% after doubling the price of the fuel cell.
Figure 7.
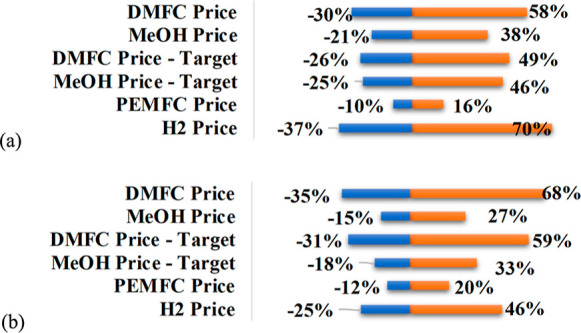
The relative change of the minimum LCC when the input parameters are changed between 50 and 200% of the base value: (a) class I and class II forklifts and (b) class III forklifts.
The fuel cell cost has a much more profound impact on the minimum LCC of DMFCs. Because the current DMFC has a relatively high PGM loading (6 mg/cm2) and a low peak power density (0.2 W/cm2), decreasing the cost of DMFCs by half could reduce the minimum LCC by 30% while doubling the fuel cell price could increase the minimum LCC by 58%. If the LCC is analyzed based on the target performance (0.3 W/cm2) and catalyst loading (3 mgPGM/cm2), the impact of fuel price on the LCC is more substantial, and this is further illustrated below.
The cost of hydrogen accounts for most of the LCC for PEMFCs and the reported hydrogen price varies significantly.36 Therefore, this model compared the min LCC when hydrogen price changes between $4/GGE and $16/GGE. The trends in Figure 8a show that the efficiency increases from 56 to 63% to minimize the LCC when the price of hydrogen increases from $4/GGE to $16/GGE. The operating current density will decrease to increase efficiency, which leads to increased fuel cell size to produce the same amount of power. As a result, the fuel cell’s installation cost slightly increases, and the fuel cost rises almost linearly when the hydrogen price increases (Figure 8b).
Figure 8.

(a) Efficiency and MEA size at the minimum LCC and (b) minimum LCC and corresponding installation and fuel cost of a PEMFC at different hydrogen prices. (c) Efficiency and MEA size at the minimum LCC and (d) minimum LCC and corresponding installation and fuel cost of a DMFC at different methanol prices.
When the methanol price is increased from $0.215/GGE to $0.645/GGE, the size of the MEA only slightly increases from 1.38 to 1.54 m2, and the fuel cell’s efficiency also slightly increased from 25 to 29% in Figure 8c. Comparisons of efficiencies (calculated by eq 3) show that DMFCs have much lower efficiencies than PEMFCs because of the low voltage efficiency and the low fuel efficiency. PEMFCs and DMFCs have similar theoretical voltages (∼1.2 V), but the operating voltages of DMFCs are lower than those of PEMFCs at similar current densities. Meanwhile, the crossover of liquid methanol through the PEM is orders of magnitude higher than PEMFCs,37,38 which reduces the fuel efficiency of DMFCs. The fuel price change has less impact on DMFCs because most of the LCC is due to the fuel cell’s installation cost (60% at the baseline). Due to the high cost of DMFCs, the operating power density (0.1995 W/cm2 at the methanol price of $0.215/GGE) to obtain the minimum LCC are close to the peak power density to minimize the size (and cost) of the fuel cell. Even when the price of methanol was increased to $0.645/GGE, the peak power density was only slightly reduced to 0.1785 W/cm2. Therefore, the infrastructure and installation cost in Figure 8d keeps almost constant at different methanol prices, while the fuel cost during the lifetime increases almost linearly with methanol price.39
4. Conclusions
This study analyzed different power sources (LiFePO4 battery, PEMFC, and DMFC) to determine the best option for forklift usage. The quick price drop of Li-ion batteries has significantly reduced the battery cost and LCC of battery packs in recent years. Among the three power sources, the LiFePO4 battery has the lowest LCC as the power source of classes I, II, and III forklifts. DMFCs with the current performance and catalyst loading have comparable LCC with PEMFCs. The performance improvement and reduction of PGM catalyst loading make DMFC a more cost-effective technology as the power source for forklifts, especially for class III forklifts with relatively low power consumption. The much lower cost of methanol infrastructure (∼$75,000 per site), compared with that of hydrogen (up to $ 1 million per site), makes the DMFC a better choice for forklift users with small fleet sizes. Quantitative results from this study are summarized as follows:
For classes I and II forklifts, with the state-of-the-art DMFC performance (0.2 W/cm2 peak power density) and catalyst loading (6 mg/cm2), the LCC of a DMFC ($41,819) is 12% higher than the LCC of a PEMFC ($36,682). If the DMFC can reach the target performance (0.3 W/cm2) and catalyst loading (3 mg/cm2), the LCC of the DMFC over ten years ($25,050) is 28.9% lower than that of PEMFC.
For class III forklifts, with the state-of-the-art DMFC performance (0.2 W/cm2 peak power density) and catalyst loading (6 mg/cm2), the LCC of DMFC ($12,621) has a negligible difference from the LCC of PEMFC ($12,380). If the DMFC can reach the target performance (0.3 W/cm2) and catalyst loading (3 mg/cm2), the LCC of the DMFC ($8144) over ten years could be 23.6% lower than that of PEMFC.
Although DMFCs have much higher catalyst loading (6 mg/cm2) than PEMFCs (0.4 mg/cm2) at the cell level, the cost difference between PEMFC and DMFC stacks is not very significant because the BOP accounts for the majority of the stack cost (more than 90% for a 1-kW stack).
The LCC of PEMFCs depends heavily on hydrogen price. The fuel cost could be more than 70% of the total LCC of a PEMFC; in comparison, the fuel cost only accounts for 40% of the total LCC of a DMFC.
5. Limitations of This Study
Although the reliability and lifetime of the fuel cell are critical to the LCC and the user’s purchasing decision, this study did not consider the reliability and the maintenance cost of the power source due to the lack of data. In addition, this study does not include a rechargeable battery and hydrogen storage in the BOP of fuel cells and does not consider the power consumption by the BOP. Fuel cells do not respond quickly to the change in power demand. Therefore, PEMFC-based and DMFC-based power sources are often integrated with batteries to meet the dynamic power demand. Although the cost increase to integrate rechargeable batteries was not considered in this analysis, PEMFC-based and DMFC-base power sources have a similar cost increase by integrating with batteries. Therefore, the LCC comparisons between PEMFC and DMFC remain the same. Existing studies on DMFCs show faster degradation rates than that of PEMFCs. As a result, the lifetime of DMFCs could be lower than that of PEMFCs. Reducing the lifetime of DMFCs will inevitably increase the LCC of DMFCs. However, due to the limited data on DMFC’s lifetime, this study assumes that DMFCs have the same lifetime of 10 years, which may underestimate the LCC of DMFCs. The hydrogen infrastructure cost was estimated based on the fleet size of 58 units. About 80% of forklift users have fleet sizes of less than 50; therefore, the LCC of a PEMFC could be significantly higher for these users because of the higher hydrogen infrastructure cost per forklift.
Acknowledgments
This material is based upon work supported by the U.S. Department of Energy’s Office of Energy Efficiency and Renewable Energy (EERE) under the Hydrogen and Fuel Cell Technologies Office, Award Number DE-EE0008440.
Glossary
List of Abbreviations
- BOP
balance of plant
- CL
catalyst layer
- DMFC
direct methanol fuel cell
- DOE
U.S. Department of Energy
- GDL
gas diffusion layer
- GGE
gasoline gallon equivalent
- GHG
greenhouse gas
- ICE
internal combustion engines
- LCC
life cycle cost
- LiFePO4
lithium iron phosphate
- Li-ion
lithium-ion
- MEA
membrane electrode assemblies
- MPL
microporous layer
- NREL
National Renewable Energy Laboratory
- OSHA
Occupational Safety and Health Administration
- PEM
proton exchange membrane
- PEMFC
proton exchange membrane fuel cell
- PGM
platinum group metal
The authors declare no competing financial interest.
References
- Orr F. M. Addressing Climate Change with Clean Energy Technology. ACS Energy Lett 2016, 1, 113–114. 10.1021/acsenergylett.6b00136. [DOI] [Google Scholar]
- Staffell I.; Scamman D.; Velazquez Abad A.; Balcombe P.; Dodds P. E.; Ekins P.; Shah N.; Ward K. R. The role of hydrogen and fuel cells in the global energy system. Energy Environ. Sci. 2019, 12, 463–491. 10.1039/c8ee01157e. [DOI] [Google Scholar]
- Pollet B. G.; Kocha S. S.; Staffell I. Current status of automotive fuel cells for sustainable transport. Curr. Opin. Electrochem. 2019, 16, 90–95. 10.1016/j.coelec.2019.04.021. [DOI] [Google Scholar]
- Wilberforce T.; Alaswad A.; Palumbo A.; Dassisti M.; Olabi A. G. Advances in stationary and portable fuel cell applications. Int. J. Hydrogen Energy 2016, 41, 16509–16522. 10.1016/j.ijhydene.2016.02.057. [DOI] [Google Scholar]
- Depcik C.; Cassady T.; Collicott B.; Burugupally S. P.; Li X.; Alam S. S.; Arandia J. R.; Hobeck J. Comparison of lithium ion Batteries, hydrogen fueled combustion Engines, and a hydrogen fuel cell in powering a small Unmanned Aerial Vehicle. Energy Convers. Manag. 2020, 207, 112514. 10.1016/j.enconman.2020.112514. [DOI] [Google Scholar]
- Occupational Safety and Health Administration . Evaluation of What Is Considered a Safe Speed to Operate Powered Industrial Trucks (Forklifts). https://www.osha.gov/laws-regs/standardinterpretations/2004-11-04 (accessed May 12, 2022).
- Occupational Safety and Health Administration . Powered Industrial Trucks eTool: Types & Fundamentals—Types: Forklift Classifications. https://www.osha.gov/SLTC/etools/pit/forklift/types/classes.html (accessed May 12, 2022).
- Johnson S.Alliance of Industrial Truck Organizations Presidents’ Forum. 2019, https://www.indtrk.org/wp-content/uploads/2019/09/ITA.pdf (accessed May 12, 2022).
- Hsieh C.-Y.; Pei P.; Bai Q.; Su A.; Weng F.-B.; Lee C.-Y. Results of a 200 hours lifetime test of a 7 kW Hybrid-Power fuel cell system on electric forklifts. Energy 2021, 214, 118941. 10.1016/j.energy.2020.118941. [DOI] [Google Scholar]
- Kimiaie N.; Wedlich K.; Hehemann M.; Lambertz R.; Müller M.; Korte C.; Stolten D. Results of a 20 000 h lifetime test of a 7 kW direct methanol fuel cell (DMFC) hybrid system - degradation of the DMFC stack and the energy storage. Energy Environ. Sci. 2014, 7, 3013–3025. 10.1039/c4ee00749b. [DOI] [Google Scholar]
- McCrea B.; Modern Materials Handling . 2020 Lift Truck Acquisition and Usage Study. 2020, https://www.mmh.com/article/2020_lift_truck_acquisition_and_usage_study (accessed May 12, 2022).
- Uene N.; Ishikawa K.; Nakajima K.; Matsuda T.; U.S. DOE Hydrogen and Fuel Cell Technologies Office Perspectives . Pacific Rim Meeting on Electrochemical and Solid State Science (PRiME), 2020.
- Ramsden T.An Evaluation of the Total Cost of Ownership of Fuel Cell-Powered Material Handling Equipment; National Renewable Energy Laboratory, 2013; p 37. NREL/TP-5600-56408. [Google Scholar]
- Fuel Cells and Hydrogen Joint Undertaking . Multi-Annual Work Plan 2014–2020. https://www.fch.europa.eu/page/multi-annual-work-plan (accessed May 12, 2022).
- Wang L.; Wan X.; Liu S.; Xu L.; Shui J. Fe-N-C catalysts for PEMFC: Progress towards the commercial application under DOE reference. J. Energy Chem. 2019, 39, 77–87. 10.1016/j.jechem.2018.12.019. [DOI] [Google Scholar]
- Rajesh Kumar S.; Ma W.-T.; Lu H.-C.; Teng L.-W.; Hsu H.-C.; Shih C.-M.; Yang C.-C.; Lue S. Surfactant-Assisted Perovskite Nanofillers Incorporated in Quaternized Poly (Vinyl Alcohol) Composite Membrane as an Effective Hydroxide-Conducting Electrolyte. Energies 2017, 10, 615. 10.3390/en10050615. [DOI] [Google Scholar]
- Shi Q.; He Y.; Bai X.; Wang M.; Cullen D. A.; Lucero M.; Zhao X.; More K. L.; Zhou H.; Feng Z.; Liu Y.; Wu G. Methanol tolerance of atomically dispersed single metal site catalysts: mechanistic understanding and high-performance direct methanol fuel cells. Energy Environ. Sci. 2020, 13, 3544–3555. 10.1039/d0ee01968b. [DOI] [Google Scholar]
- Knights S. D.; Colbow K. M.; St-Pierre J.; Wilkinson D. P. Aging mechanisms and lifetime of PEFC and DMFC. J. Power Sources 2004, 127, 127–134. 10.1016/j.jpowsour.2003.09.033. [DOI] [Google Scholar]
- BloombergNEF . Battery Pack Prices Fall As Market Ramps Up With Market Average at $156/kWh in 2019. 2019, https://about.bnef.com/blog/battery-pack-prices-fall-as-market-ramps-up-with-market-average-at-156-kwh-in-2019/ (accessed May 12, 2022).
- Mongird J.; Fotedar V.; Viswanathan V.; Koritarov V.; Balducci P.; Hadjerioua B.; Alam J.. Energy Storage Technology and Cost Characterization Report. PNNL-28866; Pacific Northwest National Laboratory, 2019; p 120.
- Whittingham M. S. Lithium Batteries and Cathode Materials. Chem. Rev. 2004, 104, 4271–4302. 10.1021/cr020731c. [DOI] [PubMed] [Google Scholar]
- Argonne National Laboratory . BatPaC: Battery Manufacturing Cost Estimation. https://www.anl.gov/tcp/batpac-battery-manufacturing-cost-estimation (accessed May 12, 2022).
- Battelle Memorial Institute . Manufacturing Cost Analysis of 1, 5, 10 and 25 kW Fuel Cell Systems for Primary Power and Combined Heat and Power Applications; U.S. Department of Energy, 2017; p 293. [Google Scholar]
- Ramsden T.; Kurtz J.; Sprik S.; Dinh H.; Ainscough C.. IX.1 Direct Methanol Fuel Cell Material Handling Equipment Demonstration; National Renewable Energy Laboratory, 2013; p 4. NREL/TP-5600-56408. [Google Scholar]
- Eudy L.; Post M.. Fuel Cell Buses in U.S. Transit Fleets: Current Status 2020; National Renewable Energy Laboratory, 2021; p 57. NREL/TP-5400-75583. [Google Scholar]
- Guerra O. J.; Eichman J.; Kurtz J.; Hodge B.-M. Cost Competitiveness of Electrolytic Hydrogen. Joule 2019, 3, 2425–2443. 10.1016/j.joule.2019.07.006. [DOI] [Google Scholar]
- Bristowe G.; Smallbone A. The Key Techno-Economic and Manufacturing Drivers for Reducing the Cost of Power-to-Gas and a Hydrogen-Enabled Energy System. Hydrogen 2021, 2, 273–300. 10.3390/hydrogen2030015. [DOI] [Google Scholar]
- Al-Qahtani A.; Parkinson B.; Hellgardt K.; Shah N.; Guillen-Gosalbez G. Uncovering the true cost of hydrogen production routes using life cycle monetisation. Appl. Energy 2021, 281, 115958. 10.1016/j.apenergy.2020.115958. [DOI] [Google Scholar]
- Li X. J.; Allen J. D.; Stager J. A.; Ku A. Y. Paths to low-cost hydrogen energy at a scale for transportation applications in the USA and China via liquid-hydrogen distribution networks. Clean Energy 2020, 4, 26–47. 10.1093/ce/zkz033. [DOI] [Google Scholar]
- Wang Y.; Yuan H.; Martinez A.; Hong P.; Xu H.; Bockmiller F. R. Polymer electrolyte membrane fuel cell and hydrogen station networks for automobiles: Status, technology, and perspectives. Adv. Appl. Energy 2021, 2, 100011. 10.1016/j.adapen.2021.100011. [DOI] [Google Scholar]
- Peters T.; Caravella A. Pd-Based Membranes: Overview and Perspectives. Membranes 2019, 9, 25. 10.3390/membranes9020025. [DOI] [PMC free article] [PubMed] [Google Scholar]
- Nazir H.; Muthuswamy N.; Louis C.; Jose S.; Prakash J.; Buan M. E.; Flox C.; Chavan S.; Shi X.; Kauranen P.; Kallio T.; Maia G.; Tammeveski K.; Lymperopoulos N.; Carcadea E.; Veziroglu E.; Iranzo A.; Kannan A. M. Is the H2 economy realizable in the foreseeable future? Part II: H2 storage, transportation, and distribution. Int. J. Hydrogen Energy 2020, 45, 20693–20708. 10.1016/j.ijhydene.2020.05.241. [DOI] [PMC free article] [PubMed] [Google Scholar]
- Borup R.; Weber A.. FC135: FC-PAD: Fuel Cell Performance and Durability Consortium; DOE Hydrogen and Fuel Cells Program Review: Washington D.C., 2019. [Google Scholar]
- Li X.Stationary Direct Methanol Fuel Cells Using Pure Methanol; DOE Hydrogen and Fuel Cells Program Review: Washington D.C., 2021. [Google Scholar]
- Miao Z.; Hu B.; He Y.-L.; Xu J.; Li X. A Liquid–Vapor Two-Phase Model of Direct Methanol Fuel Cells With Platinum Group Metal-Free Cathode Catalyst. J. Electrochem. Energy Convers. Storage 2021, 18, 040904. 10.1115/1.4051209. [DOI] [Google Scholar]
- California Air Resources Board . 2019 Annual Evaluation of Fuel Cell Electric Vehicle Deployment & Hydrogen Fuel Station Network Development, 2019, p 78.
- Xu C.; Faghri A.; Li X.; Ward T. Methanol and water crossover in a passive liquid-feed direct methanol fuel cell. Int. J. Hydrogen Energy 2010, 35, 1769–1777. 10.1016/j.ijhydene.2009.12.055. [DOI] [Google Scholar]
- Pei P.; Wu Z.; Li Y.; Jia X.; Chen D.; Huang S. Improved methods to measure hydrogen crossover current in proton exchange membrane fuel cell. Appl. Energy 2018, 215, 338–347. 10.1016/j.apenergy.2018.02.002. [DOI] [Google Scholar]