

Abstract

A volumetric system was used to assess carbon-based adsorbents for evaluation of the gas separation, equilibrium, and kinetics of oxygen (O2), nitrogen (N2), and carbon dioxide (CO2) adsorption on granular activated carbon (GAC) and functionalized GAC at 298, 308, and 318 K under pressures up to 10 bar. The effects of ZnCl2, pH, arrangement of the pores, and heat-treatment temperature on the adsorptive capabilities of O2, N2, and CO2 were evaluated. High-performance O2 adsorption resulted with a fine sample (GAC-10-500) generated with a 0.1 wt % loading of ZnCl2. The optimal sample structure and morphology were characterized by field-emission scanning electron microscopy, Fourier transform infrared spectroscopy, and powder X-ray diffraction. On the basis of the adsorption–desorption results, the fine GAC provides a surface area of 719 m2/g. Moreover, it possessed an average pore diameter of 1.69 nm and a micropore volume of 0.27 m3/g. At 298 K, the adsorption capacity of the GAC-10-500 adsorbent improved by 19.75% for O2 but was not significantly increased for N2 and CO2. Isotherm and kinetic adsorption models were applied to select the model best matching the studied O2, N2, and CO2 gas uptake on GAC-10-500 adsorbent. At 298 K and 10 bar, the sip isotherm model with the highest potential adsorption difference sequence and gas adsorption difference compared with pure GAC adsorbent as O2 > N2 > CO2 follows well for GAC-10-500. Eventually, the optimal sample is more effective for O2 adsorption than other gases.
1. Introduction
Gas separation process technology is used in a wide range of industrial sectors, including chemical, petroleum, power generation, medical, and food. Pressure swing adsorption (PSA) is among the most cost-effective choices for air separation processes in response to industrial requirements for nitrogen and oxygen separation and purification.1−4 Researchers have been using the PSA method as a more efficient separation approach in air separation in recent years because the PSA process is typically more affordable than other separation processes (cryogenic and membrane technologies).2,3 PSA is a type of green technology that is extensively utilized nowadays, in particular as a low-cost and energy-saving air separation system.5−7 Gas separation research has largely concentrated on PSA from solid adsorbents, which are desirable targets because of their low energy cost.8,9 In comparison with cryogenic technologies, PSA technology can generate 99–99.5% pure nitrogen at a far lower energy cost.10 Low pressure and ambient temperature are typical operating conditions for this technique.2,10
To obtain the optimum economic circumstances, oxygen adsorption utilizing the PSA method for nitrogen production in process plants and hypoxic air production for fire prevention in the enclosed areas has been continued across the world by researchers.11 One of the specific applications of air separation technology in power-plant industries is oxyfuel, which is one of the possibilities for lowering carbon dioxide production from combustion chamber output. As shown in Figure 1, electricity and heat generation represented 41% of worldwide CO2 emissions; consequently, decarbonization of the power industry is essential for reducing emissions. Figure 1 depicts the emission sources and capture strategies.12 Carbon capture and sequestration (CCS) can also be combined with bioenergy production, possibly allowing for net CO2 separation from the atmosphere in a process known as bioenergy with carbon capture and sequestration (BECCS). The highest percentage of CO2 emissions by sector is attributed to oxyfuel combustion and direct air capture (DAC). Oil, gas, and other industries generate 24% of CO2 emissions, and thus, there are several chances for decarbonization in the wide media of the industrial sector. Eventually, the CO2 DAC method can be used as a technique for reducing negative emissions. Figure 1 shows that air separation using the oxyfuel method is one of the most effective ways to reduce CO2.13 Researchers have used a variety of adsorbents to separate oxygen from air using a fixed-bed adsorption process. The adsorbent materials community can play a certain role in these efforts through the development of new technologies for efficient air separation. The most widely utilized adsorbent materials in gas separation processes are zeolites, metal–organic frameworks (MOFs), activated carbon (AC), carbon molecular baskets (CMBs), and carbon molecular sieves (CMS).2,14−17 CMS, carbon nanotubes, graphene, granular activated carbon (GAC), and fullerenes are examples of carbon-based adsorbents that are suitable for gas adsorption and are classified by shape, porosity, and structure.18−23
Figure 1.

Emission sources and capture strategies.12
GAC (activated carbon in granular form) is a synthetic carbon material with a three-dimensional structure and high specific surface area. It is mostly made up of carbon (the carbon content ranges from 87 to 97%). It is a nontoxic, safe, and effective adsorbent material that is simple to manufacture, use, and recycle in large-scale industries. The good suitability of GAC is due to its tunable porosity, ease of regeneration, low cost, and well-developed porous structure.24,25 Carbon’s adsorptive characteristics were well-understood even before the term “activated carbon” was used.26 One of the most significant characteristics is sorption capacity, which is directly dictated by the pore size distribution and is also highly impacted by surface functionalization.27 Because of its neutral porous carrier ability, GAC may distribute chemicals over its vast hydrophobic interior surface, making it accessible to reactants.24,28 Nowadays, GAC modification research is becoming more popular. GACs have long been known to be effective in capturing CO2 and other gases.29,30 Physical and chemical characteristics have been the focus of recent studies.24,31,32 Direct biomass carbonization produces carbons with low specific surface areas or even nonporous carbons, which are inefficient for gas capture.29
On the basis of adsorption experiments, which have been described in recent reviews, after activation treatments with various activators such as KOH, K2CO3,33 and others, GACs display high specific surface areas and large pore volumes.28,34,35 GAC has been used in fixed-bed systems in many water and wastewater treatment plants because of its robust structure and great resistance to attrition and wear.25 Furthermore, available commercially GACs have been used more frequently for removal of organics.36 Nevertheless, they may be adapted to individual gas separations using a variety of physical and chemical modification techniques.37,38 Furthermore, for larger-scale O2, N2, and CO2 gas adsorption, the lack of suitable adsorbents with sufficient adsorption capacity and selectivity remains a major issue. The adsorbate and adsorbent materials play a role in the gas separation mechanism, with equilibrium and kinetic separation contributing to different extents.39 Adsorption isotherm data for prospective adsorbents of each gas are useful for designing adsorptive cyclic processes to achieve equilibrium separation, and consistent adsorption isotherm information at different pressures and temperatures is also important in assessing gas separation performance.40
The present study proposed a functionalized commercial GAC for more efficient adsorption of O2 over N2 and CO2 in comparison with pure GAC. GACs were modified with ZnCl2 at 500 and 700 °C along with filtration using NaOH, and the effects of the pH, modification temperature, and weight percentage of ZnCl2 on the adsorption properties of the modified GAC were investigated. The morphology, structure, and chemical constitution of pure GAC and the resulting modified GAC were characterized by field-emission scanning electron microscopy (FESEM), Fourier transform infrared (FTIR) spectroscopy, and powder X-ray diffraction (XRD), and the impact of the treatment procedure on the morphology and porous texture of the material was also revealed by N2 adsorption–desorption investigations. Adsorption equilibrium and kinetics experiments on O2, N2, and CO2 were also performed to obtain the kinetics and adsorption capacity. It seems that interconnected porosities and a more alkaline surface can have a greater effect than the other parameters on the adsorption of nonacidic gases such as oxygen. Because of the more effective uptake of oxygen over other gases in comparison with pure GAC adsorbent under the same conditions, the modified GAC demonstrates significant promise as a functional sorbent for oxygen storage and separation that may be beneficial in the air separation industries.
2. Experimental Section
2.1. Materials
All of the chemicals and reagents used in this research were analytical grade and were used as provided without further purification. GAC manufactured by Jacobi Co. was purchased for the carbon-based adsorbent. Hydrochloric acid (37%), NaOH, and ZnCl2 were purchased from Dr. Mojallali Company (Tehran, Iran), and O2 (99.99%), N2 (99.99%), and CO2 (99.99%) were provided by Hamta Gas Company (Tehran, Iran).
2.2. Preparation of Functionalized Activated Carbon
For the preparation of modified GAC, before the impregnation process, raw GAC was sieved to sizes ranging from 20 to 40 mesh, washed with distilled water several times to remove the impurities, and dried overnight in an oven at 90 °C to remove moisture. Thereafter, 5 g of raw GAC was added to a ZnCl2 solution containing 10 or 15 g of ZnCl2 (1:2 or 1:3 ratio) and 50 mL of deionized water. The mixture was stirred for 3 h at 85 °C. Subsequently, the sample was dried in an oven for 24 h at 90 °C. The above mixture was placed in a tubular electric furnace under an atmosphere of N2, carbonized at 500 and 700 °C (heating rate = 5 °C min–1), and maintained at the final temperature for 2 h. After cooling to room temperature, the obtained products were pickled with 1 M HCl to remove the excess reactants, and then filtration was applied using a mixture of 1 g of NaOH and 100 mL of deionized water until the pH of the solution reached about 8. The final samples were dried at 100 °C for 24 h and kept in a desiccator containing silica gel. Modified GACs derived at different temperatures and ratios are denoted as GAC-W-T where GAC represents modified GAC, W is the weight of ZnCl2, and T is the carbonization temperature.
2.3. Characterization
X-ray diffraction examination with Cu Kα radiation (λ = 1.54 Å) on a Bruker D8 Advance diffractometer was used to determine the structure of the functionalized GAC. Micromeritics ASAP2020 adsorption analyzers were used to evaluate the N2 adsorption–desorption isotherms at 77 K. Before the adsorption–desorption tests were performed, the materials were degassed to constant weight under dynamic vacuum conditions for 4 h at 180 °C. FTIR spectroscopy was performed on a PerkinElmer spectrometer in the range of 500–4000 cm–1 with KBr pallets. FESEM was performed on a Nanosem 450 microscope. Transmission electron microscopy (TEM) was performed on a Philips EM208S 100 kV microscope (Rastak lab). An Apera Instruments AI311 Premium Series PH60 pH meter was used to measure hydrogen ion activity in solutions.
2.4. Experimental Adsorption Measurements
To assess the sorbent’s adsorption/desorption capability using the volumetric technique, a fixed-bed adsorption reactor was established as illustrated in Figure 2. Pure O2, N2, and CO2 were utilized as feeds in the tests to investigate the sorbent surface’s adsorption capability. Every experiment was carried out with 1 g of sorbent in a fixed-bed reactor that was sealed. N2 gas purging at 380 K for 30 min via the fixed-bed reactor was employed before the start of the experiment. The tests were carried out for 60 min at temperatures of 298, 308, 318, and 328 K at pressures ranging from 1.9 to 10 bar. The pressure and temperature of O2, N2, and CO2 were balanced in the passage thanks to the mixing tank, and the stable gas was then delivered to the adsorbent reactor. The adsorption parameters were calculated from the pressure difference recorded at a constant temperature using pressure–temperature sensors and a computer panel over time. For the temperature stabilizers, electrical heat tracing with a process control system was employed.
Figure 2.

Schematic of the experimental setup for gas adsorption.
3. Results and Discussion
3.1. Characterization Analysis
The adsorption capacity of porous materials is known to be significantly proportional to the number of adsorption sites. To evaluate the porous characteristics of the prepared samples, nitrogen gas adsorption/desorption measurements were performed (see Figure 3a). The detailed textural properties of instances are also summarized in Table 1. The isotherms were horizontal across a large pressure range and lacked apparent hysteresis loops (related to N2 condensation of capillaries), suggesting that they were type I isotherms (IUPAC classification). The nitrogen adsorption capacities of all of the products increase rapidly in the low relative pressure zone (0 < P/P0 < 0.2) and then steadily increase with increasing relative pressure before attaining an almost constant value at roughly P/P0 = 0.95. As a result, the modified samples were microporous with pore-size distribution curves below 2 nm (see Figure 3b).41,42 Because the porous structure of these materials is nearly exclusively made up of micropores, the samples had relatively low N2 adsorption capacities, as predicted. The diffusion of N2 molecules into micropores is sluggish at cryogenic temperatures. As a result, the value of SBET derived from the N2 adsorption isotherm for GAC-10-500 became lower than the others (719.13 m2/g) because of the lower average pore diameter (1.69 nm).43 After modification, the pore size was slightly reduced, which might be due to Zn2+ deposition on the GAC-10-500 surface or complex formation with accessible modification groups caused by NaOH, which donates a lone pair of electrons through a coordinate bond.44 The existence of both micropores and mesopores was further verified by the pore size distribution curves, which showed the porosity to be hierarchical. The peaks of the distributions for all samples were centered at 1.8 nm using the Barrett–Joyner–Halenda (BJH) technique.45 Ion exchange and gas diffusion were aided by the microporous structure and high specific surface area. Aspects like the loading rate and heating temperature do not appear to have much of an impact on the structure change, but characteristics like the structure’s eventual pH and how the pores connect (interconnected skeleton) are crucial in the gas adsorption.18
Figure 3.

(a) N2 adsorption/desorption isotherms, (b) BJH analyses (pores smaller than 2 nm), (c) XRD patterns, and (d) FTIR spectra of GAC-pure and modified GAC samples.
Table 1. Textural Characteristics of Granular Activated Carbon (GAC) Samples in Detail.
| sample name | specific surface area (m2/g) | average pore diameter (nm) | total pore volume (cm3/g) | mesoporous volume (cm3/g) | microporous volume (cm3/g) | pH |
|---|---|---|---|---|---|---|
| GAC-pure | 921.09 | 1.80 | 0.41 | 0.05 | 0.36 | 4.1 |
| GAC-10-500 | 719.13 | 1.69 | 0.31 | 0.04 | 0.27 | 8.8 |
| GAC-10-700 | 1001.8 | 1.81 | 0.45 | 0.06 | 0.39 | 7.4 |
| GAC-15-500 | 997.19 | 1.82 | 0.46 | 0.06 | 0.40 | 7.6 |
| GAC-15-700 | 921.48 | 1.77 | 0.40 | 0.07 | 0.33 | 7.5 |
The crystal structure of the GACs was investigated by XRD. As can be observed in Figure 3c, the development of turbostratic carbon with structure order intermediate among amorphous and crystalline graphite is readily visible in the XRD plots.46 The XRD patterns for all of the samples just depict two broad diffraction peaks at 2θ = 22° and 2θ = 42°, which belong to the (002) and (101) diffraction patterns of the honeycomb lattice, respectively. These peaks imply that the produced GACs are amorphous graphitic carbon that has been randomly stacked by a carbon plate and may be used to construct an adsorption gap.47,48 It is clear that with increased heating temperature of the samples, the graphitization of the samples increased. The narrowing and intensification of the peaks confirm greater translational ordering in the GAC-700 samples. It also appears that raising the ZnCl2 to GAC ratio results in a slight reduction in crystallinity. This might be due to insufficient reaction of the ZnCl2 with the samples.49 The GAC-700 samples have a higher graphitization degree than the GAC-pure sample because of proper carbon layer rearrangement caused by exothermic ZnCl2 modification.42,50 Increased crystallinity appears to reduce communication pathways such as interconnected porosity for the transport of gas molecules, thereby reducing the gas uptake. Moreover, as can be seen, the absence of any sharp peak indicates that no leftover inorganic residues remained in the samples after acid pickling and alkaline washing.51
FTIR analysis is a powerful method for characterizing functional groups and the chemical bonds on the surface of the modified GACs. The FTIR transmission spectra of the prepared samples are shown in Figure 3d. In the IR spectra of the modified instances, the observed broadening of the stretching vibration peak of phenolic or alcoholic hydroxyl (−OH) groups related to intermolecular hydrogen was detected at 3490 and 3100 cm–1. The presence of “free” hydroxyl groups and O–H bonds in carboxylic acids was demonstrated by O–H stretching vibrations that occurred across a wide frequency range. As a result of the pickling by NaOH, such large broad peaks indicated that the modified instances contained a lot more −OH than GAC-pure. Moreover, this peak implies that increasing the temperature from 500 to 700 °C led to a reduction in volatile and moisture content in the furnace. The existence of the C≡C (alkyne) stretching vibration is indicated by a peak at approximately 2355 cm–1. The C=O stretching vibrations of carbonyls and carboxylic groups were assigned to the peak with a value of 1700 cm–1. This oxygen-containing functional group acts as a π-electron acceptor. The peak shows that the two temperatures (500 and 700 °C) present relatively similar characteristics, but the bond corresponding to carboxylate groups is more intense for GAC-10-500 and GAC-15-500. The broad peak at 1500 cm–1 corresponds to the C–O stretching vibration.52−56 Furthermore, the peaks between 1438 and 1500 cm–1 are correlated to the vibration of C=C bonds. The structure of the aromatic C–H out-of-plane bending vibration is related to a peak at 800 cm–1. The surface of the modified samples is negatively charged because of an excess of oxygenated functional groups, such as phenolic and carboxylic acid groups. All of these functional groups have the potential to increase the gas adsorption capability.57,58
Field-emission scanning electron microscopy was used to acquire data on the products’ surface physical shape and structure. Figure 4 shows FESEM micrographs of (a–d) GAC-pure and (e–h) the fine functionalized sample GAC-10-500. The photos depict alterations in the surface topography of the ZnCl2- and NaOH-modified instances. The external surface of GAC-pure was smooth with no evident holes, and the pore form was not complete, as can be observed. The pore structure in GAC-10-500 showed developed porosity and an irregular cavity structure with a roughly heterogeneous structure after modification. Furthermore, modified GAC was proved to have a layer stacking structure. The voids appear to have been formed by ZnCl2 evaporation during calcination, which left the space that the ZnCl2 had previously occupied. Besides, it seems that the macroporous structure collapsed as a result of the modification, and some new pores were generated. It is also known that blind and closed porosity in GAC-pure was changed into interconnected porosity. The interconnected pores are suitable for gas molecule transfer, which increases gas capture.45,54,59 The TEM images (see Figure 4i,j), which show the creation of crystallinity in the porous skeleton, can be utilized to validate the structures of GAC-pure and GAC-10-500 on the 50–100 nm scale. For GAC-10-500, the existence of porosity with an interconnected and wormlike structure is obvious. The raw and modified samples appear to have almost identical structural orders, indicating less structural order and a greater inclination to be amorphous. Furthermore, both samples contain rather big particles with fractal-like shapes.60
Figure 4.


(a–h) FESEM micrographs of (a–d) GAC-pure and (e–h) modified GAC-10-500. (i, j) TEM micrographs of (i) GAC-pure and (j) modified GAC-10-500.
3.2. Adsorption Kinetic and Equilibrium Isotherms
Different pure and functionalized adsorbents (GACs) were used in the adsorption process. Equation 1 was used to calculate the equilibrium adsorption capacities (qe) of various adsorbents:
| 1 |
where Pinitial, Pe, V, M, R, T, Z, and w are the initial pressure, the equilibrium pressure, the volume of the reactor, the molecular weight of the gas (O2, N2, or CO2), the universal gas constant, the absolute temperature, the compressibility factor, and the mass of the adsorbent, respectively.
The compressibility factor was calculated using the Soave–Redlich–Kwong (SRK) equation of state, as shown by the following equations:
| 2 |
where
| 3 |
| 4 |
in which
| 5 |
where Tc, Tr, Pc, and ω are the critical temperature, the reduced temperature, the critical pressure, and the acentric factor, respectively.61,62
Equation 6 was used to calculate the correlation coefficient (R2), which was used to find the best-fitting models for the experimental data:
| 6 |
Where qmodel and qexp are the calculated gas adsorption capacity based on a particular model and the experimental adsorption capacity, respectively. Functionalized adsorbents (e.g., GAC-10-500) tend to adsorb more O2 than GAC-pure at 25 °C and various pressures, as demonstrated in Figure 5. Also, the detailed results at 35, 45, and 55 °C and various pressures are shown in Figures S1–S3.
Figure 5.

Comparison of (top to bottom) O2, N2, and CO2 equilibrium adsorption isotherms of GAC-pure, GAC-10-500, GAC-15-500, GAC-10-700, and GAC-15-700 samples at 25 °C.
Because the average pore size of GAC-10-500 (1.69 nm) is smaller, this suggests that these pores have a stronger potential to adsorb more O2 molecules. Furthermore, the pickling by NaOH revealed that the GAC-10-500 sample included much more −OH than GAC-pure as well as a higher pH than other samples, implying that this sample has a greater ability to adsorb more O2.
The gas adsorption processes of the GAC-10-500 sample are influenced by micropores, interconnected porosities, and the presence of −OH groups on the surface. According to the results, it is clear that the specific surface area does not play a significant role in gas adsorption. In addition, the weight percentage of ZnCl2 has little effect on the formation of new porosity. The physical and chemical composition of the adsorbents also impacts the mechanism, according to a review and study of the uptake kinetics. To investigate the kinetics, we used many theoretical kinetic models, including the pseudo-first-order, pseudo-second-order, Elovich, and fractional-order kinetic models (eqs 7–10):40
| 7 |
| 8 |
| 9 |
| 10 |
where qt is the adsorption capacity at time t, kf is the pseudo-first-order rate constant, ks is the pseudo-second-order rate constant, kn is the fractional-order rate constant, and α, β, n, and m are model parameters. The pseudo-first-order model depicts reversible adsorption with equilibrium at the adsorbent surface, while the pseudo-second-order kinetic model uses the chemisorption process as an adsorption-regulating element. The fractional-order kinetic model depicts physical and chemical adsorption at the same time. Because forecasting kinetic parameters is difficult, a standard technique includes adjusting experimental data to a collection of stated models and selecting one of the better alternatives. Table S1 displays the kinetic parameters, and the best-fit model was determined on the basis of R2 values ranging from 0.8648 to 0.9988 over the temperature range from 298 to 328 K at a pressure of 6 bar.
The model findings were also plotted against the experimental data to define the best kinetic model for O2, N2, and CO2 gas adsorption, and the sorbent kinetic curves are presented in Figure 6. Indeed, Figure 6 indicates that the experimental data did not completely suit the pseudo-first-order kinetic model, but the fractional-order and pseudo-second-order models were more proportional.63−65
Figure 6.

O2, N2, and CO2 gases adsorption capacities of the GAC-10-500 and corresponding fit desirable kinetic models at 308 K and 6 bar.
The fractional-order kinetic model was found to be more suited for describing the adsorption kinetics on the basis of the kinetic parameters obtained from Table S1. Furthermore, at 298 K and 6 bar for O2, N2, and CO2 gas adsorption, the R2 values for the fractional-order model varied from 0.8648 to 0.9974, suggesting that this model was well-matched.
Figure 7 shows the adsorption isotherms based on the Freundlich, Dubinin–Radushkevich (D–R), Temkin, and Sips models at 298 K for pressures ranging from 1.9 to 10 bar. These four isotherm models are given by eqs 11–14:
| 11 |
| 12 |
| 13 |
| 14 |
where qe and qm are the equilibrium and maximum adsorption capacities, respectively, of O2, N2, or CO2 (mmol/g); kF, Pe, and n are the Freundlich model constant (mmol g–1 bar–1/n), equilibrium pressure (bar), and Freundlich isotherm constant, respectively; λ and ω are the D–R model constant (mol2/J2) and Polanyi potential (KJ/mol), respectively; A is the Temkin model constant (L/mol); B is equal to RT/bT, where bT is the Temkin isotherm constant (J/mol); Ce is the equilibrium concentration of the adsorbate; b is the Sips model adsorption affinity (bar–1); and P is the adsorbate pressure (bar). Table S2 shows the experimentally determined values of the isotherm parameters and the corresponding R2 values for all of the isotherm models.
Figure 7.

Comparison of isotherm models and experimental data for adsorption of O2, N2, and CO2 on GAC-10-500 at 308 K.
The physical adsorption behavior was shown by a reduction in kF, whereas the pressure- and temperature-dependent O2, N2, and CO2 gas adsorption behavior was disclosed by an increase in qm.40 As the temperature was raised, the qe values fell, showing exothermic adsorption of O2, N2, and CO2. The competition to access the restricted adsorption sites grows as the adsorption temperature rises. As a result, the repulsions between molecules increase, resulting in a decrease in the amount of adsorption. The experimental results matched well with all of the isotherm models, although the Sips isotherm model had the highest R2 values.
For distinguishing the issue of the continued growth in the amount absorbed with rising restricted pressure, the Sips model offers an equation comparable to the Freundlich model.66 Moreover, two isotherm models created by D–R and Temkin, in which ω gives the mean adsorption free energy and bT gives the heat of adsorption, offer advantageous data allocated to the energy parameters. Average ω results in the 1–3.8 kJ/mol range indicate typical physisorption of O2, N2, and CO2.
On the basis of the findings in Table S2, the Freundlich constant n, within the range of 0.8 to 1.4, demonstrates the attractiveness of physisorption. According to the results, the adsorption process is multilayer, with O2, N2, and CO2 gas adsorbed and interpenetrated in the surface and interior layers of the adsorbent. More efficient contact sites are preferred in the Sips model, implying that the surface of the GAC is heterogeneous and that multilayer O2, N2, and CO2 gas sorption is caused by a nonhomogeneous spread of energy-inactive sites.21,22,40,67 Moreover, the Sips isotherm model was shown to be more adequate for describing the adsorption isotherm on the basis of the R2 values from Table S2. The Sips model successfully matched for O2, N2, and CO2 gas adsorption from 298 to 328 K at 6 bar, with R2 values ranging from 0.9995 to 1. The stabilities of the specified isotherm models in the illustration and prediction of adsorption behavior were ordered as Sips > Freundlich > D–R > Temkin, as determined by the R2 values in Table S2.21,40
3.3. Adsorption Thermodynamic and Isosteric Enthalpy Analysis
The free energy (ΔG°), enthalpy (ΔH°), and entropy (ΔS°) of adsorption were computed using the following equations:
| 15 |
| 16 |
| 17 |
| 18 |
where Kd is the distribution coefficient. On the basis of eq 18 (the van’t Hoff equation), the slopes and cutoffs of the plots of ln Kd versus 1/T over the temperature range from 298 to 328 K (Figure 8) were used to compute the values of ΔH° and ΔS°, respectively, and eqs 15 and 16 were used to determine the standard Gibbs free energy of adsorption (ΔG°).68Table 2 shows the computed values of the O2, N2, and CO2 thermodynamic parameters. The physisorption process is indicated by a ΔH° value less than 20 kJ/mol, and the chemisorption process is indicated by a ΔH° value greater than 40 kJ/mol. ΔSo is a representation of the randomness of the gas–solid interface, where ΔSo > 0 indicates more randomness and ΔSo < 0 indicates less randomness.69,70 The ΔH° and ΔG° values are negative, indicating that the adsorption mechanism is exothermic and spontaneous, respectively, which is consistent with the adsorption results.
Figure 8.

O2, N2, and CO2 experimental van’t Hoff plots for GAC-10-500.
Table 2. Detailed Thermodynamic Parameters of GAC-10-500 in O2, N2, and CO2 Gas Adsorption at 6 bar.
| ΔG° (kJ/mol) |
||||||
|---|---|---|---|---|---|---|
| gas | ΔH° (kJ/mol) | ΔS° (kJ mol–1 K–1) | 298 K | 308 K | 318 K | 328 K |
| O2 | –13.962 | –0.024 | –6.734 | –6.491 | –6.249 | –6.007 |
| N2 | –13.586 | –0.025 | –6.049 | –5.797 | –5.544 | –5.291 |
| CO2 | –17.972 | –0.035 | –7.671 | –7.326 | –6.980 | –6.635 |
The Clausius–Clapeyron equation (eq 19) was used to determine the isosteric enthalpy of adsorption (Qst) from the temperature dependence of the equilibrium capacity:71
| 19 |
Qst is independent of the amount adsorbed when the surfaces are energetically homogeneous and the adsorbed molecules do not interact and are independent of the adsorption rate.72 If variable surface energies on the adsorbent surface exist or if interactions between adsorbed molecules arise, fluctuations in Qst with coverage can be seen.73 Because the oxygen molecules prefer to bind to locations with higher potential and because the carbon surface is rarely energetically homogeneous, Qst decreases as the adsorption amount increases, as illustrated in Figure 9. The values of Qst obtained for adsorption of O2 on both GAC-pure and GAC-10-500 samples (<80 kJ mol–1) suggest that the O2 adsorption is physical, and the negative slopes in Figure 9 reveal that the adsorption process is exothermic. As the adsorption process progresses, the GAC pores fill up, resulting in a weaker interaction between the GAC adsorbent and the oxygen molecules, decreasing Qst This process demonstrates that when the adsorption rate rises, the isosteric enthalpy of adsorption does not change.40 Since GAC-10-500 has a smaller surface area than GAC-pure, the molecules have a better probability of becoming adsorbed on the carbon surface. GAC-10-500 had a higher adsorption affinity for molecules than GAC-pure when it came to O2 gas adsorption.
Figure 9.
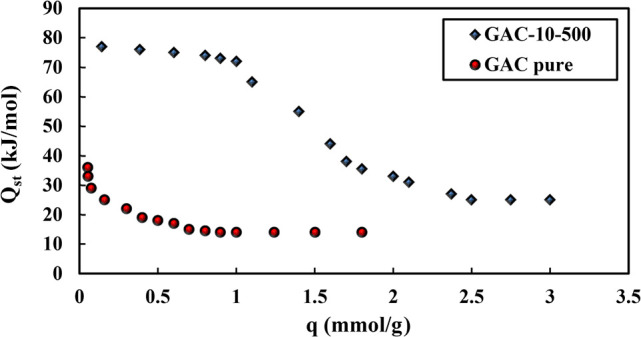
Comparison of O2 gas adsorbed vs the isosteric enthalpy change of adsorption for GAC-pure and GAC-10-500 samples.
3.4. Adsorption Performance
Figure 10 shows the effect of temperature on the O2, N2, and CO2 gas adsorption capabilities of GAC-pure and GAC-10-500 obtained at 6 bar for 90 min using an adsorption experimental setup. As can be seen, increasing the temperature from 298 to 328 K decreased the O2, N2, and CO2 gas adsorption capacities of GAC-10-500, with the greatest adsorption capacity of gases occurring at 298 K. The first thing to note is the shape of the data. Figure 10 shows that the adsorption of N2 and CO2 does not change in going from the pure GAC to the functionalized adsorbent, so the GAC-10-500 capacity values are comparable to those for GAC-pure, which is very interesting. The next point to be noted from these findings is that O2 has a higher potential to be adsorbed compared with N2 and CO2 under the same conditions, resulting in a higher capacity of O2 gas adsorption for GAC-10-500 compared with GAC-pure.74 Additionally, the analysis revealed that the adsorption of O2, N2, and CO2 gases is exothermic and that raising the temperature decreases O2, N2, and CO2 adsorption capability. Figure 11 depicts the influence of the equilibrium pressure on the adsorbent on the adsorption capabilities of O2, N2, and CO2 at a temperature of 308 K. As per the findings, raising the pressure has a significant impact on O2, N2, and CO2 adsorption, and the functionalized adsorbent’s adsorption capacity has risen by 19.75, 10.1, and 3.3%, respectively. At adsorption process conditions of 10 bar and 298 K, the highest adsorption capacities of O2, N2, and CO2 gases on GAC-10-500 are 5.57, 3.63, and 6 mmol/g, respectively.
Figure 10.

Effect of temperature on the O2, N2, and CO2 adsorption capacities of (a–c) GAC-pure and (a1–c1) GAC-10-500 at 6 bar for 90 min.
Figure 11.

Effect of pressure on the O2, N2, and CO2 adsorption capacities of the (a–c) GAC-pure and (a1–c1) GAC-10-500 at 308 K for 90 min.
When a selective adsorption process is utilized, the shape and size of the adsorbent pores are the most essential parts. As previously stated, the existence of both micropores and mesopores was further confirmed by the hierarchical pore size distribution curves. Because of an abundance of oxygenated functional groups, such as phenolic and carboxylic acid groups, the surface of the GAC-10-500 sample is negatively charged, and functional groups have the potential to boost O2 gas adsorptive capability. The rate of adsorption is influenced by the carbon-based adsorbate electrical properties, such as dipole/quadrupole moment and/or polarizability. The mentioned parameter is affected by the kinetic diameter, molecular size, and structure of N2 and O2. GAC-10-500 tends to adsorb more O2 than N2 and CO2 in functionalized adsorbents compared with GAC-pure at a given temperature and pressure, as illustrated in Figures 10 and 11. This suggests that these holes have a larger potential to absorb more oxygen due to the number of micropores. The size of a molecule as a target is related to its kinetic diameter in a gas. O2 and N2 have kinetic diameters of 3.46 and 3.64 Å, respectively.40,75,76 From a kinetic aspect, O2 has a somewhat smaller effective kinetic diameter than N2 within adsorbents. As a consequence, diffusion of O2 through sorbent meso- and microholes can be faster than N2 diffusion, specifically when the adsorbent contains pores that are somewhat homogeneous in size and near the kinetic diameter of N2.43 Second, because nitrogen and oxygen molecules travel through the selected pores longitudinally, losing rotational flexibility, they have a form factor that will likely affect the adsorption kinetics.23 As is widely known, the quadrupole moment of N2 is almost 4 times that of O2, resulting in greater N2 adsorption. As a result, N2 interacts more strongly with the sorbent’s electric field gradients than O2 does. Nevertheless, on the basis of the obtained data, it is clear that this factor has no bearing on the rate of gas adsorption on activated carbon.74 Since N2 molecules are diamagnetic, dipolar fields of paramagnetic O2 molecules exhibit superior adsorption at very high pressures. This is due to the fact that at extremely high pressures, the electron spin resonance of the N2 molecule does not change.77
3.5. Regeneration of GAC-10-500
Reuse of the adsorbent is an economic objective and one of the most important perspectives. The regeneration process for 1 g of GAC-10-500 adsorbent was measured at a pressure of less than 1.7 bar. Twenty adsorption cycles at 298 K and 6 bar were performed for the O2, N2, and CO2 gas adsorption operation, and the adsorbent was regenerated in a vacuum oven at 420 K for 5 h. The adsorbent potential did not vary significantly after each cycle, as can be seen in Figure 12. The sorbent’s adsorption performance decreased from 100% to 97% after 20 cycles. On the basis of the results of the regeneration process, GAC-10-500 could be used in industrial gas adsorption applications as a low-cost and high-value adsorbent.
Figure 12.

Recycling performance of GAC-10-500 for O2, N2, and CO2 gas adsorption.
3.6. Comparison of Effectiveness of Functionalized GACs versus Various ACs
Table 3 compares the adsorption capacities of the functionalized GAC-10-500 employed in this work with those of a range of different commercial adsorbents previously used for adsorption of O2, N2, and CO2 gases. From the comparison of GAC-10-500 with other published AC and CMS adsorbents, it is clear that GAC-10-500 has a higher O2 adsorption capability. GAC-10-500 has much better adsorption capabilities than many other previously reported industrial AC and CMS adsorbents. The findings of this study may be used to create a newer GAC adsorbent that is both effective and high-performing, allowing for increased O2 gas adsorption.
Table 3. Comparison of the O2, N2, and CO2 Adsorption Capacities of GAC-10-500 (Functionalized GAC) versus Other AC and CMS Works.
| adsorbent | manufacturer | T (K) | P (kPa) | qm (mmol/g) | Qst (kJ/mol) | isotherm model | kinetic model | ref |
|---|---|---|---|---|---|---|---|---|
| O2 | ||||||||
| CMS 3A | Takeda | 273–323 | 1300 | 1.37–2.32 | 18 | Langmuir | isothermal diffusion | (78) |
| 1.74–2.66 | – | VSMa | ||||||
| CMS 5A | Takeda | 273–323 | 1300 | 1.64–2.78 | 15.5 | Langmuir | ||
| 2.23–2.85 | – | VSM | ||||||
| CMS | Bergbau-Forschung | 303 | 1300 | 1.62 | – | Langmuir | ||
| 1.74 | – | VSM | ||||||
| CMS 3A | Takeda | 293 | 75.73 | 0.266 | 17.5 | Langmuir | dual-resistance | (66) |
| 303 | 76.66 | 0.233 | 17.5 | Sips | ||||
| 313 | 67.19 | 0.174 | 17.5 | Toth | ||||
| CMS | Takeda | 293–313 | 1500 | 3.48–3.63 | 15.5 | Langmuir | volumetric | (79) |
| 4.55–4.83 | – | Langmuir–Freundlich | ||||||
| AC | Norit | 303 | 3150 | 5.82 | – | Langmuir | dual-resistance | (80) |
| AC | Kuraray | 293–323 | 1000 | 5.70 | 16.1 | DSLb | isothermal dual resistance | (40) |
| 5.17 | ||||||||
| CMS | 293–323 | 3.27 | 18.2 | Sips | ||||
| 2.89 | ||||||||
| GAC-10-500 | Jacobi | 298–328 | 1000 | 3.1–5.77 | 25 | Sips | fractional-order | this work |
| N2 | ||||||||
| CMS | Changxing Shanli Chemical Materials | 303–343 | 700 | 7.25 | 17.5 | MSLc | dual-resistance | (81) |
| 2.61 | 17.6 | Toth | ||||||
| CMS 3k | Takeda | 308 | 2000 | 10.6 | 15.93 | MSL | dual-resistance | (82) |
| CMS 3A | Takeda | 273–323 | 1300 | 1.68–1.97 | 13.5 | Langmuir | dual-resistance | (78) |
| 1.81–2.12 | ||||||||
| CMS 5A | Takeda | 303 | 1300 | 1.58–2.14 | – | VSM | ||
| 1.9–2.46 | ||||||||
| CMS | Bergbau-Forschung | 293–313 | 1300 | 1.48 | – | Langmuir | ||
| 1.59 | VSM | |||||||
| CMS 3A | Takeda | 293 | 70.53 | 0.263 | 23 | Langmuir | dual-resistance | (66) |
| 303 | 66.93 | 0.204 | 22 | Sips | ||||
| 313 | 75.33 | 0.195 | 22 | Toth | ||||
| CSM | Takeda | 293–323 | 1500 | 2.55–3.11 | 25.1 | Langmuir | – | (79) |
| 3.4–4.63 | – | Langmuir–Freundlich | ||||||
| AC | Kuraray | 398–318 | 1000 | 3.18–3.45 | 18.2 | Langmuir | dual-resistance | (83) |
| 3.71–4.29 | – | Sips | ||||||
| 4.61–5.6 | – | Toth | ||||||
| AC | Kuraray | 293–323 | 1000 | 3.93 | 16.5 | DSL | isothermal dual resistance | (40) |
| 2.89 | – | |||||||
| CMS | 2.44 | 16.5 | Sips | |||||
| 2.21 | – | |||||||
| CMS | Kuraray | 293–323 | 1000 | 1.72–1.99 | – | Langmuir | isothermal diffusion | (73) |
| 1.71–2.2 | 16 | Sips | ||||||
| CMS A | Air Products and Chemicals Inc., US | 303 | 101.3 | 0.325 | – | Langmuir | non-isothermal | |
| CMS 3A | Takeda | 303 | 623 | 0.217 | – | Langmuir | ||
| CMS 3A | Takeda | 303 | 825 | 1.194 | – | Langmuir | ||
| CMS 3A | Takeda | 293 | 601 | 0.284 | – | Sips | non- isothermal | |
| CMS 3K | Takeda | 298 | 101.3 | 1.37 | – | |||
| CMS-131510 | Shanli Chemical | 303 | 701.7 | 1.115 | – | |||
| GAC-10-500 | Jacobi | 298–328 | 1000 | 2.5–3.6 | 12.9 | Sips | fractional-order | this work |
| CO2 | ||||||||
| CMS A | Air Products and Chemicals Inc., US | 303 | 101.3 | 1.63 | 28 | Sips | – | (73) |
| CMS 3A | Takeda | 303 | 895 | 3.12 | – | Langmuir | linear driving force | (84) |
| CMS 3A | Takeda | 293 | 382 | 1.47 | 33 | Langmuir–Sips | non-isothermal | (85) |
| CMS 3A | Takeda | 343 | 996 | 1.08 | – | Langmuir | – | (86) |
| CMS 3A | Takeda | 293 | 191 | 2.45 | – | D–R | – | (87) |
| AC | Sud Chemie | 293 | 2068 | 8.5 | 11 | Langmuir | – | (88) |
| CMS 13X | Sud Chemie | 293 | 2068 | 5.2 | 10 | Langmuir | – | |
| CMS 4A | Sud Chemie | 293 | 2068 | 4.8 | – | Langmuir | – | |
| AC | Mahab zist | 293–358 | 1000 | 5.1–5.9 | – | Freundlich | Elovich and second-order | (21) |
| GAC-10-500 | Jacobi | 298–328 | 1000 | 4–6.3 | 14 | Sips | fractional-order | this work |
Vacancy solution model.
Dual-site Langmuir model.
Multisite Langmuir model.
5. Conclusions
In this research, GAC (manufactured by Jacobi Co.) was functionalized with ZnCl2 and used used for the adsorption of O2, N2, and CO2. Adsorption studies were carried out in the temperature range of 298 to 328 K at pressures of up to 10 bar for 90 min. On the GAC-10-500 adsorbent, the kinetics of O2, N2, and CO2 gas adsorption reflected the fractional-order kinetic model. After comparison of experimental adsorption effects by models, the Sips adsorption isotherm model was shown to be the best. At 298 K and 10 bar, the maximum adsorption potentials for O2, N2, and CO2 were determined to be 5.77, 3.6, and 6.3 mmol/g, respectively. The adsorption was spontaneous and exothermic on the basis of the negative thermodynamic parameters, and the magnitudes of these parameters suggested physisorption processes. The isosteric adsorption enthalpy (Qst) was calculated from the temperature-dependent equilibrium adsorption capacity using the Clausius–Clapeyron equation. This technique indicates that the isosteric enthalpy of an adsorption fine sample does not vary as O2 gas adsorption increases (25 kJ/mol). In terms of O2, N2, and CO2 adsorption, the GAC-10-500 adsorbent has a stronger affinity for O2 molecules than the GAC-pure adsorbent does. The amount of O2 uptake was higher in the functionalized GAC adsorbent than in the pure GAC adsorbent, and the amounts of N2 and CO2 adsorbed on the functionalized GAC adsorbent were not significantly different from that on the pure GAC adsorbent. Enhancing the positive surface charge (high pH), low average pore diameter, and interconnected structure were beneficial to the adsorption of O2. The adsorption effectiveness of GAC-10-500 was lowered from 100% to 97% after 20 cycles. Compared with other industrial AC and CMS adsorbents that have been investigated, the produced adsorbent might be promising for air separation technologies on the basis of the advanced adsorbents’ high-efficiency regeneration and high performance. The proposed approach offers a potential strategy for preparing high-performance GACs in semiscale and industrial procedures.
Supporting Information Available
The Supporting Information is available free of charge at https://pubs.acs.org/doi/10.1021/acsomega.2c00673.
Experimental gas adsorption equilibrium isotherms on the GAC-pure, GAC-10-500, GAC-15-500, GAC-10-700, and GAC-15-700 samples at various temperatures and calculated parameters of gas adsorption kinetic and isotherm models for adsorption of O2, N2, and CO2 on GAC-10-500 obtained at 298, 308, 318, and 328 K (PDF)
The authors declare no competing financial interest.
Supplementary Material
References
- Ferreira D.; Barcia P.; Whitley R. D.; Mendes A. Single-Stage Vacuum Pressure Swing Adsorption for Producing High-Purity Oxygen from Air. Ind. Eng. Chem. Res. 2015, 54 (39), 9591–9604. 10.1021/acs.iecr.5b02151. [DOI] [Google Scholar]
- Marcinek A.; Guderian J.; Bathen D. Process Intensification of the High-purity Nitrogen Production in Twin-bed Pressure Swing Adsorption Plants. Adsorption 2021, 27, 937–952. 10.1007/s10450-020-00291-8. [DOI] [Google Scholar]
- Reynolds S. P.; Ebner A. D.; Ritter J. A. Enriching PSA Cycle for the Production of Nitrogen from Air. Ind. Eng. Chem. Res. 2006, 45 (9), 3256–3264. 10.1021/ie0513550. [DOI] [Google Scholar]
- Santos J. C.; Cruz P.; Regala T.; Magalhães F. D.; Mendes A. High-Purity Oxygen Production by Pressure Swing Adsorption. Ind. Eng. Chem. Res. 2007, 46 (2), 591–599. 10.1021/ie060400g. [DOI] [Google Scholar]
- Zanota M. L.; Heymans N.; Gilles F.; Su B. L.; Frère M.; De Weireld G. Adsorption Isotherms of Pure Gas and Binary Mixtures of Air Compounds on Faujasite Zeolite Adsorbents: Effect of Compensation Cation. J. Chem. Eng. Data 2010, 55 (1), 448–458. 10.1021/je900539m. [DOI] [Google Scholar]
- Burdyny T.; Struchtrup H. Hybrid Membrane/Cryogenic Separation of Oxygen from Air for Use in the Oxy-Fuel Process. Energy 2010, 35 (5), 1884–1897. 10.1016/j.energy.2009.12.033. [DOI] [Google Scholar]
- Zhang N.; Lior N. Two Novel Oxy-Fuel Power Cycles Integrated with Natural Gas Reforming and CO2 Capture. Energy 2008, 33 (2), 340–351. 10.1016/j.energy.2007.09.006. [DOI] [Google Scholar]
- Bello G.; García R.; Arriagada R.; Sepulveda-Escribano A.; Rodrıguez-Reinoso F. Carbon Molecular Sieves from Eucalyptus globulus Charcoal. Microporous Mesoporous Mater. 2002, 56 (2), 139–145. 10.1016/S1387-1811(02)00465-1. [DOI] [Google Scholar]
- Epiepang F. E.; Yang X.; Li J.; Liu Y.; Yang R. T. Mixed-cation LiCa-LSX Zeolite with Minimum Lithium for Air Separation. AIChE J. 2018, 64 (2), 406–415. 10.1002/aic.16032. [DOI] [Google Scholar]
- Kirschner M. J.; Alekseev A.; Dowy S.; Grahl M.; Jansson L.; Keil P.; Lauermann G.; Meilinger M.; Schmehl W.; Weckler H.. Oxygen. In Ullmann’s Encyclopedia of Industrial Chemistry; Wiley, 2000. [Google Scholar]
- Jensen G.Hypoxic Air Venting for Protection of Heritage; Research Report in Support of COST Action 17, Built Heritage: Fire Loss to Historic Buildings; Riksantikvaren and Historic Scotland, 2006. [Google Scholar]
- Siegelman R. L.; Kim E. J.; Long J. R. Porous Materials for Carbon Dioxide Separations. Nat. Mater. 2021, 20 (8), 1060–1072. 10.1038/s41563-021-01054-8. [DOI] [PubMed] [Google Scholar]
- CO2 Emissions from Fuel Combustion 2019; International Energy Agency, 2019. [Google Scholar]
- Li X.; Zhang L.; Yang Z.; Wang P.; Yan Y.; Ran J. Adsorption Materials for Volatile Organic Compounds (VOCs) and the Key Factors for VOCs Adsorption Process: A Review. Sep. Purif. Technol. 2020, 235, 116213. 10.1016/j.seppur.2019.116213. [DOI] [Google Scholar]
- Yang X.; Epiepang F. E.; Li J.; Wei Y.; Liu Y.; Yang R. T. Sr-LSX Zeolite for Air Separation. Chem. Eng. J. 2019, 362, 482–486. 10.1016/j.cej.2019.01.066. [DOI] [Google Scholar]
- Jayaraman A.; Yang R. T.; Cho S.-H.; Bhat T. S. G.; Choudary V. N. Adsorption of Nitrogen, Oxygen and Argon on Na-CeX Zeolites. Adsorption 2002, 8 (4), 271–278. 10.1023/A:1021529328878. [DOI] [Google Scholar]
- Férey G. Hybrid Porous Solids: Past, Present, Future. Chem. Soc. Rev. 2008, 37 (1), 191–214. 10.1039/B618320B. [DOI] [PubMed] [Google Scholar]
- Mashhadimoslem H.; Safarzadeh M.; Ghaemi A.; Banna Motejadded Emrooz H.; Barzegar M. Biomass Derived Hierarchical Porous Carbon for High-Performance O2/N2 Adsorption; a New Green Self-Activation Approach. RSC Adv. 2021, 11 (57), 36125–36142. 10.1039/D1RA06781H. [DOI] [PMC free article] [PubMed] [Google Scholar]
- Kolbadinejad S.; Mashhadimoslem H.; Ghaemi A.; Bastos-Neto M. Deep Learning Analysis of Ar, Xe, Kr, and O2 Adsorption on Activated Carbon and Zeolites Using ANN Approach. Chem. Eng. Process. 2022, 170, 108662. 10.1016/j.cep.2021.108662. [DOI] [Google Scholar]
- Vafaeinia M.; Khosrowshahi M. S.; Mashhadimoslem H.; Motejadded Emrooz H. B.; Ghaemi A. Oxygen and Nitrogen Enriched Pectin-Derived Micro-Meso Porous Carbon for CO2 Uptake. RSC Adv. 2021, 12 (1), 546–560. 10.1039/D1RA08407K. [DOI] [PMC free article] [PubMed] [Google Scholar]
- Ghaemi A.; Mashhadimoslem H.; Zohourian Izadpanah P. NiO and MgO/Activated Carbon as an Efficient CO2 Adsorbent: Characterization, Modeling, and Optimization. Int. J. Environ. Sci. Technol. 2022, 19, 727–746. 10.1007/s13762-021-03582-x. [DOI] [Google Scholar]
- Andrade M.; Rodrigues S. C.; Mendes A. High Performing CMS Adsorbent for O2/N2 Separation. Microporous Mesoporous Mater. 2020, 296, 109989. 10.1016/j.micromeso.2019.109989. [DOI] [Google Scholar]
- Reid C. R.; O'koy I. P.; Thomas K. M. Adsorption of Gases on Carbon Molecular Sieves Used for Air Separation. Spherical Adsorptives as Probes for Kinetic Selectivity. Langmuir 1998, 14 (9), 2415–2425. 10.1021/la9709296. [DOI] [Google Scholar]
- Wang J.; Kaskel S. KOH Activation of Carbon-Based Materials for Energy Storage. J. Mater. Chem. 2012, 22 (45), 23710–23725. 10.1039/c2jm34066f. [DOI] [Google Scholar]
- Chen W.; Zhang Z.-Y.; Li Q.; Wang H.-Y. Adsorption of Bromate and Competition from Oxyanions on Cationic Surfactant-Modified Granular Activated Carbon (GAC). Chem. Eng. J. 2012, 203, 319–325. 10.1016/j.cej.2012.07.047. [DOI] [Google Scholar]
- Villamagna A. M.; Murphy B. R. Ecological and Socio-economic Impacts of Invasive Water Hyacinth (Eichhornia crassipes): A Review. Freshw. Biol. 2010, 55 (2), 282–298. 10.1111/j.1365-2427.2009.02294.x. [DOI] [Google Scholar]
- Aljumialy A. M.; Mokaya R. Porous Carbons from Sustainable Sources and Mild Activation for Targeted High-Performance CO2 Capture and Storage. Mater. Adv. 2020, 1 (9), 3267–3280. 10.1039/D0MA00449A. [DOI] [Google Scholar]
- Mashhadimoslem H.; Vafaeinia M.; Safarzadeh M.; Ghaemi A.; Fathalian F.; Maleki A. Development of Predictive Models for Activated Carbon Synthesis from Different Biomass for CO2 Adsorption Using Artificial Neural Networks. Ind. Eng. Chem. Res. 2021, 60 (38), 13950–13966. 10.1021/acs.iecr.1c02754. [DOI] [Google Scholar]
- Yang Z.; Ning H.; Liu J.; Meng Z.; Li Y.; Ju X.; Chen Z. Surface Modification on Semi-Coke-Based Activated Carbon for Enhanced Separation of CH4/N2. Chem. Eng. Res. Des. 2020, 161, 312–321. 10.1016/j.cherd.2020.07.025. [DOI] [Google Scholar]
- Attia N. F.; Jung M.; Park J.; Jang H.; Lee K.; Oh H. Flexible Nanoporous Activated Carbon Cloth for Achieving High H2, CH4, and CO2 Storage Capacities and Selective CO2/CH4 Separation. Chem. Eng. J. 2020, 379, 122367. 10.1016/j.cej.2019.122367. [DOI] [Google Scholar]
- Dilokekunakul W.; Teerachawanwong P.; Klomkliang N.; Supasitmongkol S.; Chaemchuen S. Effects of Nitrogen and Oxygen Functional Groups and Pore Width of Activated Carbon on Carbon Dioxide Capture: Temperature Dependence. Chem. Eng. J. 2020, 389, 124413. 10.1016/j.cej.2020.124413. [DOI] [Google Scholar]
- Ghalandari V.; Hashemipour H.; Bagheri H. Experimental and Modeling Investigation of Adsorption Equilibrium of CH4, CO2, and N2 on Activated Carbon and Prediction of Multi-Component Adsorption Equilibrium. Fluid Phase Equilib. 2020, 508, 112433. 10.1016/j.fluid.2019.112433. [DOI] [Google Scholar]
- Mashhadimoslem H.; Vafaeinia M.; Safarzadeh M.; Ghaemi A.; Fathalian F.; Maleki A. Development of Predictive Models for Activated Carbon Synthesis from Different Biomass for CO2 Adsorption Using Artificial Neural Networks. Ind. Eng. Chem. Res. 2021, 60 (38), 13950–13966. 10.1021/acs.iecr.1c02754. [DOI] [Google Scholar]
- Huang G.; Liu Y.; Wu X.; Cai J. Activated Carbons Prepared by the KOH Activation of a Hydrochar from Garlic Peel and Their CO2 Adsorption Performance. New Carbon Mater. 2019, 34 (3), 247–257. 10.1016/S1872-5805(19)60014-4. [DOI] [Google Scholar]
- Jiang B.; Zhang Y.; Zhou J.; Zhang K.; Chen S. Effects of Chemical Modification of Petroleum Cokes on the Properties of the Resulting Activated Carbon. Fuel 2008, 87 (10–11), 1844–1848. 10.1016/j.fuel.2007.11.010. [DOI] [Google Scholar]
- Mazarji M.; Aminzadeh B.; Baghdadi M.; Bhatnagar A. Removal of Nitrate from Aqueous Solution Using Modified Granular Activated Carbon. J. Mol. Liq. 2017, 233, 139–148. 10.1016/j.molliq.2017.03.004. [DOI] [Google Scholar]
- Tan Y. L.; Islam M. A.; Asif M.; Hameed B. H. Adsorption of Carbon Dioxide by Sodium Hydroxide-Modified Granular Coconut Shell Activated Carbon in a Fixed Bed. Energy 2014, 77, 926–931. 10.1016/j.energy.2014.09.079. [DOI] [Google Scholar]
- Liu H.-B.; Yang B.; Xue N.-D. Enhanced Adsorption of Benzene Vapor on Granular Activated Carbon under Humid Conditions Due to Shifts in Hydrophobicity and Total Micropore Volume. J. Hazard. Mater. 2016, 318, 425–432. 10.1016/j.jhazmat.2016.07.026. [DOI] [PubMed] [Google Scholar]
- Shafeeyan M. S.; Daud W. M. A. W.; Shamiri A.; Aghamohammadi N. Adsorption Equilibrium of Carbon Dioxide on Ammonia-Modified Activated Carbon. Chem. Eng. Res. Des. 2015, 104, 42–52. 10.1016/j.cherd.2015.07.018. [DOI] [Google Scholar]
- Park D.; Ju Y.; Kim J.-H.; Ahn H.; Lee C.-H. Equilibrium and Kinetics of Nitrous Oxide, Oxygen and Nitrogen Adsorption on Activated Carbon and Carbon Molecular Sieve. Sep. Purif. Technol. 2019, 223, 63–80. 10.1016/j.seppur.2019.04.051. [DOI] [Google Scholar]
- Li D.; Zhou J.; Zhang Z.; Li L.; Tian Y.; Lu Y.; Qiao Y.; Li J.; Wen L. Improving Low-Pressure CO2 Capture Performance of N-Doped Active Carbons by Adjusting Flow Rate of Protective Gas during Alkali Activation. Carbon N. Y. 2017, 114, 496–503. 10.1016/j.carbon.2016.12.039. [DOI] [Google Scholar]
- Suhdi; Wang S.-C. Fine Activated Carbon from Rubber Fruit Shell Prepared by Using ZnCl2 and KOH Activation. Appl. Sci. 2021, 11 (9), 3994. 10.3390/app11093994. [DOI] [Google Scholar]
- Manyà J. J.; González B.; Azuara M.; Arner G. Ultra-Microporous Adsorbents Prepared from Vine Shoots-Derived Biochar with High CO2 Uptake and CO2/N2 Selectivity. Chem. Eng. J. 2018, 345, 631–639. 10.1016/j.cej.2018.01.092. [DOI] [Google Scholar]
- Khan M. A.; Ahn Y.-T.; Kumar M.; Lee W.; Min B.; Kim G.; Cho D.-W.; Park W. B.; Jeon B.-H. Adsorption Studies for the Removal of Nitrate Using Modified Lignite Granular Activated Carbon. Sep. Sci. Technol. 2011, 46 (16), 2575–2584. 10.1080/01496395.2011.601782. [DOI] [Google Scholar]
- Wang X.; Yun S.; Fang W.; Zhang C.; Liang X.; Lei Z.; Liu Z. Layer-Stacking Activated Carbon Derived from Sunflower Stalk as Electrode Materials for High-Performance Supercapacitors. ACS Sustain. Chem. Eng. 2018, 6 (9), 11397–11407. 10.1021/acssuschemeng.8b01334. [DOI] [Google Scholar]
- Ruz P.; Banerjee S.; Pandey M.; Sudarsan V.; Sastry P. U.; Kshirsagar R. J. Structural Evolution of Turbostratic Carbon: Implications in H2 Storage. Solid State Sci. 2016, 62, 105–111. 10.1016/j.solidstatesciences.2016.10.017. [DOI] [Google Scholar]
- Du W.; Wang X.; Sun X.; Zhan J.; Zhang H.; Zhao X. Nitrogen-Doped Hierarchical Porous Carbon Using Biomass-Derived Activated Carbon/Carbonized Polyaniline Composites for Supercapacitor Electrodes. J. Electroanal. Chem. 2018, 827, 213–220. 10.1016/j.jelechem.2018.09.031. [DOI] [Google Scholar]
- Bakti A. I.; Gareso P. L. Characterization of Active Carbon Prepared from Coconuts Shells Using FTIR, XRD and SEM Techniques. J. Ilm. Pendidik. Fis. Al-Biruni 2018, 7 (1), 33–39. 10.24042/jipfalbiruni.v7i1.2459. [DOI] [Google Scholar]
- Singh G.; Lakhi K. S.; Ramadass K.; Kim S.; Stockdale D.; Vinu A. A Combined Strategy of Acid-Assisted Polymerization and Solid State Activation to Synthesize Functionalized Nanoporous Activated Biocarbons from Biomass for CO2 Capture. Microporous Mesoporous Mater. 2018, 271, 23–32. 10.1016/j.micromeso.2018.05.035. [DOI] [Google Scholar]
- Ru S.; Wang X.; Ma G.; Tan J.; Xiao H.; Ai Z. Facile Fabrication of Graphitization-Enhanced Wrinkled Paper-like N-Doped Porous Carbon via a ZnCl2-Modified NaCl-Template Method for Use as an Anode in Lithium Ion Batteries. Sustainable Energy Fuels 2020, 4 (7), 3477–3486. 10.1039/D0SE00517G. [DOI] [Google Scholar]
- Singh G.; Ramadass K.; Lee J. M.; Ismail I. S.; Singh M.; Bansal V.; Yang J.-H.; Vinu A. Convenient Design of Porous and Heteroatom Self-Doped Carbons for CO2 Capture. Microporous Mesoporous Mater. 2019, 287, 1–8. 10.1016/j.micromeso.2019.05.042. [DOI] [Google Scholar]
- Yu Y.; An Q.; Jin L.; Luo N.; Li Z.; Jiang J. Unraveling Sorption of Cr(VI) from Aqueous Solution by FeCl3 and ZnCl2-Modified Corn Stalks Biochar: Implicit Mechanism and Application. Bioresour. Technol. 2020, 297, 122466. 10.1016/j.biortech.2019.122466. [DOI] [PubMed] [Google Scholar]
- Yan L.; Liu Y.; Zhang Y.; Liu S.; Wang C.; Chen W.; Liu C.; Chen Z.; Zhang Y. ZnCl2 Modified Biochar Derived from Aerobic Granular Sludge for Developed Microporosity and Enhanced Adsorption to Tetracycline. Bioresour. Technol. 2020, 297, 122381. 10.1016/j.biortech.2019.122381. [DOI] [PubMed] [Google Scholar]
- Oliveira L. C. A.; Pereira E.; Guimaraes I. R.; Vallone A.; Pereira M.; Mesquita J. P.; Sapag K. Preparation of Activated Carbons from Coffee Husks Utilizing FeCl3 and ZnCl2 as Activating Agents. J. Hazard. Mater. 2009, 165 (1–3), 87–94. 10.1016/j.jhazmat.2008.09.064. [DOI] [PubMed] [Google Scholar]
- Melliti A.; Srivastava V.; Kheriji J.; Sillanpää M.; Hamrouni B. Date Palm Fiber as a Novel Precursor for Porous Activated Carbon: Optimization, Characterization and Its Application as Tylosin Antibiotic Scavenger from Aqueous Solution. Surf. Interfaces 2021, 24, 101047. 10.1016/j.surfin.2021.101047. [DOI] [Google Scholar]
- Liu L.; Ji M.; Wang F. Adsorption of Nitrate onto ZnCl2-Modified Coconut Granular Activated Carbon: Kinetics, Characteristics, and Adsorption Dynamics. Adv. Mater. Sci. Eng. 2018, 2018, 1939032. 10.1155/2018/1939032. [DOI] [Google Scholar]
- Shao L.; Sang Y.; Liu N.; Liu J.; Zhan P.; Huang J.; Chen J. Selectable Microporous Carbons Derived from Poplar Wood by Three Preparation Routes for CO2 Capture. ACS Omega 2020, 5 (28), 17450–17462. 10.1021/acsomega.0c01918. [DOI] [PMC free article] [PubMed] [Google Scholar]
- Xu X.; Yuan T.; Zhou Y.; Li Y.; Lu J.; Tian X.; Wang D.; Wang J. Facile Synthesis of Boron and Nitrogen-Doped Graphene as Efficient Electrocatalyst for the Oxygen Reduction Reaction in Alkaline Media. Int. J. Hydrogen Energy 2014, 39 (28), 16043–16052. 10.1016/j.ijhydene.2013.12.079. [DOI] [Google Scholar]
- Chen C.; Li X.; Tong Z.; Li Y.; Li M. Modification Process Optimization, Characterization and Adsorption Property of Granular Fir-Based Activated Carbon. Appl. Surf. Sci. 2014, 315, 203–211. 10.1016/j.apsusc.2014.07.111. [DOI] [Google Scholar]
- Gangupomu R. H.; Sattler M. L.; Ramirez D. Comparative Study of Carbon Nanotubes and Granular Activated Carbon: Physicochemical Properties and Adsorption Capacities. J. Hazard. Mater. 2016, 302, 362–374. 10.1016/j.jhazmat.2015.09.002. [DOI] [PubMed] [Google Scholar]
- Ramezanipour Penchah H.; Ghanadzadeh Gilani H.; Ghaemi A. CO2, N2, and H2 Adsorption by Hyper-Cross-Linked Polymers and Their Selectivity Evaluation by Gas–Solid Equilibrium. J. Chem. Eng. Data 2020, 65 (10), 4905–4913. 10.1021/acs.jced.0c00541. [DOI] [Google Scholar]
- Alivand M. S.; Mazaheri O.; Wu Y.; Stevens G. W.; Scholes C. A.; Mumford K. A. Preparation of Nanoporous Carbonaceous Promoters for Enhanced CO2 Absorption in Tertiary Amines. Engineering 2020, 6 (12), 1381–1394. 10.1016/j.eng.2020.05.004. [DOI] [Google Scholar]
- Nasrabadi A. T.; Foroutan M. Air Adsorption and Separation on Carbon Nanotube Bundles from Molecular Dynamics Simulations. Comput. Mater. Sci. 2012, 61, 134–139. 10.1016/j.commatsci.2012.04.030. [DOI] [Google Scholar]
- Matsis V. M.; Grigoropoulou H. P. Kinetics and Equilibrium of Dissolved Oxygen Adsorption on Activated Carbon. Chem. Eng. Sci. 2008, 63 (3), 609–621. 10.1016/j.ces.2007.10.005. [DOI] [Google Scholar]
- Ansón A.; Kuznicki S. M.; Kuznicki T.; Haastrup T.; Wang Y.; Lin C. C. H.; Sawada J. A.; Eyring E. M.; Hunter D. Adsorption of Argon, Oxygen, and Nitrogen on Silver Exchanged ETS-10 Molecular Sieve. Microporous Mesoporous Mater. 2008, 109 (1–3), 577–580. 10.1016/j.micromeso.2007.04.026. [DOI] [Google Scholar]
- Park Y. J.; Lee S. J.; Moon J. H.; Choi D. K.; Lee C. H. Adsorption Equilibria of O2, N2, and Ar on Carbon Molecular Sieve and Zeolites 10X, 13X, and LiX. J. Chem. Eng. Data 2006, 51 (3), 1001–1008. 10.1021/je050507v. [DOI] [Google Scholar]
- Zhou Y.; Wei L.; Yang J.; Sun Y.; Zhou L. Adsorption of Oxygen on Superactivated Carbon. J. Chem. Eng. Data 2005, 50 (3), 1068–1072. 10.1021/je050036c. [DOI] [Google Scholar]
- Fu Y.; Liu Y.; Yang X.; Li Z.; Jiang L.; Zhang C.; Wang H.; Yang R. T. Thermodynamic Analysis of Molecular Simulations of N2 and O2 Adsorption on Zeolites under Plateau Special Conditions. Appl. Surf. Sci. 2019, 480, 868–875. 10.1016/j.apsusc.2019.03.011. [DOI] [Google Scholar]
- Raganati F.; Alfe M.; Gargiulo V.; Chirone R.; Ammendola P. Isotherms and Thermodynamics of CO2 Adsorption on a Novel Carbon-Magnetite Composite Sorbent. Chem. Eng. Res. Des. 2018, 134, 540–552. 10.1016/j.cherd.2018.04.037. [DOI] [Google Scholar]
- Wilson S. M.W.; Handan Tezel F. Adsorption Separation of CF4, O2, CO2, and COF2 from an Excimer Gas Mixture. Sep. Purif. Technol. 2021, 258, 117659. 10.1016/j.seppur.2020.117659. [DOI] [Google Scholar]
- Ammendola P.; Raganati F.; Chirone R. CO2 Adsorption on a Fine Activated Carbon in a Sound Assisted Fluidized Bed: Thermodynamics and Kinetics. Chem. Eng. J. 2017, 322, 302–313. 10.1016/j.cej.2017.04.037. [DOI] [Google Scholar]
- Nuhnen A.; Janiak C. A Practical Guide to Calculate the Isosteric Heat/Enthalpy of Adsorption via Adsorption Isotherms in Metal–Organic Frameworks, MOFs. Dalton Trans. 2020, 49 (30), 10295–10307. 10.1039/D0DT01784A. [DOI] [PubMed] [Google Scholar]
- Park Y.; Moon D.-K.; Park D.; Mofarahi M.; Lee C.-H. Adsorption Equilibria and Kinetics of CO2, CO, and N2 on Carbon Molecular Sieve. Sep. Purif. Technol. 2019, 212, 952–964. 10.1016/j.seppur.2018.11.069. [DOI] [Google Scholar]
- Nabais J. M. V.; Carrott P. J. M.; Carrott M. M. L. R.; Padre-Eterno A. M.; Menéndez J. A.; Dominguez A.; Ortiz A. L. New Acrylic Monolithic Carbon Molecular Sieves for O2/N2 and CO2/CH4 Separations. Carbon N. Y. 2006, 44 (7), 1158–1165. 10.1016/j.carbon.2005.11.005. [DOI] [Google Scholar]
- Kim B. H.; Kim B. R.; Seo Y. G. A Study on Adsorption Equilibrium for Oxygen and Nitrogen into Carbon Nanotubes. Adsorption 2005, 11 (1), 207–212. 10.1007/s10450-005-5924-5. [DOI] [Google Scholar]
- Saha D.; Kienbaum M. J. Role of Oxygen, Nitrogen and Sulfur Functionalities on the Surface of Nanoporous Carbons in CO2 Adsorption: A Critical Review. Microporous Mesoporous Mater. 2019, 287, 29–55. 10.1016/j.micromeso.2019.05.051. [DOI] [Google Scholar]
- Kobayashi N.; Enoki T.; Ishii C.; Kaneko K.; Endo M. Gas Adsorption Effects on Structural and Electrical Properties of Activated Carbon Fibers. J. Chem. Phys. 1998, 109 (5), 1983–1990. 10.1063/1.476774. [DOI] [Google Scholar]
- Ma Y. H.; Sun W.; Bhandarkar M.; Wang J.. Adsorption and Diffusion of Oxygen, Nitrogen, Methane and Argon in Molecular Sieve Carbons; Department of Chemical Engineering, Worcester Polytechnic Institute, 1990. [Google Scholar]
- Bae Y.-S.; Lee C.-H. Sorption Kinetics of Eight Gases on a Carbon Molecular Sieve at Elevated Pressure. Carbon N. Y. 2005, 43 (1), 95–107. 10.1016/j.carbon.2004.08.026. [DOI] [Google Scholar]
- Bazan R. E.; Bastos-Neto M.; Moeller A.; Dreisbach F.; Staudt R. Adsorption Equilibria of O 2, Ar, Kr and Xe on Activated Carbon and Zeolites: Single Component and Mixture Data. Adsorption 2011, 17 (2), 371–383. 10.1007/s10450-011-9337-3. [DOI] [Google Scholar]
- Shirani B.; Eic M. Equilibrium and Kinetics of Methane and Ethane Adsorption in Carbon Molecular Sieve. Int. J. Chem. React. Eng. 2016, 14 (4), 887–898. 10.1515/ijcre-2015-0124. [DOI] [Google Scholar]
- Cavenati S.; Grande C. A.; Rodrigues A. E. Separation of Methane and Nitrogen by Adsorption on Carbon Molecular Sieve. Sep. Sci. Technol. 2005, 40 (13), 2721–2743. 10.1080/01496390500287846. [DOI] [Google Scholar]
- Park Y.; Moon D. K.; Kim Y. H.; Ahn H.; Lee C. H. Adsorption Isotherms of CO2, CO, N2, CH4, Ar and H2 on Activated Carbon and Zeolite LiX up to 1.0 MPa. Adsorption 2014, 20 (4), 631–647. 10.1007/s10450-014-9608-x. [DOI] [Google Scholar]
- Reid C. R.; O’koy I. P.; Thomas K. M. Adsorption of Gases on Carbon Molecular Sieves Used for Air Separation. Spherical Adsorptives as Probes for Kinetic Selectivity. Langmuir 1998, 14 (9), 2415–2425. 10.1021/la9709296. [DOI] [Google Scholar]
- Rutherford S. W.; Do D. D. Characterization of Carbon Molecular Sieve 3A. Langmuir 2000, 16 (18), 7245–7254. 10.1021/la991634q. [DOI] [Google Scholar]
- Jayaraman A.; Chiao A. S.; Padin J.; Yang R. T.; Munson C. L. Kinetic Separation of Methane/Carbon Dioxide by Molecular Sieve Carbons. Sep. Sci. Technol. 2002, 37 (11), 2505–2528. 10.1081/SS-120004450. [DOI] [Google Scholar]
- Rutherford S. W.; Coons J. E. Adsorption Dynamics of Carbon Dioxide in Molecular Sieving Carbon. Carbon N. Y. 2003, 41 (3), 405–411. 10.1016/S0008-6223(02)00318-4. [DOI] [Google Scholar]
- Siriwardane R. V.; Shen M.-S.; Fisher E. P.; Poston J. A. Adsorption of CO2 on Molecular Sieves and Activated Carbon. Energy Fuels 2001, 15 (2), 279–284. 10.1021/ef000241s. [DOI] [Google Scholar]
Associated Data
This section collects any data citations, data availability statements, or supplementary materials included in this article.