Abstract
We assembled an ancestrally diverse collection of genome-wide association studies (GWAS) of type 2 diabetes (T2D) in 180,834 cases and 1,159,055 controls (48.9% non-European descent) through the DIAMANTE (DIAbetes Meta-ANalysis of Trans-Ethnic association studies) Consortium. Multi-ancestry GWAS meta-analysis identified 237 loci attaining stringent genome-wide significance (P < 5 x 10⁻⁹), which were delineated to 338 distinct association signals. Fine-mapping of these signals was enhanced by the increased sample size and expanded population diversity of the multi-ancestry meta-analysis, which localized 54.4% of T2D associations to a single variant with >50% posterior probability. This improved fine-mapping enabled systematic assessment of candidate causal genes and molecular mechanisms through which T2D associations are mediated, laying the foundations for functional investigations. Multi-ancestry genetic risk scores enhanced transferability of T2D prediction across diverse populations. Our study provides a step towards more effective clinical translation of T2D GWAS to improve global health for all, irrespective of genetic background.
The global prevalence of type 2 diabetes (T2D) has quadrupled over the last 30 years1, affecting approximately 392 million individuals in 20152. Despite this worldwide impact, the largest T2D genome-wide association studies (GWAS) have predominantly featured populations of European ancestry3-6, compromising prospects for clinical translation. Failure to detect causal variants that contribute to disease risk outside European ancestry populations limits progress towards a full understanding of disease biology and constrains opportunities for development of therapeutics7. Implementation of personalized approaches to disease management depends on accurate prediction of individual risk, irrespective of ancestry. However, genetic risk scores (GRS) derived from European ancestry GWAS provide unreliable prediction when deployed in other population groups, in part reflecting differences in effect sizes, allele frequencies and patterns of linkage disequilibrium (LD)8.
To address the impact of this population bias, recent T2D GWAS have included individuals of non-European ancestry9-11. The DIAMANTE (DIAbetes Meta-ANalysis of Trans-Ethnic association studies) Consortium was established to assemble T2D GWAS across diverse ancestry groups. Analyses of the European and East Asian ancestry components of DIAMANTE have previously been reported6,10. Here, we describe the results of our multi-ancestry meta-analysis, which expands on these published components to a total of 180,834 T2D cases and 1,159,055 controls, with 20.5% of the effective sample size ascertained from African, Hispanic, and South Asian ancestry groups. With these data, we demonstrate the value of analyses conducted in diverse populations to understand how T2D-associated variants impact downstream molecular and biological processes underlying the disease, and advance clinical translation of GWAS findings for all, irrespective of genetic background.
RESULTS
Study overview.
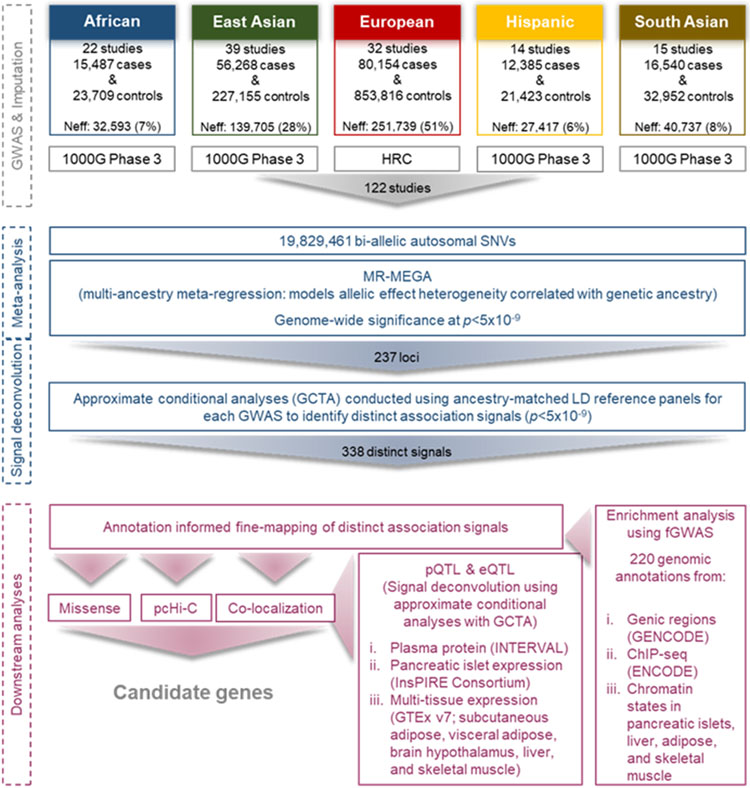
We accumulated association summary statistics from 122 GWAS in 180,834 T2D cases and 1,159,055 controls (effective sample size 492,191) across five ancestry groups (Supplementary Tables 1-3). We use the term “ancestry group” to refer to individuals with similar genetic background: European ancestry (51.1% of the total effective sample size); East Asian ancestry (28.4%); South Asian ancestry (8.3%); African ancestry, including recently admixed African American populations (6.6%); and Hispanic individuals with recent admixture of American, African, and European ancestry (5.6%). Each ancestry-specific GWAS was imputed to reference panels from the 1000 Genomes Project12,13, Haplotype Reference Consortium14, or population-specific whole-genome sequence data. Subsequent association analyses were adjusted for population structure and relatedness (Supplementary Table 4). We considered 19,829,461 bi-allelic autosomal single nucleotide variants (SNVs) that overlapped reference panels with minor allele frequency (MAF) > 0.5% in at least one of the five ancestry groups (Extended Data Fig. 1 and Methods).
Robust discovery of multi-ancestry T2D associations.
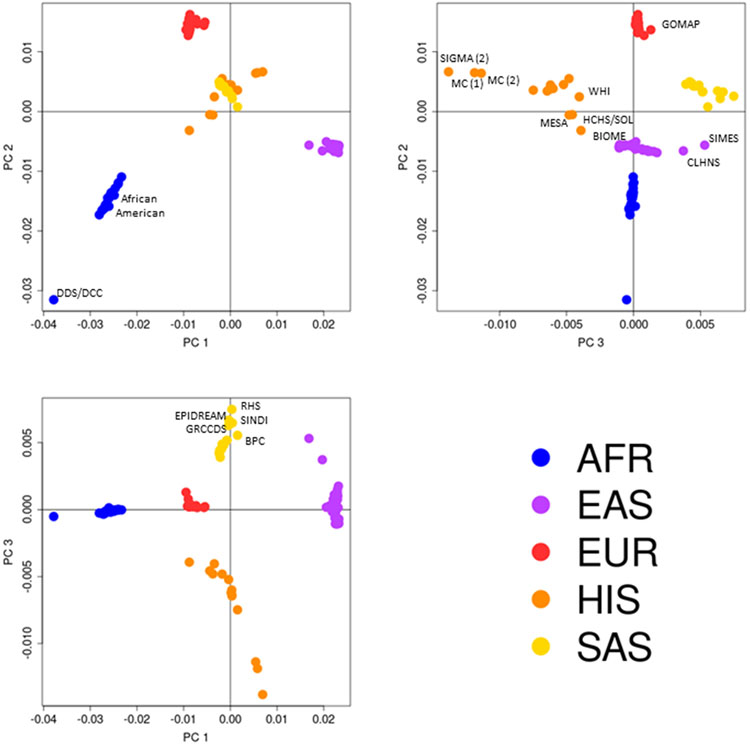
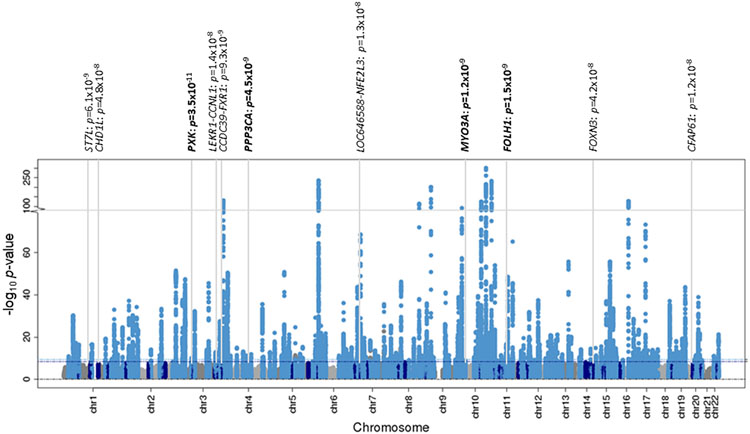
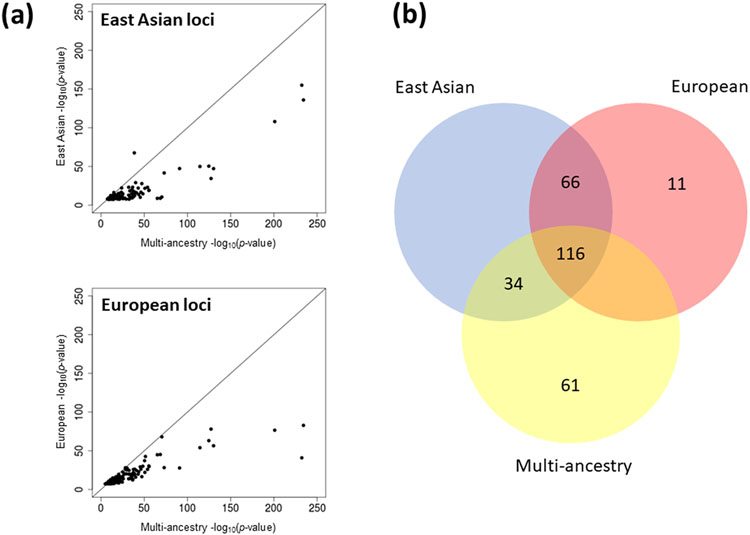
We aggregated association summary statistics via multi-ancestry meta-regression, implemented in MR-MEGA15, which models allelic effect heterogeneity correlated with genetic ancestry. We included three axes of genetic variation as covariates that separated GWAS from the five major ancestry groups (Extended Data Fig. 2 and Methods). We identified 277 loci associated with T2D at the conventional genome-wide significance threshold of P < 5 x 10⁻⁸ (Extended Data Fig. 3 and Supplementary Table 5). By accounting for ancestry-correlated allelic effect heterogeneity in the multi-ancestry meta-regression, we observed lower genomic control inflation (λGC = 1.05) than when using either fixed- or random-effects meta-analysis (λGC = 1.25 under both models), and stronger signals of association at lead SNVs at most loci (Extended Data Fig. 4). Of the 277 loci, 11 have not previously been reported in recently published T2D GWAS meta-analyses6,10,11 that account for 78.6% of the total effective sample size of this multi-ancestry meta-regression (Extended Data Fig. 3 and Supplementary Note). Of the 100 and 193 loci attaining genome-wide significance (P < 5 x 10⁻⁸) in East Asian and European ancestry-specific meta-analyses, respectively, lead SNVs at 94 (94.0%) and 164 (85.0%) demonstrated stronger evidence for association (smaller P-value) in the multi-ancestry meta-regression (Extended Data Fig. 5 and Supplementary Note). These results demonstrate the power of multi-ancestry meta-analyses for locus discovery afforded by increased sample size, but also emphasize the importance of complementary ancestry-specific GWAS for identification of associations that are not shared across diverse populations.
The conventional genome-wide significance threshold does not allow for different patterns of LD across diverse populations in multi-ancestry meta-analysis. We therefore derived a multi-ancestry genome-wide significance threshold of P < 5 x 10⁻⁹ by estimating the effective number of independent SNVs across the five ancestry groups using haplotypes from the 1000 Genomes Project reference panel13 (Methods). Of the 277 loci reported in this multi-ancestry meta-regression, 237 attained the more stringent significance threshold, which we considered for downstream analyses. Through approximate conditional analyses, conducted using ancestry-matched LD reference panels for each GWAS, we partitioned associations at the 237 loci into 338 distinct signals that were each represented by an index SNV at the same multi-ancestry genome-wide significance threshold (Methods, Supplementary Tables 6-8, and Supplementary Note). Allelic effect estimates for distinct association signals from approximate conditional analyses undertaken in admixed ancestry groups were robust to the choice of reference panel (Supplementary Note).
Allelic-effect heterogeneity across ancestry groups.
Allelic-effect heterogeneity between ancestry groups can occur for several reasons, including differences in LD with causal variants or interactions with environment or polygenic background across diverse populations. An advantage of the multi-ancestry meta-regression model is that heterogeneity can be partitioned into two components. The first captures heterogeneity that is correlated with genetic ancestry (i.e. can be explained by the three axes of genetic variation). The second reflects residual heterogeneity due to differences in geographical location (for example different environmental exposures) and study design (for example different phenotype definition, case-control ascertainment, or covariate adjustments between GWAS). We observed 136 (40.2%) distinct T2D associations with nominal evidence (PHET < 0.05) of ancestry-correlated heterogeneity compared to 16.9 expected by chance (binomial test P < 2.2 x 10⁻¹⁶). In contrast, there was nominal evidence of residual heterogeneity at just 27 (8.0%) T2D association signals (binomial test P = 0.0037), suggesting that differences in allelic effect size between GWAS are more likely due to factors related to genetic ancestry than to geography and/or study design (Supplementary Note).
Population diversity improves fine-mapping resolution.
We sought to quantify the improvement in fine-mapping resolution offered by increased sample size and population diversity in the multi-ancestry meta-regression. For each of the 338 distinct signals, we first derived multi-ancestry and European ancestry-specific credible sets of variants that account for 99% of the posterior probability (π) of driving the T2D association under a uniform prior model of causality (Methods). Multi-ancestry meta-regression substantially reduced the median 99% credible set size from 35 variants (spanning 112 kb) to 10 variants (spanning 26 kb), and increased the median posterior probability ascribed to the index SNV from 24.3% to 42.0%. The 99% credible sets for 266 (78.7%) distinct T2D associations were smaller in the multi-ancestry meta-regression than in the European ancestry-specific meta-analysis, while a further 26 (7.7%) signals were resolved to a single SNV in both (Fig. 1, Supplementary Table 9, and Supplementary Note). Causal variant localization was also more precise in the multi-ancestry meta-regression than a meta-analysis of GWAS of European and East Asian ancestry, which together account for 79.5% of the total effective sample size, highlighting the important contribution of the most under-represented ancestry groups (African, Hispanic, and South Asian) to fine-mapping resolution (Fig. 1 and Supplementary Note).
Figure 1 ∣. Comparison of fine-mapping resolution for distinct association signals for T2D obtained from ancestry-specific meta-analysis and multi-ancestry meta-regression.
a, Each point corresponds to a distinct association signal, plotted according to the log10 credible set size in the multi-ancestry meta-regression on the x-axis and the log10 credible set size in the European ancestry meta-analysis on the y-axis. The 266 (78.7%) signals above the dashed y = x line were more precisely fine-mapped in the multi-ancestry meta-regression. b, We “down-sampled” the multi-ancestry meta-regression to the effective sample size of the European ancestry-specific meta-analysis. Each point corresponds to one of the 266 signals that were more precisely fine-mapped in the multi-ancestry meta-regression. The 137 (51.5%) signals above the dashed y = x line were more precisely fine-mapped in “down-sampled” multi-ancestry meta-regression than the equivalent sized European ancestry-specific meta-analysis. c, Properties of 99% credible sets of variants driving each distinct association signal in European ancestry-specific meta-analysis, combined East Asian and European ancestry meta-analysis, and multi-ancestry meta-regression. The inclusion of the most under-represented ancestry groups (African, Hispanic and South Asian) in the multi-ancestry meta-regression reduced the median size of 99% credible sets and increased the median posterior probability ascribed to index SNVs.
We next attempted to understand the relative contributions of population diversity and sample size to these improvements in fine-mapping resolution at the 266 distinct T2D associations that were more precisely localized after the multi-ancestry meta-regression. We down-sampled studies contributing to the multi-ancestry meta-regression to approximate the effective sample size of the European ancestry-specific meta-analysis, while maintaining the distribution of population diversity (Methods and Supplementary Table 10). The associations were better resolved in the down-sampled multi-ancestry meta-regression at 137 signals (51.5%), compared with 119 signals (44.7%) in the European ancestry-specific meta-analysis (Fig. 1 and Supplementary Table 11). These results highlight the value of diverse populations for causal variant localization in multi-ancestry meta-analysis, emphasizing the importance of increased sample size and differences in LD structure and allele frequency distribution between ancestry groups that has also been reported for other complex human traits16.
Multi-ancestry fine-mapping to single variant resolution.
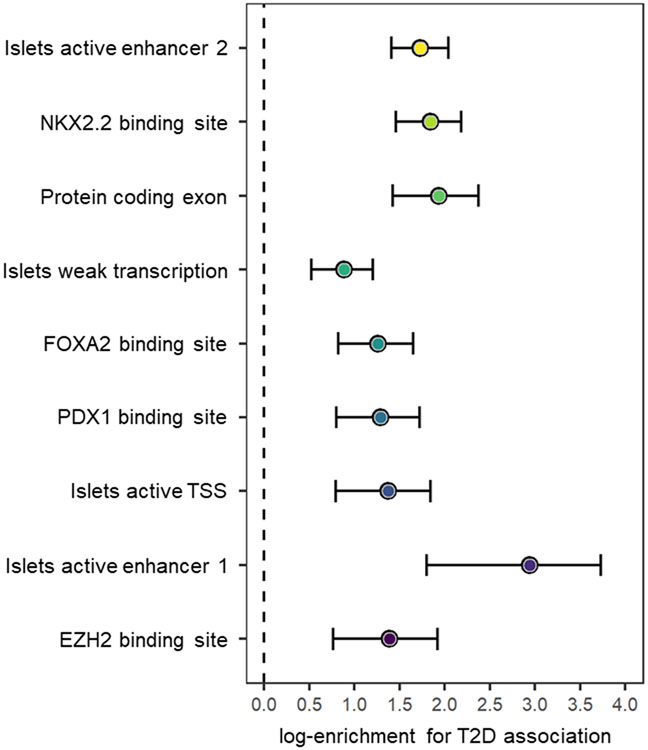
Previous T2D GWAS have demonstrated improved localization of causal variants through integration of fine-mapping data with genomic annotation6,17. By mapping SNVs to three categories of functional and regulatory annotation, with an emphasis on diabetes-relevant tissues18, we observed significant joint enrichment (P < 0.00023, Bonferroni correction for 220 annotations) for T2D associations mapping to protein coding exons, binding sites for NKX2.2, FOXA2, EZH2, and PDX1, and four chromatin states in pancreatic islets that mark active enhancers, active promoters, and transcribed regions (Methods, Extended Data Fig. 6 and Supplementary Table 12). We used the enriched annotations to derive a prior model for causality, and redefined 99% credible sets of variants for each distinct signal (Methods and Supplementary Table 13). Annotation-informed fine-mapping reduced the size of the 99% credible set, compared to the uniform prior, at 144 (42.6%) distinct association signals (Extended Data Fig. 7), and decreased the median from 10 variants (spanning 26 kb) to 8 variants (spanning 23 kb). For 184 (54.4%) signals, a single SNV accounted for >50% of the posterior probability of the T2D association (Supplementary Table 14). At 124 (36.7%) signals, >80% of the posterior probability could be attributed to a single SNV.
Missense variants implicate candidate causal genes.
After annotation-informed multi-ancestry fine-mapping, 19 of the 184 SNVs accounting for >50% of the posterior probability of the T2D association were missense variants (Supplementary Table 15). Two of these implicate novel candidate causal genes for the disease: MYO5C p.Glu1075Lys (rs3825801, P = 3.8 x 10⁻¹¹, π = 69.2%) at the MYO5C locus, and ACVR1C p.Ile482Val (rs7594480, P = 4.0 x 10⁻¹², π = 95.2%) at the CYTIP locus. ACVR1C encodes ALK7, a transforming growth factor-β receptor, overexpression of which induces growth inhibition and apoptosis of pancreatic β-cells19; ACVR1C p.Ile482Val has been previously associated with body fat distribution20. The multi-ancestry meta-regression also highlighted examples of previously reported associations that were better resolved by fine-mapping across diverse populations, including SLC16A11, KCNJ11-ABCC8, and ZFAND3-KCNK16-GLP1R (Supplementary Note).
Multi-omics integration highlights candidate effector genes.
We next sought to take advantage of the improved fine-mapping resolution offered by the multi-ancestry meta-regression to extend insights into candidate effector genes, tissue specificity, and mechanisms through which regulatory variants at non-coding T2D association signals impact disease risk. We integrated annotation-informed fine-mapping data with molecular quantitative trait loci (QTLs), in cis, for: (i) circulating plasma proteins (pQTLs)21; and (ii) gene expression (eQTLs) in diverse tissues, including pancreatic islets, subcutaneous and visceral adipose, liver, skeletal muscle, and hypothalamus22,23 (Methods). Bayesian colocalization24 of each pair of distinct T2D associations and molecular QTLs identified 97 candidate effector genes at 72 signals with posterior probability πCOLOC > 80% (Supplementary Tables 16 and 17). The colocalizations reinforced evidence supporting several genes previously implicated in T2D through detailed experimental studies, including ADCY5, STARD10, IRS1, KLF14, SIX3, and TCF7L225-29. A single candidate effector gene was implicated at 49 T2D association signals, of which 10 colocalized with eQTLs across multiple tissues: CEP68, ITGB6, RBM6, PCGF3, JAZF1, ANK1, ABO, ARHGAP19, PLEKHA1 and AP3S2. In contrast, we observed that cis-eQTLs at 44 signals were specific to one tissue (24 to pancreatic islets, 11 to subcutaneous adipose, five to skeletal muscle, two to visceral adipose, and one each to liver and hypothalamus), emphasizing the importance of conducting colocalization analyses across multiple tissues. Genome-wide promoter-focused chromatin confirmation capture data (pcHi-C) from pancreatic islets, subcutaneous adipose, and liver (equivalent data are not available in hypothalamus and visceral adipose)30-32 provided complementary support for several candidate effector genes (Supplementary Table 18 and Supplementary Note). These results demonstrate how the increased fine-mapping resolution afforded by our multi-ancestry meta-analysis can be integrated with diverse molecular data resources to reveal putative mechanisms underlying T2D susceptibility.
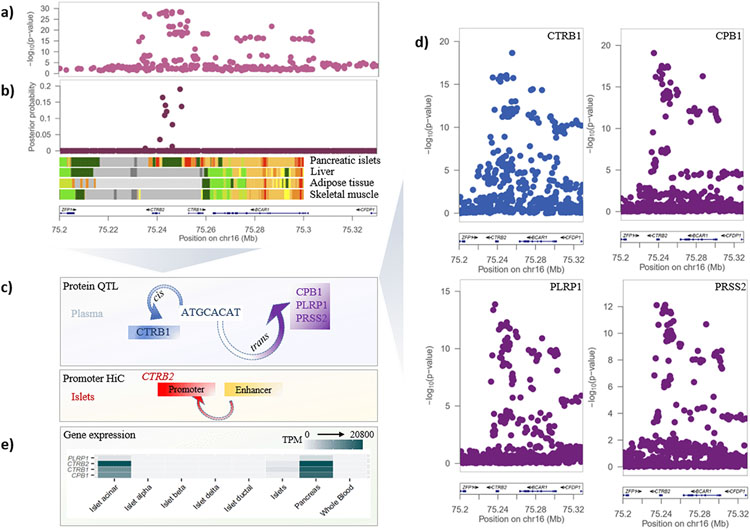
At the BCAR1 locus, multi-ancestry fine-mapping resolved the T2D association signal to a 99% credible set of nine variants. These variants overlap a chromatin accessible snATAC-seq peak in human pancreatic acinar cells33 and an enhancer element in human pancreatic islets that interacts with an active promoter upstream of the pancreatic exocrine enzyme chymotrypsin B2 gene CTRB231. The observations in bulk pancreatic islets are likely to have arisen due to exocrine (acinar cell) contamination since single-cell data do not support the expression of CTRB2 in endocrine cells (Fig. 2). The T2D association signal also colocalized with a cis-pQTL for circulating plasma levels of chymotrypsin B1 (CTRB1, πCOLOC = 98.6%). Interestingly, by extending our colocalization analyses at this locus to trans-pQTLs, we found that variants driving the T2D association signal also regulate levels of three other pancreatic secretory enzymes produced by the acinar cells and involved in the digestion of ingested fats and proteins: carboxypeptidase B1 (CPB1, πCOLOC = 98.8%), pancreatic lipase related protein 1 (PLRP1, πCOLOC = 97.6%), and serine protease 2 (PRSS2, πCOLOC = 98.3%). These observations are consistent with an effect of T2D-associated variants at this locus on gene and protein expression in the exocrine pancreas, with consequences for pancreatic endocrine function. This is in line with a recent study34 reporting rare mutations in another protein produced by the exocrine pancreas, chymotrypsin-like elastase family member 2A, which were found to influence levels of digestive enzymes and glucagon (secreted from alpha cells in pancreatic islets). Taken together, these complementary findings add to a growing body of evidence linking defects in the exocrine pancreas and T2D pathogenesis35,36.
Figure 2 ∣. T2D association signal at the BCAR1 locus colocalizes with multiple circulating plasma pQTLs.
a, Signal plot for T2D association from multi-ancestry meta-regression of 180,834 cases and 1,159,055 controls of diverse ancestry. Each point represents an SNV, plotted with their P-value (on a log10 scale) as a function of genomic position (NCBI build 37). Gene annotations are taken from the University of California Santa Cruz genome browser. Recombination rates are estimated from the Phase II HapMap. b, Fine-mapping of T2D association signal from multi-ancestry meta-regression. Each point represents an SNV plotted with their posterior probability of driving T2D association as a function of genomic position (NCBI build 37). Chromatin states are presented for four diabetes-relevant tissues: active TSS (red), flanking active TSS (orange red), strong transcription (green), weak transcription (dark green), genic enhancers (green yellow), active enhancer (orange), weak enhancer (yellow), bivalent/poised TSS (Indian red), flanking bivalent TSS/enhancer (dark salmon), repressed polycomb (silver), weak repressed polycomb (Gainsboro), quiescent/low (white). c, Schematic presentation of the single cis- and multiple trans- effects mediated by the BCAR1 locus on plasma proteins and the islet chromatin loop between islet enhancer and promoter elements near CTRB2. d, Signal plots for four circulating plasma proteins that colocalize with the T2D association in 3,301 European ancestry participants from the INTERVAL study. Each point represents an SNV, plotted with their P-value (on a log10 scale) as a function of genomic position (NCBI build 37). e, Expression of genes (transcripts per million, TPM) encoding colocalized proteins in islets, pancreas and whole blood.
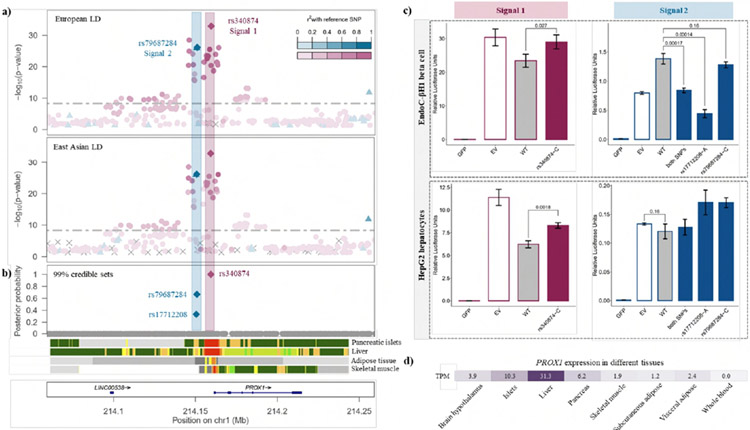
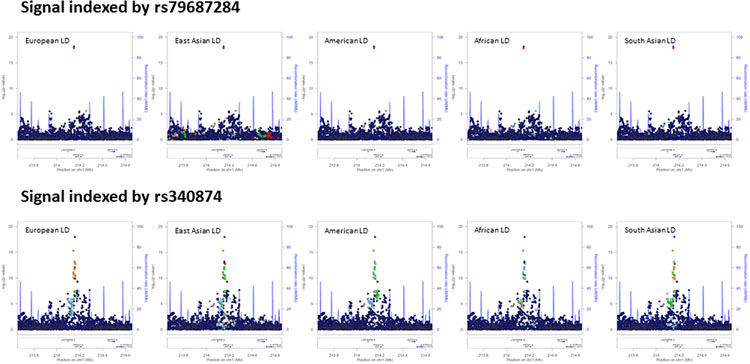
At the PROX1 locus, multi-ancestry fine-mapping localized the two distinct association signals to just three variants (Fig. 3 and Extended Data Fig. 8). The index SNV at the first signal (rs340874, P = 1.1 x 10⁻¹⁸, π > 99.9%) overlaps the PROX1 promoter in both human liver and pancreatic islets18,29. At the second signal, the two credible set variants map to the same enhancer active in islets and liver (rs79687284, P = 6.9 x 10⁻¹⁹, π = 66.7%; rs17712208, P = 1.4 x 10⁻¹⁸, π = 33.3%). Recent studies have demonstrated that the T2D-risk allele at rs17712208 (but not rs79687284) results in significant repression of enhancer activity in mouse MIN633 and human EndoC-βH1 beta cell models37. Furthermore, this enhancer interacts with the PROX1 promoter in islets31, but not in liver32. Motivated by these observations, we sought to determine whether these distinct signals impact T2D risk (via PROX1) in a tissue-specific manner by assessing transcriptional activity of the credible set variants (rs340874, rs79687284, and rs17712208) in human HepG2 hepatocytes and EndoC-βH1 beta cell models using in vitro reporter assays (Methods and Fig. 3). At the first signal, we demonstrated significant differences in luciferase activity between alleles at rs340874 in both hepatocytes (33% increase for risk allele, P = 0.0018) and beta cells (24% increase for risk allele, P = 0.027). However, at the second signal, a significant difference in luciferase activity between alleles was observed only for rs17712208 in islets (68% decrease for risk allele, P = 0.00014). Interestingly, there was evidence that the risk allele at rs79687284 could attenuate the effect as the combined effect of both risk alleles in the credible set was less severe. In HepG2 cells, both risk alleles increased transcription relative to wild type, although the difference for each variant alone or combined was not statistically significant. Taken together, these results suggest that likely causal variants at these distinct association signals exert their impact on T2D through the same effector gene, PROX1, but act in different tissue-specific manners.
Figure 3 ∣. Defining causal molecular mechanisms at the PROX1 locus.
a, Signal plot for two distinct T2D associations from multi-ancestry meta-regression of 180,834 cases and 1,159,055 controls of diverse ancestry. Each point represents an SNV, plotted with their P-value (on a −log10 scale) as a function of genomic position (NCBI build 37). Index SNVs are represented by the blue and purples diamonds. All other SNVs are colored according to the LD with the index SNVs in European and East Asian ancestry populations. Gene annotations are taken from the University of California Santa Cruz genome browser. b, Fine-mapping of T2D association signals from multi-ancestry meta-regression. Each point represents a SNV plotted with their posterior probability of driving each distinct T2D association as a function of genomic position (NCBI build 37). The 99% credible sets for the two signals are highlighted by the purple and blue diamonds. Chromatin states are presented for four diabetes-relevant tissues: active TSS (red), flanking active TSS (orange red), strong transcription (green), weak transcription (dark green), genic enhancers (green yellow), active enhancer (orange), weak enhancer (yellow), bivalent/poised TSS (Indian red), flanking bivalent TSS/enhancer (dark salmon), repressed polycomb (silver), weak repressed polycomb (Gainsboro), quiescent/low (white). c, Transcriptional activity of the 99 credible set variants at the two T2D association signals in human HepG2 hepatocytes and EndoC-βH1 beta cell models obtained from in vitro reporter assays. Biological replicates: n = 3. Technical replicates: n = 3. WT, wild-type (non-risk allele/haplotype); GFP, green fluorescent protein (negative control); EV, empty vector (baseline). Height of bar represents mean. Error bars represent standard error of the mean. Differences in luciferase activity between groups were tested using two-tailed two-sample t-tests, where P < 0.05 was considered statistically significant. d, Expression of PROX1 (transcripts per million, TPM) across a range of diabetes-relevant tissues.
Transferability of T2D GRS across diverse populations.
GRS derived from European ancestry GWAS have limited transferability into other population groups in part because of ancestry-correlated differences in the frequency and effect of risk alleles38. We took advantage of the population diversity in DIAMANTE to compare the prediction performance of multi-ancestry and ancestry-specific T2D GRS constructed using lead SNVs at loci attaining genome-wide significance. We selected two studies per ancestry group as test GWAS into which the prediction performance of the GRS was assessed using trait variance explained (pseudo R2) and odds-ratio (OR) per risk score unit. We repeated the multi-ancestry meta-regression and ancestry-specific meta-analyses, after excluding the test GWAS, and defined lead SNVs at loci attaining genome-wide significance (P < 5 x 10⁻⁹ for multi-ancestry GRS and P < 5 x 10⁻⁸ for ancestry-specific GRS). For each ancestry-specific GRS, we used allelic effect estimates for each lead SNV as weights, irrespective of the population in which the test GWAS was undertaken. However, for the multi-ancestry GRS, we derived weights for each lead SNV that were specific to each test GWAS population by allowing for ancestry-correlated heterogeneity in allelic effects (Methods).
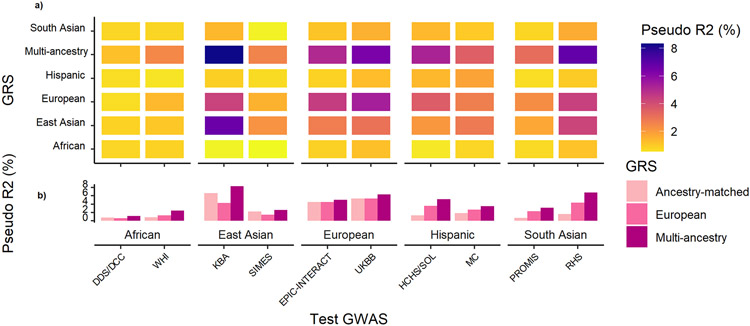
As expected, ancestry-specific GRS performed best in test GWAS from their respective ancestry group (Fig. 4 and Supplementary Table 19). However, for the ancestry groups with the smallest effective sample size (African, Hispanic, and South Asian), the predictive power of the ancestry-specific GRS was weak (pseudo R2 < 1%) because the number of lead SNVs attaining genome-wide significance was small. For test GWAS from these under-represented ancestry groups, the European ancestry-specific GRS outperformed the ancestry-matched GRS because: (i) more lead SNVs attained genome-wide significance in the European ancestry meta-analysis; and (ii) the T2D association signals represented by these lead SNVs are mostly shared across ancestry groups despite differing allele frequencies and LD patterns. Notwithstanding these observations, the greatest predictive power for test GWAS from all ancestry groups was achieved by the multi-ancestry GRS weighted with population-specific allelic effect estimates.
Figure 4 ∣. Transferability of multi-ancestry and ancestry-specific GRS into GWAS across diverse population groups.
Each GRS was constructed using lead SNVs attaining genome-wide significance (P < 5 x 10⁻⁹ for multi-ancestry GRS and P < 5 x 10⁻⁸ for ancestry-specific GRS). For the multi-ancestry GRS, population-specific allelic effects on T2D were estimated from the meta-regression to generate different GRS weights for each test GWAS. For each ancestry-specific GRS, weights were generated from allelic effect estimates obtained from fixed-effects meta-analysis. a, The trait variance explained (pseudo R2) by each GRS was assessed in two test GWAS from each ancestry group. b, The multi-ancestry GRS out-performed ancestry-specific GRS into all test GWAS, reflecting the shared genetic contribution to T2D across diverse populations, despite differing allele frequencies and LD patterns.
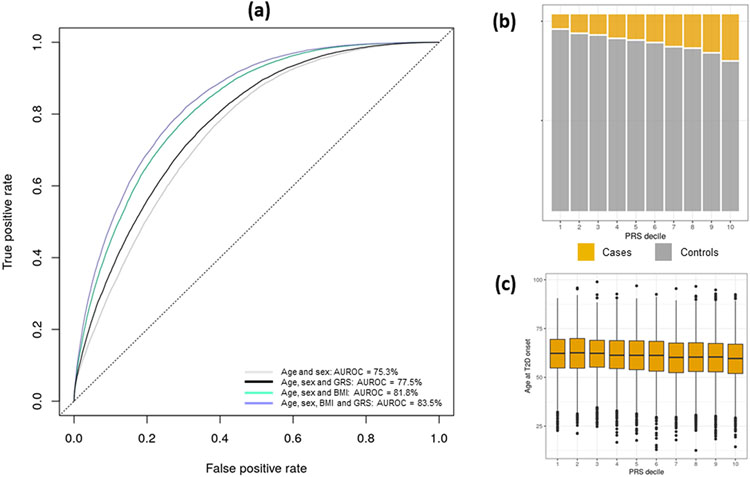
We then tested the power of the multi-ancestry GRS to predict T2D status in 129,230 individuals of Finnish ancestry from FinnGen, a population-based biobank from Finland (Methods). Because FinnGen was not part of DIAMANTE, we used association summary statistics from the complete meta-regression to derive Finnish-specific allelic effect estimates to use as weights in the multi-ancestry GRS (Extended Data Fig. 9 and Supplementary Table 20). Individuals in the top decile of the GRS were at 5.3-fold increased risk of T2D compared to those in the bottom decile. Inclusion of the multi-ancestry GRS with Finnish-specific weights to a predictive model including age, sex, and body mass index (BMI) increased the area under the receiver operating characteristic curve (AUROC) from 81.8% to 83.5%. We note that modest increases in AUROC attributable to the GRS over lifestyle/clinical factors in cross-sectional studies can mask impactful improvements in clinical performance, particularly amongst those individuals at the extremes of the GRS distribution who may have especially high lifetime disease risk and/or be prone to earlier disease onset39. In FinnGen, age impacted the power of a predictive model including the T2D GRS, sex and BMI: the AUROC decreased from 86.9% in individuals under 50 years old to 73.1% in those over 80 years old (Supplementary Table 21). Each unit of the weighted GRS was associated with 1.24 years earlier age of T2D diagnosis (P = 7.1 x 10−57), indicating that those with a higher genetic burden are more likely to be affected earlier in life.
Positive selection of T2D risk alleles.
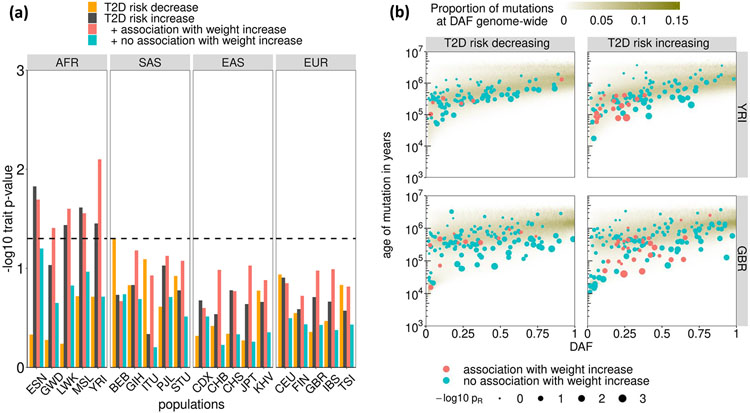
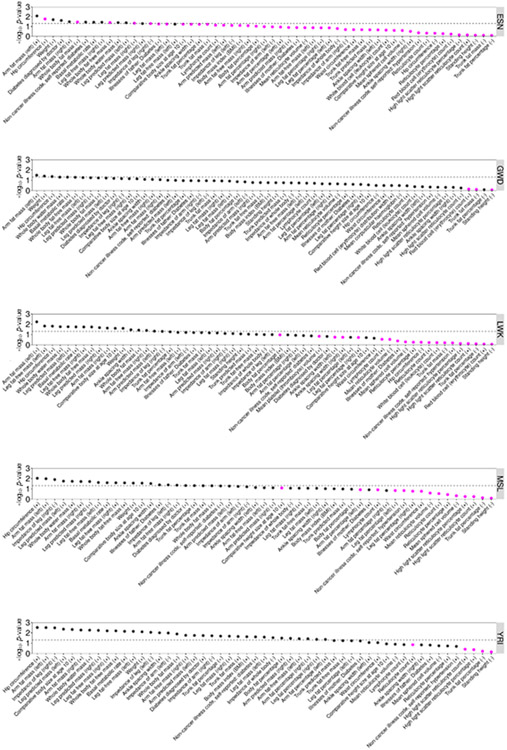
Previous investigations40 have concluded that historical positive selection has not had the major impact on T2D envisaged by the thrifty genotype hypothesis41. We sought to re-evaluate the evidence for positive selection of T2D risk alleles across our expanded collection of distinct multi-ancestry association signals. We fitted demographic histories to haplotypes for each population in the 1000 Genomes Project reference panel13 using Relate42. We quantified the evidence for selection for each T2D index SNV by assessing the extent to which the mutation has more descendants than other lineages that were present when it arose (Methods). This approach is well powered to detect positive selection acting on polygenic traits over a period of a few thousand to a few tens of thousands of years. We detected evidence of selection (P < 0.05) in four of the five African ancestry populations in the 1000 Genomes Project reference panel (but not other ancestry groups) towards increased T2D risk (Fig. 5). Given that T2D, itself, is likely to have been an advantageous phenotype only via pleiotropic variants acting through beneficial traits, we tested for association of index SNVs at distinct T2D signals with phenotypes available in the UK Biobank43 (Methods and Extended Data Fig. 10). We found that T2D risk alleles that were also associated with increased weight (and other obesity-related traits) generally displayed more recent origin when compared to the genome-wide mutation age distribution at the same derived allele frequency (P < 0.05 in all African ancestry populations), consistent with positive selection (Extended Data Fig. 10). Excluding these weight-related SNVs removed the selection signature observed in African ancestry populations. These observations are consistent with positive selection of T2D risk alleles that has been driven by the promotion of energy storage and usage appropriate to the local environment44. Outside Africa, our analysis yields no evidence for selection of T2D risk alleles. This suggests the absence of a selective advantage outside Africa, or alternatively, that the selective advantage is old and now masked in the relatively more strongly bottlenecked groups outside Africa. Further work is needed to characterize the specific pathways responsible for this adaptation and its finer-scale geographic impact.
Figure 5 ∣. Positive selection acting on T2D index SNVs.
a, Evidence of selection from Relate towards increased T2D risk is restricted to African ancestry populations and is explained by those SNVs that are associated with increased weight. b, T2D risk alleles that are associated with increased weight are particularly young for their derived allele frequency (DAF). Population abbreviations (sample sizes): ESN (98), Esan in Nigeria; GWD (112), Gambian in Western Divisions of the Gambia; LWK (98), Luhya in Webuye, Kenya; MSL (84), Mende in Sierra Leone; YRI (107), Yoruba in Ibadan, Nigeria; BEB (85), Bengali in Bangladesh; GIH (102), Gujarati Indian from Houston, Texas; ITU (101), Indian Telegu from the UK; PJL (95), Punjabi from Lahore, Pakistan; STU (101), Sri Lankan Tamil from the UK; CDX (92), Chinese Dai in Xishuangbanna, China; CHB (102), Han Chinese in Beijing, China; CHS (104), Southern Han Chinese; JPT (103), Japanese in Tokyo, Japan; KHV (98), Kinh in Ho Chi Min City, Vietnam; CEU (98), Utah residents with Northern and Western European ancestry; FIN (98), Finnish in Finland; GBR (90), British in England and Scotland; IBS (106), Iberian population in Spain; TSI (106), Toscani in Italy.
DISCUSSION
In consideration of the global burden of T2D, the DIAMANTE Consortium assembled the most ancestrally diverse collection of GWAS of the disease to date. We implemented a powerful meta-regression approach15 to enable aggregation of GWAS summary statistics across diverse populations that allows for heterogeneity in allelic effects on disease risk that is correlated with ancestry. By representing the ancestry of each study as multidimensional and continuous axes of genetic variation, the meta-regression model is not restricted to broad continental ancestry categories and can allow for finer-scale differences between GWAS within ancestry groups45. Our study demonstrated the advantages of applying this approach to ancestrally diverse GWAS in DIAMANTE with regard to: (i) discovery of association signals that are shared across populations, through increased sample size and by reducing the genomic control inflation due to residual stratification; (ii) defining the extent of heterogeneity in allelic effects at distinct association signals; (iii) allowing for LD-driven heterogeneity to enable fine-mapping of causal variants; and (iv) deriving population-specific weights that substantially improve the transferability of multi-ancestry GRS over ancestry-specific GRS. Our analyses considered SNVs present in the 1000 Genomes Project13 and Haplotype Reference Consortium14 reference panels used for imputation, which potentially excludes low-frequency population-specific variants, but which provides a uniform “backbone” of variants for fine-mapping association signals that are shared across multiple population groups. The contribution of population-specific variants that do not overlap reference panels are more fully assessed in complementary ancestry-specific meta-analyses, such as those in European and East Asian components of DIAMANTE6,10. Further development of fine-mapping methods is required to localize such population-specific causal variants in multi-ancestry meta-analysis46.
Our study has extended knowledge of T2D genetics over previous efforts that include GWAS that have contributed to our multi-ancestry meta-analysis6,10,11, demonstrating the opportunities to deliver new biological insights and identify novel target genes and mechanisms through which genetic variation impacts on disease risk. Annotation-informed multi-ancestry fine-mapping resolved 54.4% of distinct T2D association signals to a single variant with >50% posterior probability. Through integration of these fine-mapping data with molecular QTL resources, we identified a total of 117 candidate causal genes at T2D loci, of which 40 were not reported in complementary analyses undertaken in previous efforts (Supplementary Note). Formal Bayesian colocalization analyses across diverse tissues highlighted complex cell-type specific mechanisms through which regulatory variants at non-coding T2D association signals impact disease risk, exemplified by the BCAR1 and PROX1 loci, and lay the foundations for future functional investigations. Our study is the first to demonstrate the advantages of a GRS derived from multi-ancestry meta-regression for T2D prediction across five major ancestry groups. Finally, we built on our expanded collection of distinct multi-ancestry association signals to demonstrate evidence of positive selection of T2D risk alleles in African populations that may have been driven by the promotion of energy storage and usage through adaptation to the local environment.
Multi-ancestry meta-analysis maximizes power to detect association signals that are shared across ancestry groups. However, by modelling heterogeneity in allelic effects across ancestries, our meta-regression approach can also allow for association signals that are driven by ancestry-specific causal variants, although power will be limited by the sample size available in that ancestry group. Ancestry-specific variants tend to have lower frequency, with the result that discovery of T2D associations that are unique to African, Hispanic, or South Asian ancestry groups in our study will have been limited to those with relatively large effects. To address this limitation, it remains essential that the human genetics research community continues to bolster GWAS collections in underrepresented populations that often suffer the greatest burden of disease and to further expand diversity in imputation reference panels, as exemplified by the Trans-Omics for Precision Medicine (TOPMed) Program47. Increasing diversity in genetic research will ultimately provide a more comprehensive and refined view of the genetic contribution to complex human traits, powering understanding of the molecular and biological processes underlying common diseases, and offering the most promising opportunities for clinical translation of GWAS findings to improve global public health.
METHODS
Ethics statement.
All human research was approved by the relevant Institutional Review Boards and conducted according to the Declaration of Helsinki. All participants provided written informed consent. Study-level ethics statements are provided in the Supplementary Note.
Study-level analyses.
Individuals were assayed with a range of GWAS genotyping arrays, with sample and SNV quality control (QC) undertaken within each study (Supplementary Tables 2 and 4). Most GWAS were undertaken with individuals from one ancestry group (Supplementary Table 1), where population outliers were excluded using self-reported and genetic ancestry. For the remaining multi-ancestry GWAS (Supplementary Table 1), individuals were first assigned to an ancestry group using both self-reported and genetic ancestry, and analyses were then undertaken separately within each ancestry group. For each ancestry-specific GWAS, samples were pre-phased and imputed up to reference panels from the 1000 Genomes Project (phase 1, March 2012 release; phase 3, October 2014 release)12,13, Haplotype Reference Consortium14, or population-specific whole-genome sequencing48-50 (Supplementary Table 4). SNVs with poor imputation quality and/or minor allele count <5 were excluded from downstream association analyses (Supplementary Table 4). Association with T2D was evaluated in a regression framework, under an additive model in the dosage of the minor allele, with adjustment for age and sex (where appropriate), and additional study-specific covariates (Supplementary Table 4). Analyses accounted for structure (population stratification and/or familial relationships) by: (i) excluding related samples and adjusting for principal components derived from a genetic relatedness matrix (GRM) as additional covariates in the regression model; or (ii) incorporating a random effect for the GRM in a mixed model (Supplementary Table 4). Allelic effects and corresponding standard errors that were estimated from a linear (mixed) model were converted to the log-odds scale51. Study-level association summary statistics (P-values and standard error of allelic log-ORs) were corrected for residual structure, not accounted for in the regression analysis, by means of genomic control52 if the inflation factor was >1 (Supplementary Table 4).
Multi-ancestry meta-analyses.
To account for the different reference panels used for imputation, we considered autosomal bi-allelic SNVs that overlap the 1000 Genomes Project reference panel (phase 3, October 2014 release)13 and the Haplotype Reference Consortium reference panel14. We considered only those SNVs with MAF > 0.5% in haplotypes in at least one of the five ancestry groups (Supplementary Table 22) in the 1000 Genomes Project (phase 3, October 2014 release)13. We excluded SNVs that differed in allele frequency by >20% when comparing reference panels in the same subsets of samples.
The most powerful methods for discovery of novel loci through multi-ancestry meta-analysis allow for potential allelic effect heterogeneity between ancestry groups that cannot be accommodated in a fixed-effects model53. Random-effects meta-analysis allows for “unstructured” heterogeneity, but cannot allow for the expectation that GWAS from the same ancestry group are likely to have more similar allelic effects than those from different ancestry groups. Some of these limitations could be addressed with a two-stage hierarchical model (within and then between ancestry). However, we preferred a meta-regression approach, implemented in MR-MEGA15, which models allelic effect heterogeneity that is correlated with genetic ancestry by including axes of genetic variation as covariates to capture ancestral diversity between GWAS. We constructed a distance matrix of mean effect allele frequency differences between each pair of GWAS across a subset of 386,563 SNVs reported in all studies. We implemented multi-dimensional scaling of the distance matrix to obtain three principal components that defined axes of genetic variation to separate GWAS from the five ancestry groups (Extended Data Fig. 2).
For each SNV, we modelled allelic log-ORs across GWAS in a linear regression framework, weighted by the inverse of the variance of the effect estimates, incorporating the three axes of genetic variation as covariates. We tested for: (i) association with T2D allowing for allelic effect heterogeneity between GWAS that is correlated with ancestry; (ii) heterogeneity in allelic effects on T2D between GWAS that is correlated with ancestry; and (iii) residual allelic effect heterogeneity between GWAS due to unmeasured confounders. We corrected the meta-regression association P-values for inflation due to residual structure between GWAS using genomic control adjustment (allowing for four degrees of freedom): λTA = 1.052. We included SNVs reported in ≥50% of the total effective sample size (NTA ≥ 246,095) in downstream analyses.
We also aggregated association summary statistics across GWAS via fixed-effects meta-analysis using METAL54 and random-effects (RE2 model) meta-analysis using METASOFT55. Both meta-analyses were based on inverse-variance weighting of allelic log-ORs to obtain effect size estimates. We corrected standard errors for inflation due to residual structure between GWAS by genomic control adjustment: and . We assessed evidence for heterogeneity in allelic effects between GWAS by Cochran’s Q statistic.
Defining T2D loci.
We initially selected lead SNVs attaining genome-wide significant evidence of association (P < 5 x 10⁻⁸) in the multi-ancestry meta-regression that were separated by at least 500 kb. Loci were first defined by the flanking genomic interval mapping 500 kb up- and downstream of lead SNVs. Then, where lead SNVs were separated by less than 1 Mb, the corresponding loci were aggregated as a single locus. The lead SNV for each locus was then selected as the SNV with minimum association P-value.
Genome-wide significance threshold.
We considered haplotypes from the 1000 Genomes Project reference panel (phase 3, October 2014 release)13. We extracted autosomal bi-allelic SNVs that overlapped between reference panels used in study-level analyses. We estimated the effective number of independent SNVs across ancestry groups using LD-pruning in PLINK56 to be 9,966,662 at r2 > 0.557. We therefore chose a multi-ancestry genome-wide significance threshold by Bonferroni correction for the effective number of SNVs as P < 5 x 10⁻⁹. Exemplar power calculations are provided in the Supplementary Note.
Dissection of distinct multi-ancestry association signals.
We used iterative approximate conditioning, implemented in GCTA58, making use of forward selection and backward elimination, to identify index SNVs at multi-ancestry genome-wide significance (P < 5x 1 0−9). We used haplotypes from the 1000 Genomes Project reference panel (phase 3, October 2014 release)13 that were specific to each ancestry group (Supplementary Table 22) as a reference for LD between SNVs across loci in the approximate conditional analysis. Details of the iterative approximate conditioning are provided in the Supplementary Note.
Ancestry-specific meta-analyses.
We aggregated association summary statistics across GWAS via fixed-effects meta-analysis using METAL54 based on inverse-variance weighting of allelic log-OR to obtain effect size estimates. Details are provided in the Supplementary Note.
Fine-mapping resolution.
Within each locus, we approximated the Bayes’ factor59, Λij, in favor of T2D association of the jth SNV at the ith distinct association signal using summary statistics from: (i) the multi-ancestry meta-regression; (ii) the European ancestry-specific meta-analysis; and (iii) the combined East Asian and European ancestry meta-analysis. For loci with a single association signal, association summary statistics were obtained from unconditional analysis. For loci with multiple distinct association signals, association summary statistics were obtained from approximate conditional analyses. Details of the derivation of approximate Bayes’ factors are provided in the Supplementary Note. The posterior probability for the jth SNV at the ith distinct signal was then given by πij ∝ Λij. We derived a 99% credible set60 for the ith distinct association signal by: (i) ranking all SNVs according to their posterior probability πij; and (ii) including ranked SNVs until their cumulative posterior probability attains or exceeds 0.99.
Down-sampled multi-ancestry meta-regression.
We selected GWAS contributing to the multi-ancestry meta-regression to approximate the effective sample size of the European ancestry-specific meta-analysis and maintain the distribution of effective sample size across ancestry groups (Supplementary Table 10). The selected GWAS are summarized in the Supplementary Note. We conducted a “down-sampled” multi-ancestry meta-regression, implemented in MR-MEGA15, for the selected studies. For each SNV, we modelled allelic log-ORs across GWAS in a linear regression framework, weighted by the inverse of the variance of the effect estimates, incorporating the same three axes of genetic variation as covariates (Extended Data Fig. 2). We corrected the meta-regression association P-values for inflation due to residual structure between the selected GWAS using genomic control adjustment (allowing for four degrees of freedom): λTA* = 1.012. For each distinct association signal identified in the complete multi-ancestry meta-regression, we derived a 99% credible set60 using association summary statistics from the down-sampled multi-ancestry meta-regression. Details of the fine-mapping procedure are provided in the Supplementary Note.
Enrichment of T2D association signals in genomic annotations.
We mapped each SNV across T2D loci to three categories of functional and regulatory annotations: (i) genic regions, as defined by the GENCODE Project61, including protein-coding exons, and 3’ and 5’ UTRs as different annotations; (ii) chromatin immuno-precipitation sequence (ChIP-seq) binding sites for 165 transcription factors (161 proteins from the ENCODE Project62 and four additional factors assayed in primary pancreatic islets63); and (iii) 13 unique and recurrent chromatin states, including promoter, enhancer, transcribed, and repressed regions, in four T2D-relevant tissues18 (pancreatic islets, liver, adipose, and skeletal muscle). This resulted in a total of 220 genomic annotations for downstream enrichment analyses. We used fGWAS64 to identify a joint model of enriched annotations across distinct T2D association signals from the multi-ancestry meta-regression. Details are provided in the Supplementary Note.
Annotation informed fine-mapping.
Within each locus, for each distinct signal, we recalibrated the posterior probability of driving the T2D association for each SNV under an annotation-informed prior derived from the joint model of enriched annotations identified by fGWAS. Specifically, for the jth SNV at the ith distinct signal, the posterior probability πij ∝ γjΛij, where Λij is the Bayes’ factor in favor of T2D association. In this expression, the relative annotation-informed prior for the SNV is given by
where the summation is over the enriched annotations, is the estimated log-fold enrichment of the kth annotation from the final joint model, and zjk is an indicator variable taking the value 1 if the jth SNV maps to the kth annotation, and 0 otherwise. We derived a 99% credible set60 for the ith distinct association signal by: (i) ranking all SNVs according to their posterior probability πij; and (ii) including ranked SNVs until their cumulative posterior probability attains or exceeds 0.99.
Dissection of molecular QTLs in diverse tissues.
We accessed association summary statistics for molecular QTLs in diverse tissues from three published resources: (i) 3,622 circulating plasma proteins in 3,301 healthy blood donors of European ancestry from the INTERVAL Study21; (ii) pancreatic islet expression in 420 individuals of European ancestry from the InsPIRE Consortium23; and (iii) multi-tissue expression in 620 donors from the GTEx Project (release v7)22, including subcutaneous adipose (328 samples), visceral adipose (273 samples), brain hypothalamus (108 samples), liver (134 samples), and skeletal muscle (421 samples). We defined cis-molecular QTL as mapping within 1 Mb of the transcription start site of the gene. Recognising that molecular QTLs may also be driven by multiple causal variants, we dissected signals for each significant cis- and trans-pQTL (P < 1.5 x 10⁻¹¹) and for each significant cis-eQTL (FDR q-value < 5%) via approximate conditional analyses implemented in GCTA58. We used a genotype reference panel of 6,000 unrelated individuals of white British origin, randomly selected from the UK Biobank43, to model LD between SNVs. We excluded SNVs from the reference panel with poor imputation quality (info < 0.4) and/or significant deviation from Hardy-Weinberg equilibrium (P < 10−6). We first identified index SNVs for each distinct molecular QTL signal using the “--cojo-slct” option: P < 1.5 x 10⁻¹¹ for cis- and trans-pQTLs; and P < 5 x 10⁻⁸ for cis-eQTLs. For each molecular QTL with multiple index SNVs, we dissected each distinct signal using GCTA, removing each index SNV, and adjusting for the remainder, using the “--cojo-cond” option.
Colocalization of T2D associations and molecular QTLs.
For each distinct T2D association signal, we used COLOCv3.124 to assess the evidence for colocalization with: (i) each distinct cis- and trans-pQTL signal; and (ii) each distinct cis-eQTL signal across tissues. COLOC assumes that at most one variant is causal for each distinct T2D association and each distinct molecular QTL, which is reasonable after deconvolution of signals via approximate conditional analyses. Under this assumption, there are five hypotheses: association with neither T2D nor the molecular QTL (H0); association only with T2D (H1) or the molecular QTL (H2); or association with both T2D and the molecular QTL, driven either by two different causal variants (H3) or by the same causal variant (H4). We assumed the default prior probabilities of: (i) 10−4 that a variant is causal only for T2D or only for the molecular QTL; and (ii) 10−6 that a variant is causal for both T2D and the molecular QTL. To take account of our annotation-informed prior model of causality, we then replaced the Bayes’ factor in favor of T2D association, Λij, for the jth SNV at the ith distinct signal by πijΨi, where Ψi = ∑j Λij is the total Bayes’ factor for the signal. For the molecular QTLs, approximate Bayes’ factors in favor of association for each variant were derived using Wakefield’s method65. Under this model, COLOC then estimates the posterior probability of colocalization of the T2D association and molecular QTL (i.e. hypothesis H4, denoted πCOLOC).
Plasmid transfection and luciferase reporter assay.
We experimentally validated 99% credible set variants for distinct T2D association signals at the PROX1 locus using a luciferase reporter assay. Briefly, human EndoC-βH1 cells66 and human liver cells were grown at 50-60% confluence in 24-well plates and were transfected (2 x 10⁵ EndoC-βH1 cells/well and 5 x 10⁴ HepG2 cells/well) with 500 ng of empty pGL3-Promoter vector (Promega, Charbonnieres, France) or pGL3-Promoter-PROX_insert with FuGENE HD (Roche Applied Science, Meylan, France) using a FuGENE:DNA ratio of 6:1 according to the manufacturer’s instructions. Details are provided in the Supplementary Note and at https://www.promega.co.uk/products/luciferase-assays/genetic-reporter-vectors-and-cell-lines/pgl3-luciferase-reporter-vectors/?catNum=E1751. Luciferase activities were measured 48 hours after transfection using the Dual-Luciferase Reporter Assay kit (Promega) according to the manufacturer’s instructions, in half-volume 96-well tray format on an Enspire Multimode Plate Reader (PerkinElmer). The Firefly luciferase activity was normalized to the Renilla luciferase activity obtained by cotransfection of 10 ng of the pGL4.74[hRluc/TK] Renilla luciferase vector (Promega). All experiments were performed in triplicate in three different passages of each cell type. Differences in luciferase activity between groups were tested using two-tailed two-sample t-tests, where P < 0.05 was considered statistically significant.
Transferability of GRS across ancestry groups.
We selected two studies per ancestry group as test GWAS, prioritizing those with larger effective sample sizes and greater genetic diversity (Supplementary Note). We repeated the multi-ancestry meta-regression, after excluding the ten test GWAS, incorporating the same three axes of genetic variation as covariates to account for ancestry. The association P-values from this “reduced” meta-regression were then corrected for inflation due to residual structure between GWAS by means of genomic control adjustment (allowing for four degrees of freedom): λTA = 1.037. SNVs reported in ≥50% of the total effective sample size of the “reduced” meta-regression (NTE ≥ 179,074) were included in downstream analyses. We identified loci attaining genome-wide significant evidence of association (P < 5 x 10⁻⁹) in the “reduced” meta-regression, and the lead SNV for each locus was selected as the variant with minimum association P-value. For each test GWAS, we next estimated population-specific “predicted” allelic effects for each lead SNV to be used as weights in the GRS. We also repeated each of the ancestry-specific fixed-effects meta-analyses after excluding the ten test GWAS, and identified lead SNVs attaining genome-wide significant evidence of association (P < 5 x 10⁻⁸). For each test GWAS, we estimated the OR per unit of the population-specific multi-ancestry GRS and each ancestry-specific weighted GRS, and the corresponding percentage of T2D variance explained (pseudo R2). Details are provided in the Supplementary Note.
Predictive power of GRS in FinnGen.
Individuals from FinnGen were genotyped with Illumina and Affymetrix arrays, and were imputed up to the Finnish population-specific reference panel (SISu version 3). We excluded individuals due to non-Finnish ancestry, relatedness, or missing age and/or sex. We derived Finnish-specific “predicted” allelic effect estimates for each lead SNV from the multi-ancestry meta-regression to be used as weights in calculating the centred GRS for each individual. We excluded lead SNVs from the GRS that were not reported in FinnGen. We excluded individuals with missing T2D status or BMI from subsequent analyses, resulting in a total of 18,111 affected individuals and 111,119 unaffected individuals. We calculated the variance in T2D status explained (pseudo R2) and the AUROC (calculated with a 10-fold cross-validation) for models including BMI and/or GRS. We also conducted age-stratified analyses and tested for association of the GRS with age of T2D diagnosis. Details are provided in the Supplementary Note.
Selection analyses.
We used Relate42 to reconstruct genealogies for haplotypes from the 1000 Genomes Project reference panel (phase 3, October 2014 release)13, separately for each population, after excluding African American and admixed American populations in whom high levels of admixture are likely to confound selection evidence. We then used P-values calculated for selection evidence for any variant that segregated in the population and passed quality control filters42, which quantify the extent to which the mutation has more descendants than other lineages that were present when it arose. We tested for evidence of selection for index SNVs for distinct T2D association signals, which were partitioned into two groups, risk and protective, according to the direction of the allelic effect when aligned to the derived allele. We also tested for selection on a range of traits available in the UK Biobank43 at the subset of index SNVs for which the derived allele increased risk of T2D. Details are provided in the Supplementary Note.
Extended Data
Extended Data Fig. 1. Study overview.
Summary of data resources and downstream analyses to identify candidate causal genes at T2D susceptibility loci.
Extended Data Fig. 2. Axes of genetic variation separating GWAS of T2D across diverse populations.
The first three axes of genetic variation (PC 1, PC 2 and PC 3) from multi-dimensional scaling of the Euclidean distance matrix between populations are sufficient to separate five ancestry groups: African (AFR), East Asian (EAS), European (EUR), Hispanic (HIS) and South Asian (SAS). The second axis of genetic variation (PC 2) separates African American and continental African GWAS. The third axis of genetic variation (PC 3) reveals finer-scale differences between GWAS within ancestry groups: Hispanic studies with a greater proportion of American ancestry (SIGMA (2), MC (1) and MC (2)) or African ancestry (WHI, MESA, HCHS/SOL and BIOME); East Asian studies of Chinese, Japanese and Korean ancestry from those of Malay and Filipino ancestry (SIMES and CLHNS); South Asian studies of Sri Lankan, Bangladeshi and South Indian ancestry (RHS, EPIDREAM, SINDI, GRCCDS and BPC) from those of North Indian and Pakistani ancestry; and Northern European ancestry studies from the study of Greek ancestry from Southern Europe (GOMAP). GWAS were aligned to ancestry groups based on self-report at the study level.
Extended Data Fig. 3. Manhattan plot of genome-wide T2D association from multi-ancestry meta-regression (MR-MEGA) of up to 180,834 cases and 1,159,055 controls.
Each point represents an SNV passing quality control in the multi-ancestry meta-regression, plotted with their association P-value (on a −log10 scale, truncated at 300) as a function of genomic position (NCBI build 37). Association signals attaining genome-wide significance are highlighted in pale blue (P < 5 x 10⁻⁹) and dark blue (P < 5 x 10⁻⁸). The names of novel loci names are highlighted with their association P-value from the multi-ancestry meta-regression.
Extended Data Fig. 4. Comparison of association P-values at lead SNVs at T2D loci between multi-ancestry meta-regression (MR-MEGA), fixed-effects meta-analysis and random-effects (RE2) meta-analysis of up to 180,834 cases and 1,159,055 controls.
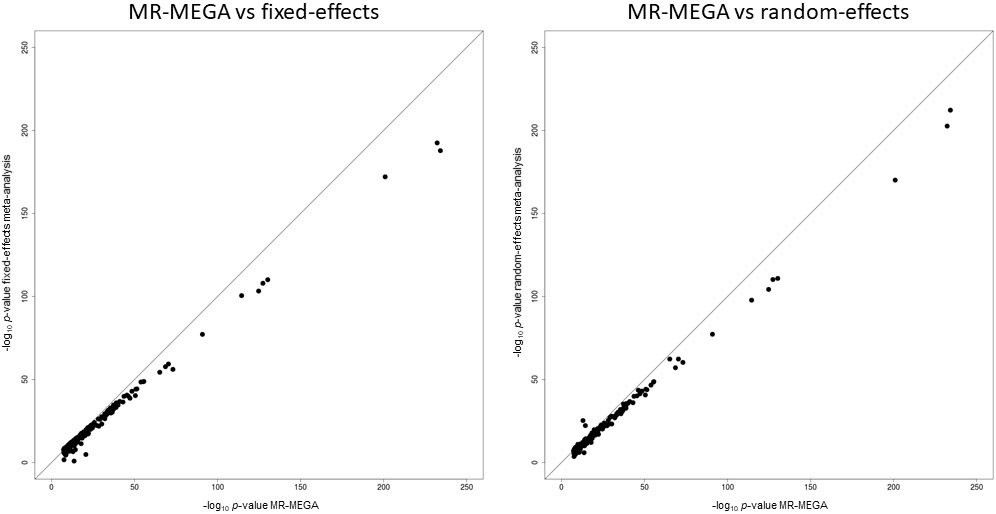
Each point corresponds to an SNV, plotted according to P-values (on a −log10 scale) from MR-MEGA on the x-axis and fixed- or random-effects meta-analysis on the y-axis. SNVs below the y = x line demonstrate stronger association with MR-MEGA. The lead SNV at the TCF7L2 locus has been removed to improve clarity of presentation.
Extended Data Fig. 5. Comparison of loci identified at genome-wide significance (P < 5 x 10⁻⁸) in multi-ancestry meta-regression (180,834 cases and 1,159,055 controls), and East Asian and European ancestry-specific meta-analyses (56,268 cases and 227,155 controls, and 80,154 cases and 853,816 controls, respectively).
a, Association P-values at loci identified in East Asian and European ancestry-specific meta-analyses. Each point corresponds to a locus, plotted according to the P-value (on a −log10 scale) for the lead SNP in the multi-ancestry meta-regression on the x-axis and the lead SNP in the ancestry-specific meta-analysis on the y-axis. The TCF7L2 locus has been removed to improve clarity of presentation. Loci plotted below the y = x line show stronger evidence for association in the multi-ancestry meta-regression. b, Overlap of loci identified in multi-ancestry meta-regression and ancestry-specific meta-analyses.
Extended Data Fig. 6. Summary statistics from joint fGWAS model of enriched functional and regulatory annotations across distinct T2D association signals from multi-ancestry meta-regression (MR-MEGA) of up to 180,834 cases and 1,159,055 controls.
Each point corresponds to an annotation, plotted for the log-enrichment for T2D association on the x-axis, with bars representing the corresponding 95% confidence interval (CI).
Extended Data Fig. 7. Comparison of number of SNVs in 99% credible set for distinct association signals for T2D obtained from the multi-ancestry meta-regression of 180,834 cases and 1,159,055 controls under uniform and annotation-informed prior models of causality.
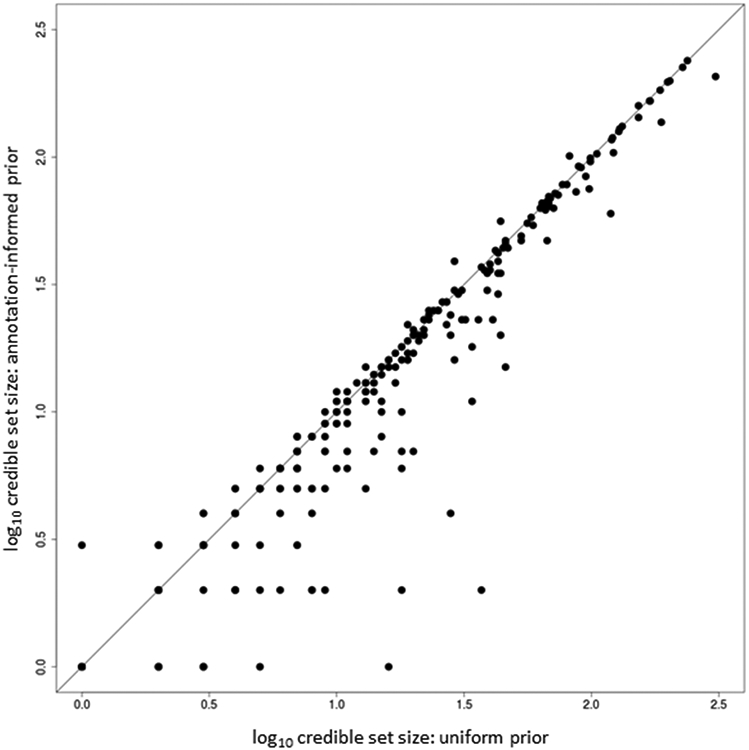
Each point corresponds to a distinct association signal, plotted according to the log10 credible set size under the uniform prior on the x-axis and the log10 credible set size under the annotation-informed prior on the y-axis. The 144 (42.6%) signals below the y = x line were more precisely fine-mapped under the annotation-informed prior.
Extended Data Fig. 8. Differences in LD structure between ancestry groups at the PROX1 locus for distinct association signals from multi-ancestry meta-regression (MR-MEGA) of up to 180,840 cases and 1,159,185 controls.
Each point represents an SNV passing quality control in the multi-ancestry meta-regression (after conditional analysis), plotted with their association P-value (on a log10 scale) as a function of genomic position (NCBI build 37). The index SNV is represented by the purple symbol. The color coding of all other SNVs indicates LD with the index variant in the ancestry-matched reference haplotypes from the 1000 Genomes Project panel: red, r2 ≥ 0.8; gold, 0.6 ≤ r2 < 0.8; green, 0.4 ≤ r2 < 0.6; cyan, 0.2 ≤ r2 < 0.4; blue, r2 < 0.2; grey, r2 unknown. Recombination rates are estimated from Phase II HapMap and gene annotations are taken from the University of California Santa Cruz genome browser.
Extended Data Fig. 9. Power of multi-ancestry GRS to predict T2D status in 129,230 individuals of Finnish ancestry from FinnGen.
a, Age under receiver operating characteristic curve (AUROC) after adding BMI and GRS to a baseline model adjusting for age and sex. b, Prevalence of T2D across GRS deciles. c, Boxplot of the distribution of age at T2D diagnosis across GRS deciles: box defines upper quartile, median and lower quartile, bars define maximum and minimum values within 1.5 x interquartile range of the upper and lower quartiles, other points are outliers.
Extended Data Fig. 10. Evidence for selection from Relate in African ancestry populations of subsets of T2D risk variants (effect aligned to derived allele) that are associated with other traits available in the UK Biobank.
Nominal evidence for selection (P < 0 .05) is indicated by the dashed line. The color of each point indicates the evidence for selection of subsets of T2D risk variants that are not associated with the other trait: P < 0.05 (pink) and P ≥ 0.05 (black). Population abbreviations: ESN, Esan in Nigeria; GWD, Gambian in Western Divisions in the Gambia; LWK, Luhya in Webuye, Kenya; MSL, Mende in Sierra Leone; YRI, Yoruba in Ibadan, Nigeria.
Supplementary Material
ACKNOWLEDGEMENTS
A complete list acknowledgments and funding appears in the Supplementary Note. This research was funded in whole, or in part, by the Wellcome Trust (grant numbers 064890, 072960, 083948, 084723, 085475, 086113, 088158, 090367, 090532, 095101, 098017, 098051, 098381, 098395, 101033, 101630, 104085, 106130, 200186, 200837, 202922, 203141, 206194, 212259, 212284, 212946, 220457). For the purpose of Open Access, the authors have applied a CC-BY public copyright licence to any Author Accepted Manuscript version arising from this submission.
Appendix
CONSORTIA
FinnGen
Sina Rüeger14 and Pietro della Briotta Parolo14
Contributors to FinnGen are listed in the Supplementary Note.
eMERGE Consortium
Yoonjung Yoonie Joo68,69, Abel N. Kho144,145, and M. Geoffrey Hayes68,247,248
Contributors to the eMERGE Consortium are listed in the Supplementary Note.
Footnotes
COMPETING INTERESTS
A. Mahajan is now an employee of Genentech and a holder of Roche stock. R.A.S. is now an employee of GlaxoSmithKline. V.S. is an employee of deCODE genetics/Amgen Inc. L.S.E. is now an employee of Bristol Myers Squibb. J.S.F. has consulted for Shionogi Inc. T.M.F has consulted for Sanofi, Boerhinger Ingelheim and received funding from GSK. H.C.G. holds the McMaster-Sanofi Population Health Institute Chair in Diabetes Research and Care; reports research grants from Eli Lilly, AstraZeneca, Merck, Novo Nordisk and Sanofi; honoraria for speaking from AstraZeneca, Boehringer Ingelheim, Eli Lilly, Novo Nordisk, DKSH, Zuellig, Roche, and Sanofi; and consulting fees from Abbott, AstraZeneca, Boehringer Ingelheim, Eli Lilly, Merck, Novo Nordisk, Pfizer, Sanofi, Kowa and Hanmi. M. Ingelsson is a paid consultant to BioArctic AB. R.L.-G. is a part-time consultant of Metabolon Inc. A.E.L. is now an employee of Regeneron Genetics Center, LLC and holds shares in Regeneron Pharmaceuticals. M.A.N. currently serves on the scientific advisory board for Clover Therapeutics and is an advisor to Neuron23 Inc. S.R.P. has received grant funding from Bayer Pharmaceuticals, Philips Respironics and Respicardia. N.S. has consulted for or been on speakers bureau for Abbott, Amgen, Astrazeneca, Boehringer Ingelheim, Eli Lilly, Hanmi, Novartis, Novo Nordisk, Sanofi and Pfizer and has received grant funding from Astrazeneca, Boehringer Ingelheim, Novartis and Roche Diagnostics. A.M.S. receives funding from Seven Bridges Genomics to develop tools for the NHLBI BioData Catalyst consortium. G.T. is an employee of deCODE genetics/Amgen Inc. U.T. is an employee of deCODE genetics/Amgen Inc. E. Ingelsson is now an employee of GlaxoSmithKline. B.M.P. serves on the Steering Committee of the Yale Open Data Access Project funded by Johnson & Johnson. R.C.W.M. reports research funding from AstraZeneca, Bayer, Novo Nordisk, Pfizer, Tricida Inc. and Sanofi, and has consulted for or received speakers fees from AstraZeneca, Bayer, Boehringer Ingelheim, all of which have been donated to the Chinese University of Hong Kong to support diabetes research. D.O.M.-K. is a part-time clinical research consultant for Metabolon Inc. S. Liu reports consulting payments and honoraria or promises of the same for scientific presentations or reviews at numerous venues, including but not limited to Barilla, by-Health Inc, Ausa Pharmed Co.LTD, Fred Hutchinson Cancer Center, Harvard University, University of Buffalo, Guangdong General Hospital and Academy of Medical Sciences, Consulting member for Novo Nordisk, Inc; member of the Data Safety and Monitoring Board for a trial of pulmonary hypertension in diabetes patients at Massachusetts General Hospital; receives royalties from UpToDate; receives an honorarium from the American Society for Nutrition for his duties as Associate Editor. K. Stefansson is an employee of deCODE genetics/Amgen Inc. K.J.G. does consulting for Genentech and holds stock in Vertex Pharmaceuticals. A.L.G.’s spouse is an employee of Genentech and holds stock options in Roche. M.I.M. has served on advisory panels for Pfizer, NovoNordisk and Zoe Global, has received honoraria from Merck, Pfizer, Novo Nordisk and Eli Lilly, and research funding from Abbvie, Astra Zeneca, Boehringer Ingelheim, Eli Lilly, Janssen, Merck, NovoNordisk, Pfizer, Roche, Sanofi Aventis, Servier, and Takeda; is now an employee of Genentech and a holder of Roche stock. The remaining authors declare no competing interests.
The views expressed in this article are those of the authors and do not necessarily represent those of: the NHS, the NIHR, or the UK Department of Health; the National Heart, Lung, and Blood Institute, the National Institutes of Health, or the US Department of Health and Human Services.
Data availability statement.
Association summary statistics from the multi-ancestry meta-analysis and annotation-informed fine-mapping are available through the AMP-T2D Knowledge Portal (http://www.type2diabetesgenetics.org/) and the DIAGRAM Consortium Data Download website (http://diagram-consortium.org/downloads.html).
REFERENCES
- 1.NCD Risk Factor Collaboration. Worldwide trends in diabetes since 1980: a pooled analysis of 751 population-based studies with 4. 4 million participants. Lancet 387, 1513–1530 (2016). [DOI] [PMC free article] [PubMed] [Google Scholar]
- 2.GBD 2015 Disease and Injury Incidence and Prevalence Collaborators. Global, regional, and national incidence, prevalence, and years lived with disability for 310 diseases and injuries, 1990-2015: a systematic analysis for the Global Burden of Disease Study 2015. Lancet 388, 1545–1602 (2016). [DOI] [PMC free article] [PubMed] [Google Scholar]
- 3.Voight BF et al. Twelve type 2 diabetes susceptibility loci identified through large-scale association analysis. Nat. Genet 42, 579–589 (2010). [DOI] [PMC free article] [PubMed] [Google Scholar]
- 4.Morris AP et al. Large-scale association analysis provides insights into the genetic architecture and pathophysiology of type 2 diabetes. Nat. Genet 44, 981–990 (2012). [DOI] [PMC free article] [PubMed] [Google Scholar]
- 5.Scott RA et al. An expanded genome-wide association study of type 2 diabetes in Europeans. Diabetes 66, 2888–2902 (2017). [DOI] [PMC free article] [PubMed] [Google Scholar]
- 6.Mahajan A et al. Fine-mapping type 2 diabetes loci to single-variant resolution using high-density imputation and islet-specific epigenome maps. Nat. Genet 50, 1505–1513 (2018). [DOI] [PMC free article] [PubMed] [Google Scholar]
- 7.Moltke I et al. A common Greenlandic TBC1D4 variant confers muscle insulin resistance and type 2 diabetes. Nature 512, 190–193 (2014). [DOI] [PubMed] [Google Scholar]
- 8.Martin AR et al. Human demographic history impacts genetic risk prediction across diverse populations. Am. J. Hum. Genet 100, 635–649 (2017). [DOI] [PMC free article] [PubMed] [Google Scholar]
- 9.Suzuki K et al. Identification of 28 new susceptibility loci for type 2 diabetes in the Japanese population. Nat. Genet 51, 379–386 (2019). [DOI] [PubMed] [Google Scholar]
- 10.Spracklen CN et al. Identification of type 2 diabetes loci in 433,540 East Asian individuals. Nature 582, 240–245 (2020). [DOI] [PMC free article] [PubMed] [Google Scholar]
- 11.Vujkovic M et al. Discovery of 318 new risk loci for type 2 diabetes and related vascular outcomes among 1. 4 million participants in a multi-ancestry meta-analysis. Nat. Genet 52, 680–691 (2020). [DOI] [PMC free article] [PubMed] [Google Scholar]
- 12.The 1000 Genomes Project Consortium. An integrated map of genetic variation from 1,092 human genomes. Nature 491, 56–65 (2012). [DOI] [PMC free article] [PubMed] [Google Scholar]
- 13.The 1000 Genomes Project Consortium. A global reference for human genetic variation. Nature 526, 68–74 (2015). [DOI] [PMC free article] [PubMed] [Google Scholar]
- 14.McCarthy S et al. A reference panel of 64,976 haplotypes for genotype imputation. Nat. Genet 48, 1279–1283 (2016). [DOI] [PMC free article] [PubMed] [Google Scholar]
- 15.Mägi R et al. Trans-ethnic meta-regression of genome-wide association studies accounting for ancestry increases power for discovery and improves fine-mapping resolution. Hum. Mol. Genet 26, 3639–3650 (2017). [DOI] [PMC free article] [PubMed] [Google Scholar]
- 16.Chen M-H et al. Trans-ethnic and ancestry-specific blood-cell genetics in 746,667 individuals from 5 global populations. Cell 182, 1198–1213 (2020). [DOI] [PMC free article] [PubMed] [Google Scholar]
- 17.Mahajan A et al. Refining the accuracy of validated target identification through coding variant fine-mapping in type 2 diabetes. Nat. Genet 50, 559–571 (2018). [DOI] [PMC free article] [PubMed] [Google Scholar]
- 18.Varshney A et al. Genetic regulatory signatures underlying islet gene expression and type 2 diabetes. Proc. Natl. Acad. Sci. U. S. A 114, 2301–2306 (2017). [DOI] [PMC free article] [PubMed] [Google Scholar]
- 19.Zhao F et al. Nodal induces apoptosis through activation of the ALK7 signaling pathway in pancreatic INS-1 β-cells. Am. J. Physiol. Endocrinol. Metab 303, E132–43 (2012). [DOI] [PMC free article] [PubMed] [Google Scholar]
- 20.Emdin CA et al. DNA sequence variation in ACVR1C encoding the activin receptor-like kinase 7 influences body fat distribution and protects against type 2 diabetes. Diabetes 68, 226–234 (2019). [DOI] [PMC free article] [PubMed] [Google Scholar]
- 21.Sun BB et al. Genomic atlas of the human plasma proteome. Nature 558, 73–79 (2018). [DOI] [PMC free article] [PubMed] [Google Scholar]
- 22.Consortium GTEx. Genetic effects on gene expression across human tissues. Nature 550, 204–213 (2017). [DOI] [PMC free article] [PubMed] [Google Scholar]
- 23.Vinuela A et al. Genetic variant effects on gene expression in human pancreatic islets and their implications for T2D. Nat. Commun 11, 4912 (2020). [DOI] [PMC free article] [PubMed] [Google Scholar]
- 24.Giambartolomei C et al. Bayesian test for colocalization between pairs of genetic association studies using summary statistics. PLoS Genet. 10, e1004383 (2014). [DOI] [PMC free article] [PubMed] [Google Scholar]
- 25.van de Bunt M et al. Transcript expression data from human islets links regulatory signals from genome-wide association studies for type 2 diabetes and glycemic traits to their downstream effectors. PLoS Genet. 11, e1005694 (2015). [DOI] [PMC free article] [PubMed] [Google Scholar]
- 26.Roman TS et al. A type 2 diabetes-associated functional regulatory variant in a pancreatic islet enhancer at the ADCY5 locus. Diabetes 66, 2521–2530 (2017). [DOI] [PMC free article] [PubMed] [Google Scholar]
- 27.Carrat GR et al. Decreased STARD10 expression is associated with defective insulin secretion in humans and mice. Am. J. Hum. Genet 100, 238–256 (2017). [DOI] [PMC free article] [PubMed] [Google Scholar]
- 28.Small KS et al. Regulatory variants at KLF14 influence type 2 diabetes risk via a female-specific effect on adipocyte size and body composition. Nat. Genet 50, 572–580 (2018). [DOI] [PMC free article] [PubMed] [Google Scholar]
- 29.Thurner M et al. Integration of human pancreatic islet genomic data refines regulatory mechanisms at type 2 diabetes susceptibility loci. Elife 7, e31977 (2018). [DOI] [PMC free article] [PubMed] [Google Scholar]
- 30.Pan DZ et al. Integration of human adipocyte chromosomal interactions with adipose gene expression prioritizes obesity-related genes from GWAS. Nat. Commun 9, 1512 (2018). [DOI] [PMC free article] [PubMed] [Google Scholar]
- 31.Miguel-Escalada I et al. Human pancreatic islet three-dimensional chromatin architecture provides insights into the genetics of type 2 diabetes. Nat. Genet 51, 1137–1148 (2019). [DOI] [PMC free article] [PubMed] [Google Scholar]
- 32.Chesi A et al. Genome-scale Capture C promoter interactions implicate effector genes at GWAS loci for bone mineral density. Nat. Commun 10, 1260 (2019). [DOI] [PMC free article] [PubMed] [Google Scholar]
- 33.Chiou J et al. Single-cell chromatin accessibility reveals pancreatic islet cell type- and state-specific regulatory programs of diabetes risk. Nat. Genet 53, 455–466 (2021). [DOI] [PMC free article] [PubMed] [Google Scholar]
- 34.Esteghamat F et al. CELA2A mutations predispose to early-onset atherosclerosis and metabolic syndrome and affect plasma insulin and platelet activation. Nat. Genet 51, 1233–1243 (2019). [DOI] [PMC free article] [PubMed] [Google Scholar]
- 35.Ng NHJ et al. Tissue-specific alteration of metabolic pathways influences glycemic regulation. Preprint at https://www.biorxiv.org/content/10.1101/790618v1 (2019). [Google Scholar]
- 36.Gloyn AL Exocrine or endocrine? A circulating pancreatic elastase that regulates glucose homeostasis. Nat. Metab 1, 853–855 (2019). [DOI] [PubMed] [Google Scholar]
- 37.Wesolowska-Andersen A et al. Deep learning models predict regulatory variants in pancreatic islets and refine type 2 diabetes association signals. Elife 9, e51503 (2020). [DOI] [PMC free article] [PubMed] [Google Scholar]
- 38.Martin AR et al. Clinical use of current polygenic risk scores may exacerbate health disparities. Nat. Genet 51, 584–591 (2019). [DOI] [PMC free article] [PubMed] [Google Scholar]
- 39.Mars N et al. Polygenic and clinical risk scores and their impact on age at onset and prediction of cardiometabolic diseases and common cancers. Nat. Med 26, 549–557 (2020). [DOI] [PubMed] [Google Scholar]
- 40.Ayub Q et al. Revisiting the thrifty gene hypothesis via 65 loci associated with susceptibility to type 2 diabetes. Am. J. Hum. Genet 94, 176–185 (2014). [DOI] [PMC free article] [PubMed] [Google Scholar]
- 41.Neel JV Diabetes mellitus: a “thrifty” genotype rendered detrimental by “progress”? Am. J. Hum. Genet 14, 353–362 (1962). [PMC free article] [PubMed] [Google Scholar]
- 42.Speidel L, Forest M, Shi S & Myers SR A method for genome-wide genealogy estimation for thousands of samples. Nat. Genet 51, 1321–1329 (2019). [DOI] [PMC free article] [PubMed] [Google Scholar]
- 43.Bycroft C et al. The UK Biobank resource with deep phenotyping and genomic data. Nature 562, 203–209 (2018). [DOI] [PMC free article] [PubMed] [Google Scholar]
- 44.Chen R et al. Type 2 diabetes risk alleles demonstrate extreme directional differentiation among human populations, compared to other diseases. PLoS Genet. 8, e1002621 (2012). [DOI] [PMC free article] [PubMed] [Google Scholar]
- 45.Lewis ACF et al. Getting genetic ancestry right for science and society. Preprint at https://arxiv.org/abs/2110.05987v2 (2021). [DOI] [PMC free article] [PubMed] [Google Scholar]
- 46.Kanai M et al. Insights from complex trait fine-mapping across diverse populations. Preprint at https://www.medrxiv.org/content/10.1101/2021.09.03.21262975v1 (2021). [Google Scholar]
- 47.Taliun D et al. Sequencing of 53,831 diverse genomes from the NHLBI TOPMed Program. Nature 590, 290–299 (2021). [DOI] [PMC free article] [PubMed] [Google Scholar]
- 48.Jónsson H et al. Whole genome characterization of sequence diversity of 15,220 Icelanders. Sci. Data 4, 170115 (2017). [DOI] [PMC free article] [PubMed] [Google Scholar]
- 49.Mitt M et al. Improved imputation accuracy of rare and low-frequency variants using population-specific high-coverage WGS-based imputation reference panel. Eur. J. Hum. Genet 25, 869–876 (2017). [DOI] [PMC free article] [PubMed] [Google Scholar]
- 50.Moon S et al. The Korea Biobank Array: design and identification of coding variants associated with blood biochemical traits. Sci. Rep 9, 1382 (2019). [DOI] [PMC free article] [PubMed] [Google Scholar]
- 51.Cook JP, Mahajan A & Morris AP Guidance for the utility of linear models in meta-analysis of genetic association studies of binary phenotypes. Eur. J. Hum. Genet 25, 240–245 (2016). [DOI] [PMC free article] [PubMed] [Google Scholar]
- 52.Devlin B & Roeder K Genomic control for association studies. Biometrics 55, 997–1004 (1999). [DOI] [PubMed] [Google Scholar]
- 53.Gurdasani D, Barroso I, Zeggini E & Sandhu MS Genomics of disease risk in globally diverse populations. Nat. Rev. Genet 20, 520–535 (2019). [DOI] [PubMed] [Google Scholar]
- 54.Willer CJ, Li Y & Abecasis GR METAL: fast and efficient meta-analysis of genome-wide association scans. Bioinformatics 26, 2190–2191 (2010). [DOI] [PMC free article] [PubMed] [Google Scholar]
- 55.Han B & Eskin E Random-effects model aimed at discovering associations in meta-analysis of genome-wide association studies. Am. J. Hum. Genet 88, 586–598 (2011). [DOI] [PMC free article] [PubMed] [Google Scholar]
- 56.Purcell S et al. PLINK: a tool set for whole-genome association and population-based linkage analyses. Am. J. Hum. Genet 81, 559–575 (2007). [DOI] [PMC free article] [PubMed] [Google Scholar]
- 57.Sobota RS et al. Addressing population-specific multiple testing burdens in genetic association studies. Ann. Hum. Genet 79, 136–147 (2015). [DOI] [PMC free article] [PubMed] [Google Scholar]
- 58.Yang J et al. Conditional and joint multiple-SNP analysis of GWAS summary statistics identifies additional variants influencing complex traits. Nat. Genet 44, 369–375 (2012). [DOI] [PMC free article] [PubMed] [Google Scholar]
- 59.Kass RE & Raftery AE (1995). Bayes factors. J. Am. Stat. Assoc 90, 773–795 (1995). [Google Scholar]
- 60.Maller JB et al. Bayesian refinement of association signals for 14 loci in 3 common diseases. Nat. Genet 44, 1294–1301 (2012). [DOI] [PMC free article] [PubMed] [Google Scholar]
- 61.Harrow J et al. GENCODE: the reference human genome annotation for The ENCODE Project. Genome Res. 22, 1760–1774 (2012). [DOI] [PMC free article] [PubMed] [Google Scholar]
- 62.ENCODE Project Consortium. An integrated encyclopedia of DNA elements in the human genome. Nature 489, 57–74 (2012). [DOI] [PMC free article] [PubMed] [Google Scholar]
- 63.Pasquali L et al. Pancreatic islet enhancer clusters enriched in type 2 diabetes risk-associated variants. Nat. Genet 46, 136–143 (2014). [DOI] [PMC free article] [PubMed] [Google Scholar]
- 64.Pickrell J Joint analysis of functional genomic data and genome-wide association studies of 18 human traits. Am. J. Hum. Genet 94, 559–573 (2014). [DOI] [PMC free article] [PubMed] [Google Scholar]
- 65.Wakefield JA Bayesian measure of the probability of false discovery in genetic epidemiology studies. Am. J. Hum. Genet 81, 208–227 (2007). [DOI] [PMC free article] [PubMed] [Google Scholar]
- 66.Ravassard P et al. A genetically engineered human pancreatic β cell line exhibiting glucose-inducible insulin secretion. J. Clin. Invest 121, 3589–3597 (2011). [DOI] [PMC free article] [PubMed] [Google Scholar]
Associated Data
This section collects any data citations, data availability statements, or supplementary materials included in this article.
Supplementary Materials
Data Availability Statement
Association summary statistics from the multi-ancestry meta-analysis and annotation-informed fine-mapping are available through the AMP-T2D Knowledge Portal (http://www.type2diabetesgenetics.org/) and the DIAGRAM Consortium Data Download website (http://diagram-consortium.org/downloads.html).


