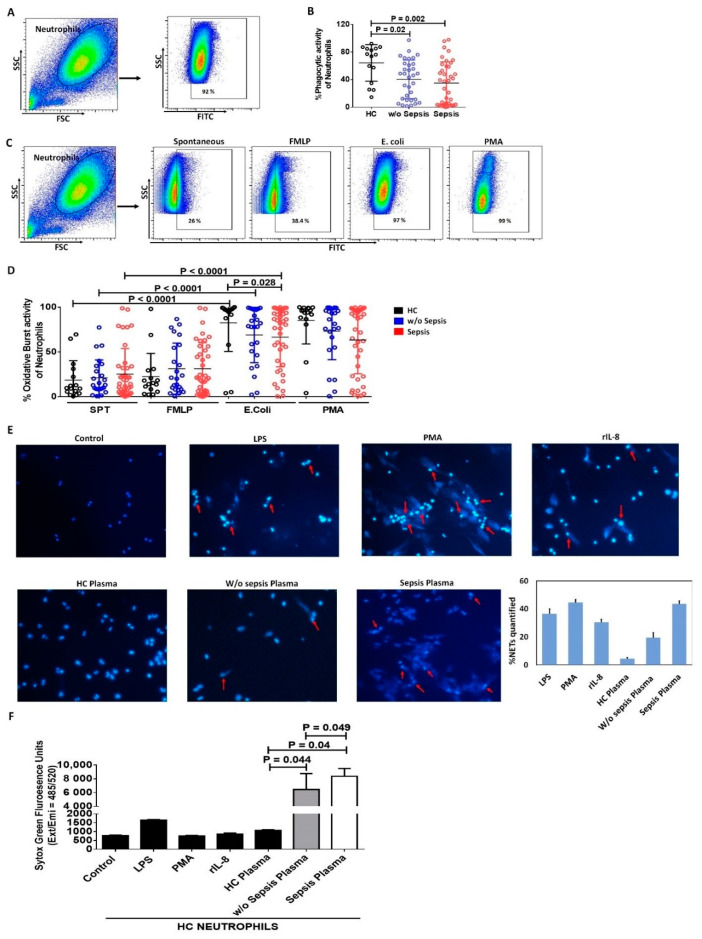
Figure 2.
Functionality of neutrophils. (A) Gating strategy for phagocytic activity of neutrophils. (B) Scatter dot plot shows phagocytic activity of neutrophils between the groups. (C) Gating strategy for oxidative burst activity of neutrophils both spontaneously and stimulation with FMLP, E. coli and PMA. (D) Scatter dot plot shows oxidative burst activity of neutrophils between the groups. (E) Representative images of NETs in healthy control neutrophils without and with stimulation i.e., LPS, PMA, rIL-8, HC plasma, w/o sepsis and sepsis patient plasma at 40× along with the % NETs quantification using ImageJ software. (F) Cell free DNA was estimated using sytox green fluorescence units captured on exi/emi = 485/520 in supernatant without and with stimulation. SPT (spontaneous), LPS (Lipopolysaccharide), PMA (Phorbol 12-myristate 13-acetate), rIL-8 (recombinant IL-8). Results are expressed as the mean ± SD; One-way ANOVA/Kruskal–wallis test followed by probability adjustment by the Mann–Whitney.

