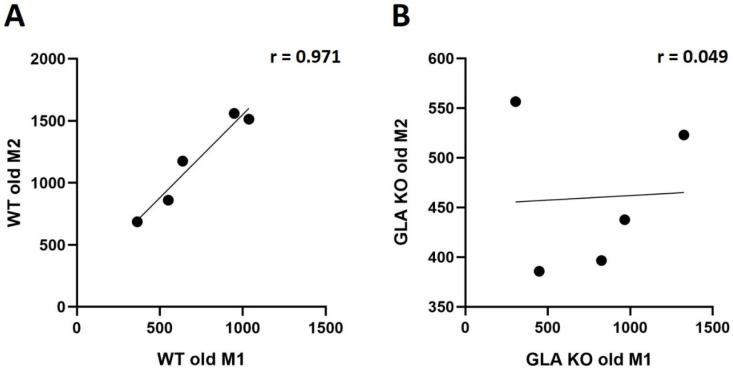
Figure 4.
M1/M2 ratio analysis in DRG of old WT and GLA KO mice. (A) Pearson’s correlation analysis of M1 and M2 distribution in DRG of old WT mice (r = 0.971, p < 0.01). (B) Pearson’s correlation analysis of M1 and M2 distribution in DRG of old GLA KO mice (r = 0.049, p > 0.05). Abbreviations: DRG = dorsal root ganglia; GLA KO = alpha-galactosidase A knockout; r = Pearson’s correlation coefficient; WT = wildtype.

