Figure 1.
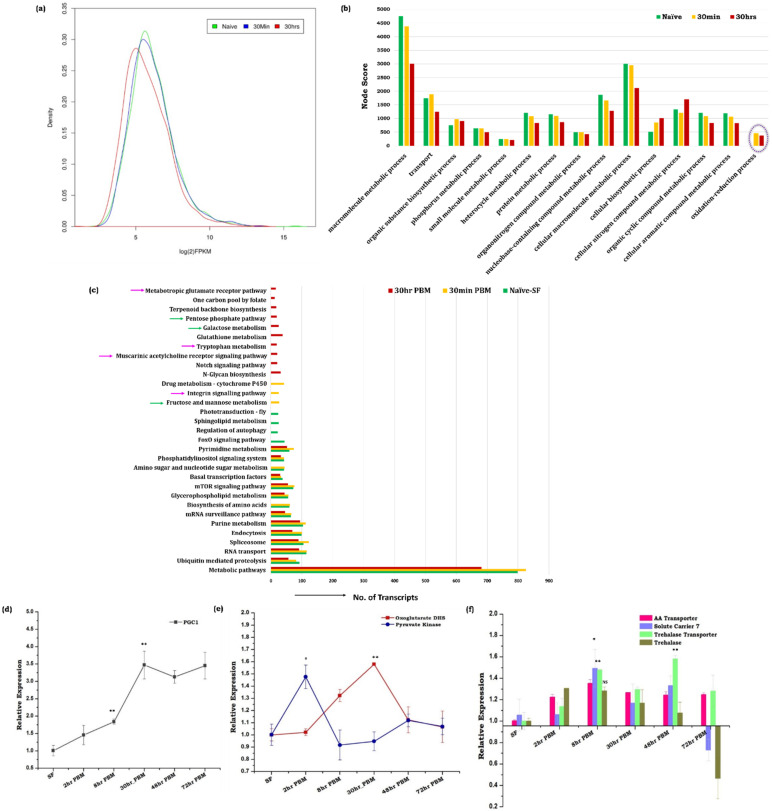
Blood meal causes notable changes in the molecular architecture of the brain tissue. (a) Comparison of the read density map of the naïve, 30 min, and 30 h post blood meal (PBM) transcriptomic data of brain tissue (n = 25); (b) Functional annotation and molecular cataloging of brain transcriptome (Biological Process/Level4/Node score). Purple circle highlighted the unique category of genes that appeared in the brain tissue after blood meal intake; (c) KOBAS 3.0 software mediated gene list enrichment and comparative pathway analysis of naïve and blood-fed brain tissues. Green arrow links to energy metabolic pathways, the pink arrow links to neurotransmitter synthesis and synaptic signaling pathway; (d) Relative expression profiling of PGC-1 gene in the brain of naïve and blood-fed mosquitoes (n = 25, N = 3) (p ≤ 0.009 at 8 h PBM, p ≤ 0.007 at 30 h PBM) (p ≤ 0.005 is indicated as ‘**’); (e) Transcriptional profiling of transcripts related to energy metabolism in the brain tissue of naïve and blood-fed mosquitoes at different time points. For pyruvate kinase the p value is ≤0.0176 at 2 h PBM, and oxo-glutarate dehydrogenase the p value is p ≤ 0.0019 at 30 h PBM (p ≤ 0.005 is indicated as ‘**’, p ≤ 0.05 is indicated as ‘*’); (f) Comparative transcriptional response of amino acid transporters and trehalose transporter along with trehalase enzyme in the brain tissue after the metabolic switch (n = 25, N = 3). For solute carrier 7 the p value is ≤0.0515 and for trehalose transporter the p value is (p ≤ 0.0071) Statistically significant variation in the expression of the respective genes was tested by the t-test and compared with the sugar-fed control brain. (n = number of mosquitoes from, which the respective tissue was dissected and pooled for each independent experiment; N = number of biological replicates). SF = naïve sugar-fed, 2 h-PBM (Post-Blood-Meal); 8 h-PBM; 30 h-PBM; 48 h-PBM; 72 h-PBM.

