

Abstract
Background:
Accurate clinical prediction supports effective treatment of alcohol use disorder (AUD) and other psychiatric disorders. Traditional statistical techniques have identified patient characteristics associated with treatment outcomes; however, less work has focused on systematically leveraging these associations to create optimal predictive models. The current study demonstrates how machine learning can be used to predict clinical outcomes in people completing outpatient AUD treatment.
Method:
We used data from the COMBINE multisite clinical trial (n = 1,383) to develop and test predictive models. We identified 3 priority prediction targets, including 1) heavy drinking during the first month of treatment, 2) heavy drinking during the last month of treatment, and 3) heavy drinking in-between weekly/bi-weekly sessions. Models were generated using the random forest algorithm. We used “leave sites out” partitioning to externally validate the models in trial sites that were not included in the model training. Stratified model development was used to test for sex differences in the relative importance of predictive features.
Results:
Models predicting heavy alcohol use during the first and last months of treatment showed internal cross validation area under the curve (AUC) scores ranging from 0.67 to 0.74. AUC was comparable in the external validation using data from held out sites (AUC range = 0.69 – 0.72). The model predicting between session heavy drinking showed strong classification accuracy in internal cross-validation (AUC = 0.89) and external test samples (AUC range = 0.80 – 0.87). Stratified analyses found substantial sex differences in optimal feature sets.
Conclusion:
Machine learning techniques can predict alcohol use treatment outcomes using routinely collected clinical data. This technique has potential to greatly improve clinical prediction accuracy without requiring expensive or invasive assessment techniques. More research is needed to understand how to best deploy these models.
Keywords: Machine learning, treatment outcomes, COMBINE, alcohol use disorder, prediction
Introduction
Treatment of alcohol use disorder (AUD) is characterized by high rates of return to heavy drinking during and after treatment (Fleury et al., 2016). Many patients, particularly those with more severe AUD, will undergo numerous rounds of treatment before achieving long-term remission from heavy alcohol use. Such relapses to heavy drinking during and following treatment are costly to healthcare systems (Mortimer and Segal, 2005) and discouraging for patients. The chronic and relapsing nature of AUD is recognized as one of the major challenges of AUD treatment and major research efforts are aimed at developing strategies for reducing the rates of relapse among those being treated for AUD, primarily by developing novel treatment strategies that create more consistent change in patients.
Another method for improving AUD treatment outcomes is to identify characteristics of patients who are likely to experience lapses during and following treatment. Armed with highly accurate prognostic information, patients and clinicians could make more efficient decisions regarding the course of treatment. For example, patient traits such as age (Dawson et al., 2007), sex (Garbutt et al., 2005), psychiatric comorbidity (Chiappetta et al., 2014), AUD severity (Witkiewitz, 2011) and neurobiological traits (Durazzo et al., 2010) predict likelihood of relapse, though most of these findings are mixed across studies (see Sliedrecht et al., 2019 for a recent review of this literature). An implementation barrier in this line of research is that most studies examine a relatively narrow band of traits, often based on a priori hypotheses. While theory-guided design is important for understanding potential patterns of causality and targets for direct intervention (Adamson et al., 2009), potentially informative predictors can be omitted on theoretical bases and to accommodate the limitations of traditional statistical modeling. It is nearly impossible to synthesize predictors of relapse across multiple investigations to develop unified decision guidelines due to, for example, conventions of classical statistical frameworks and differences between studies. These problems limit our ability to leverage such findings to accurately predict relapse risk (Dwyer et al., 2018).
Leveraging high dimensional data to achieve accurate predictions is a problem that is well-suited for machine learning (Bzdok et al., 2018). This statistical framework encompasses a range of techniques and conventions that differ from dominant modes of statistical thinking in several important aspects, such as the lack of distributional assumptions and the methods by which models are evaluated (Shmueli, 2010). At the core of machine learning are highly flexible algorithms that make relatively fewer formal assumptions about data and can learn complex non-linear decision boundaries from highly multi-dimensional datasets. These algorithms prioritize prediction accuracy, and model performance is evaluated empirically by evaluating accuracy in novel data. Given the flexibility of these algorithms, they are well-suited to handle questions encountered in behavioral research (Bzdok and Meyer-Lindenberg, 2018).
Indeed, these techniques have been successfully applied to address a range of problems in addiction and psychiatry research (Mak et al., 2019), such as predicting hospital readmissions (Morel et al., 2020), predicting substance use disorder treatment outcomes from archival clinical data (Acion et al., 2017), and predicting naturally occuring AUD remission (Kinreich et al., 2021). Other studies have used clinical trial data to build machine learning models to predict treatment outcomes in the context of clinical trials. Chekroud et al. (2016) used patient-reported data at the start of a clinical trial to predict remission of depressive symptoms at the end of the treatment phase of the trial with moderate accuracy. Their model generalized well to a separate clinical trial (internal cross-validation accuracy = 64.6%; external validation = 59.6% accuracy). Symons et al. (2020) developed machine learning models to predict treatment outcomes in a group of outpatients completing a 12-week CBT program for AUD. The model was then used to prospectively predict treatment outcomes in a separate group of patients completing the same program with moderate accuracy (70% accurate in a prospective cohort of patients completing the same program), which was significantly more accurate than predictions from clinicians involved in the patients’ treatment (other papers from the this line of research include Symons et al., 2019, Connor et al., 2007). Notably, both studies employed feature sets based on patient self-report data that is routinely collected in clinical settings, suggesting that accurate predictions can be made without the need for specialized and potentially costly assessment procedures (e.g., fMRI, genetic assay). Although both studies sought to predict similar outcomes (i.e., success at the end of treatment), the underlying techniques are flexible and could be adapted to predict a range of clinically important events.
The current study utilized data from the COMBINE trial to test the feasibility of using algorithmic prediction to preempt critical events that occur during treatment for alcohol use. The COMBINE trial is the largest pharmacotherapy trial for alcohol use ever conducted (Anton et al., 2006) and is therefore an ideal data source for the current application. Adults with alcohol dependence (n = 1,383) completed a 16-week pharmacotherapy and/or behavioral interventions on an outpatient basis with regular office-based visits. The COMBINE data offers several advantages for this application of machine learning. Large datasets allow the algorithms to “learn” complex nonlinear associations between variables and reduce variance (Schnack and Kahn, 2016). Patients in these trials complete comprehensive and standardized evaluations at similar points during treatment, providing a rich dataset from which features can be derived.
The primary goal of this study was to develop a set of models capable of predicting important clinical outcomes using clinical data gathered before each outcome was observed. All models were developed with the goal of predicting the occurrence of heavy drinking days (i.e., 4/5+ drinks per day for women/men); this outcome was selected because it is a standard and validated indicator of AUD treatment response (Litten et al., 2012). Models were developed to address the f0llowing clinical questions:
Is a patient beginning treatment likely to abstain from heavy drinking during the first month of treatment?
Is a patient early in treatment likely to abstain from heavy drinking during the final month of treatment?
Is a patient likely to engage in heavy drinking between weekly/biweekly sessions?
Each model was developed using data available up to the time when the prediction would be made in the clinic (e.g., only pretreatment data was used to predict first month heavy drinking).
An exploratory goal of the study was to evaluate the utility of developing separate predictive models for men and women. There are crucial sex differences in the factors that maintain harmful alcohol use (Walitzer and Dearing, 2006, Peltier et al., 2019). Recent research using machine learning techniques to predict health outcomes, such as development of alcohol use disorder (Kinreich et al., 2021) and heart disease (Segar et al., 2021), has demonstrated the benefits of using demographically stratified models.
Method
Study design and sample description
The COMBINE study was a large phase 3 multisite randomized clinical trial for the treatment of alcohol dependence conducted from January 2001 – January 2004 and included 1,383 treatment-seeking individuals with primary alcohol dependence across 11 treatment centers (Anton et al., 2006). Participants were recruited from the communities and met DSM-IV criteria for alcohol dependence. Additional eligibility requirements included 4 to 21 days of abstinence at baseline; ≥ 14 (women) or 21 (men) drinks per week; no other substance abuse/dependence (other than tobacco/cannabis) over the past 90 days; no unstable medical conditions; and no psychiatric disorders requiring medication. Eligible participants were randomly assigned to 1 of 9 intervention conditions. Treatments included different combination of naltrexone/acamprosate/combined behavioral intervention (CBI)/and medical management intervention. The treatment phase of the study lasted 16 weeks and included 9 medication management sessions for most of the sample. Additional methodological details of the COMBINE study are reported elsewhere (Anton et al., 2006) and described in supplemental text. Demographic characteristics of the sample are reported in Table 1.
Table 1.
COMBINE patient characteristics
| n (M [SD]) | |
|---|---|
| Age (years old) | |
| 18 to 24 | 23 |
| 25 to 34 | 207 |
| 35 to 44 | 488 |
| 45 to 54 | 443 |
| 55+ | 222 |
| Sex | |
| Male | 955 |
| Female | 428 |
| Race/Ethnicity | |
| American Indian or Alaskan Native | 18 |
| Asian or Pacific Islander | 4 |
| Black | 109 |
| Hispanic | 155 |
| Non-Hispanic white | 1,062 |
| More than 1 race | 18 |
| Other race | 17 |
| Employment | |
| Not employed | 982 |
| Employed | 395 |
| Education (years) | (14.55) [2.73] |
| AD severity | |
| Mild | 228 |
| Moderate | 782 |
| Severe | 352 |
| AD symptom count | (5.52) [1.28] |
| Pretreatment drinks per day | (8.93) [5.85] |
Note. AD severity and symptom count is based on SCID-IV assessment of alcohol dependence.
Measures
Feature sets.
The candidate feature set included all questionnaire/clinical data available. Examples of candidate features include pretreatment drinking characteristics, Alcohol Dependence Scale scores (Skinner and Allen, 1982), self-reported mood state (McNair et al., 1971), and treatment conditions. A list of questionnaires, biomarkers, and treatment variables from which features were derived are included in a supplemental table. Different sets of features were eligible for separate models, but all sets were based on information that would be available at the point in treatment at which each clinical prediction would be made. Missing values were single imputed using the bagged trees (numerical) and modal replacement (categorical).
Clinical outcomes and time-based feature restriction.
We identified 3 key clinical outcomes from which we constructed predictive models, including 1) heavy drinking during the first month of treatment, 2) heavy drinking during the last month of treatment, and 3) heavy drinking between weekly/biweekly sessions. We identified these targets as high priority for prediction because prior knowledge of these outcomes could facilitate modification/elevation of an intervention if an individual is deemed to be at risk for a negative outcome. All outcomes are based on the presence/absence of heavy drinking days, as this is a standard indicator of treatment efficacy in the AUD treatment literature. A heavy drinking day is defined as days in which 4/5 (women/men) drinks are consumed.
Last month heavy drinking.
The primary prediction target for this study was treatment outcome as defined by abstinence from heavy drinking during the final month of treatment. Features used to train this model were restricted to information collected no later than the second session (approximately 7 days post randomization). Missing observations (implying dropout) were treated as engaging in heavy drinking.
Early treatment heavy drinking.
Heavy drinking during early treatment can interfere with treatment and is a strong indicator of poor outcomes later (Charney et al., 2010). Early treatment heavy drinking was defined as any days of heavy drinking during the first 30 days of treatment. Features used to train this model was restricted to information collected prior to randomization (i.e., baseline assessment). Missing observations (implying dropout) were treated as engaging in heavy drinking.
Heavy drinking between sessions.
A model was developed that predicted at each session whether patients would engage in heavy drinking during the time interval between the current and following sessions. Session was defined as the time between medication management sessions (or, in the CBI only condition, CBI sessions that occurred during weeks corresponding to the CBI sessions). Features eligible for inclusion in this model included all features based on information that was collected prior to and during the current session. For this model, the unit of observation was session rather than participant, so most participants provided multiple observations. Heavy drinking prior to session 1 was not predicted in this model, so there was a maximum of 7 observations per participant. Between session periods with missing data (implying dropout) were not included in this model. 11.12% of possible sessions were missing.
Model Development
Model development and reporting was conducted according to the TRIPOD guidelines (Moons et al., 2015). We trained 3 primary models to predict the above-described clinical outcomes. Models were primarily evaluated using area under the curve (AUC), but sensitivity, specificity, positive and negative predictive power, and kappa values also are reported. We chose this metric because it can visualize model performance across a range of cut points which may be useful for varying clinical applications. Separate analytic pipelines were developed for each predictive algorithm. For the primary model building, we used k-fold cross validation in a training partition and validated the models in leave sites out external validation samples. Although the random forest algorithm does not provide an easily interpretable internal indicator of feature importance (Breiman, 2001), feature importance can be estimated by observing the loss in accuracy that occurs in the out of bag sample when the feature is permuted, as described by Breiman (2001). We report this feature importance score scaled as the % of the most important feature. This feature importance metric cannot be interpreted directionally. For the exploratory examination of sex differences, we utilized the same training set as was used on the primary models. We did not evaluate model performance in the hold out sample because of the limited number of observations. We only examined sex differences in the model predicting heavy drinking during the last month, as this outcome closely reflects a recognized AUD trial endpoint. Integrated calibration scores are reported to quantify model calibration (Austin & Steyersburg, 2019)
All analyses were conducted in R (version 4.0.3). R code used to train and test the models and the final models are available at www.github.com/roblabyale/adtxpred and code used for data preprocessing is available upon request. Model training and optimization was performed using the “caret” package. Confusion matrices and calibration plots are presented in the supplemental materials. We also estimated baseline models using logistic regression including all candidate features as a comparison. Results of these models also are presented in the supplemental materials.
Sample partitioning.
We used leave sites out method to create a separate test partition. Two trial sites were randomly selected from the 11 total sites, and all data from these sites were removed from the training set. This approach allowed us to evaluate whether the models generalized across clinical sites and ensured that the model did not capitalize on site specific effects (Cai et al., 2020). For the model predicting session to session heavy drinking, this partitioning method also ensured that no single patient’s data was included in both the training and test sets. Patient-wise splitting is a more conservative estimate of model generalizability than record-wise splitting, which can lead to reduced error measurement due to “identify confounding” (Neto et al., 2019).
Feature selection.
Although the random forest algorithm can efficiently handle noninformative features without a formal selection process, we included a feature selection step in our pipeline to identify an efficient set of predictors and to evaluate the utility of sex-specific feature sets. Variable selection was performed on the training sets using the Boruta algorithm (Kursa and Rudnicki, 2010). Boruta is a wrapper algorithm built around random forest that identifies features with predictive value in the random forest model. To eliminate data leakage, only the training sets were used for the feature selection step.
Model training and hyperparameter tuning.
We used the random forest algorithm (Breiman, 2001) from the “ranger” package to train our models. k-fold repeated cross validation (k = 10) was used to identify optimal hyperparameters (mtry, min.node.sizes) for each model. Other hyperparameters were set to the default values per the “caret” cross-validation wrapper. A model was then fit to the full training set using the best performing mtry value. We report average accuracy scores in the 10 internal cross-validation samples for the strongest performing mtry value in each model. To address class imbalances, we used cost-sensitive learning to overweight classification errors to the minority class in the cost function (Chen, Liaw, & Breiman, 2004).
Leave site out sample performance evaluation.
We report model performance in 2 randomly selected sites that were included in the hold out sample. We tested the statistical significance of the improvement in accuracy of the models against the no information rate (i.e., accuracy if all predictions were the modal value) in the combined external validation samples using binomial tests.
Results
Sample Description
A description of the sample in terms of demographic information and alcohol use severity is provided in Table 1. The sample skewed White and male but was diverse in terms of age and alcohol dependence severity. Approximately half of the sample reported receiving treatment for their alcohol use at least once in the past (n = 671; 48.52%). Participants consumed 8.93 drinks (SD = 5.85) on average each day during the 3 months preceding treatment. Clinical outcomes (i.e., prediction targets), with the exception of between-session heavy drinking, were approximately evenly distributed (see null information rate in Table 2).
Table 2.
Model performance metrics in cross validation and hold out site samples
| NIR | Sensitivity | Specificity | PPV | NPV | Kappa | ICI | AUC | |
|---|---|---|---|---|---|---|---|---|
| Final month | ||||||||
| 10-fold CV | 0.51 | 0.67 (0.61; 0.69) | 0.64 (0.62; 0.70) | 0.66 (0.62; 0.70) | 0.65 (0.61; 0.69) | 0.32 (0.26; 0.37) | 0.74 | |
| LSO site 1 | 0.52 | 0.70 (0.57; 0.80) | 0.59 (0.46; 0.71) | 0.65 (0.53; 0.76) | 0.64 (0.50; 0.76) | 0.28 (0.12; 0.45) | 0.05 | 0.71 |
| LSO site 2 | 0.51 | 0.67 (0.54; 0.78) | 0.70 (0.58; 0.81) | 0.70 (0.57; 0.81) | 0.67 (0.55; 0.78) | 0.37 (0.21; 0.53) | 0.04 | 0.72 |
| Combined LSO | 0.52 | 0.68 (0.60; 0.76) | 0.65 (0.56; 0.73) | 0.67 (0.59; 0.75) | 0.66 (0.57; 0.74) | 0.33 (0.21; 0.44) | 0.03 | 0.71 |
| First month | ||||||||
| 10-fold CV | 0.53 | 0.76 (0.72; 0.79) | 0.45 (0.41; 0.50) | 0.61 (0.57; 0.64) | 0.63 (0.58; 0.68) | 0.22 (0.16; 0.27) | 0.67 | |
| LSO site 1 | 0.59 | 0.86 (0.76; 0.93) | 0.41 (0.28; 0.55) | 0.68 (0.58; 0.77) | 0.67 (0.48; 0.82) | 0.28 (0.12; 0.44) | 0.06 | 0.70 |
| LSO site 2 | 0.52 | 0.52 (0.39; 0.65) | 0.75 (0.63; 0.85) | 0.63 (0.52; 0.73) | 0.65 (0.50; 0.78) | 0.27 (0.11; 0.43) | 0.04 | 0.69 |
| Combined LSO | 0.56 | 0.81 (0.73, 0.87) | 0.47 (0.37; 0.56) | 0.66 (0.55; 0.76) | 0.66 (0.58; 0.72) | 0.28 (0.17; 0.40) | 0.04 | 0.70 |
| Heavy drinking between sessions | ||||||||
| 10-fold CV | 0.66 | 0.77 (0.75; 0.79) | 0.85 (0.84; 0.86) | 0.73 (0.71; 0.74) | 0.88 (0.87; 0.89) | 0.61 (0.59; 0.63) | 0.89 | |
| LSO site 1 | 0.60 | 0.71 (0.65; 0.76) | 0.85 (0.81; 0.88) | 0.76 (0.70; 0.81) | 0.81 (0.77; 0.85) | 0.56 (0.50; 0.62) | 0.17 | 0.87 |
| LSO site 2 | 0.66 | 0.54 (0.48; 0.60) | 0.90 (0.86; 0.92) | 0.73 (0.66; 0.79) | 0.79 (0.75; 0.82) | 0.46 (0.40; 0.53) | 0.14 | 0.80 |
| Combined LSO | 0.63 | 0.63 (0.89; 0.67) | 0.87 (0.85; 0.89) | 0.75 (0.70; 0.78) | 0.80 (0.77; 0.83) | 0.52 (0.48; 0.57) | 0.15 | 0.84 |
Note. NIR is no information rate. PPV is positive predictive value. NPV is negative predictive value. AUC is area under the receiver operating characteristic curve. ICI is integrated calibration index. LSO is leave site out. Parenthetical values are 95% confidence intervals.
Model Evaluation
A full list of candidate features selected for each model is available in the supplemental material. Table 2 reports the optimal hyperparameters of each model and its classification accuracy in the cross-validation samples as well its accuracy in data from novel trial sites. Receiver operating characteristic (ROC) curves for the combined external validation sample are illustrated in Figure 1.
Figure 1.

Receive operating characteristic (ROC) curves of model accuracy in combined leave sites out external validation sample.
Early treatment heavy drinking.
The feature selection step identified 19 features that contained predictive information for early treatment heavy drinking. The 3 features with the highest importance ratings were Alcohol Abstinence Self-Efficacy – total temptation score, Alcohol Abstinence Self-Efficacy – total confidence score, and Alcohol Use Disorder Identification Test – total score. Additional features included in this model and all importance ratings are provided in a supplemental table. Model classification accuracy in the combined external validation sample (AUC = 0.70) was significantly better than the no information rate (p = 0.001). The optimal cut point favored sensitivity (0.81 [95% CI = 0.73; 0.87]) over specificity (0.47 [95% CI = 0.37; 0.56]).
Last month heavy drinking.
This model retained 28 informative features. The 3 features with the highest importance ratings were SFA aggregate mental health score and obsessive-compulsive drinking scale-total score and resistance subscale score. Model classification accuracy in the combined external validation sample (AUC = 0.71) was significantly better than the no information rate, p < 0.001. The optimal cut point for this model has comparable sensitivity (0.68 [95% CI = 0.60; 0.76]) and specificity (0.65 [95% CI = 0.56; 0.73]).
Heavy drinking between sessions.
There were 7,432 session observations available with sufficient data to include in the model. Each participant provided data from 5.66 (SD = 1.88) sessions on average. Heavy drinking was reported between 2,580 (34.71%) of all sessions. Most available features were selected as informative (148 out of 153 candidate features). The feature importance measures, which are reported in the supplemental materials, provide additional information on the most informative features in this model, which may inform more parsimonious feature sets.
Model classification in the combined external validation sample (AUC = 0.88) was significantly more accurate than the no information rate (0.63), p < 0.001. In the combined external validation set, the model showed higher specificity (0.87 [95% CI = 0.85; 0.89]) than specificity (0.63 [95% CI = 0.59; 0.67]), indicating that the model performed well in predicting abstinence from heavy drinking.
Variable importance in sex-specific feature sets
The feature selection pipeline identified different informative features for the sex-specific samples. The selected feature sets and model-specific variable importance measures from the trained models are reported in Figure 2. As seen in this figure, there were 9 variables in each sex specific model that were not selected in the other model; 11 variables were selected in both models. Of note, several features selected only in the female specific model, including the feature identified as having the highest importance rating, were related to comorbid psychiatric symptoms. Features related to psychiatric symptoms were not selected in the men specific model. Model performance in the cross-validation samples was comparable in males (AUC = 0.74) and females (AUC = 0.78).
Figure 2.
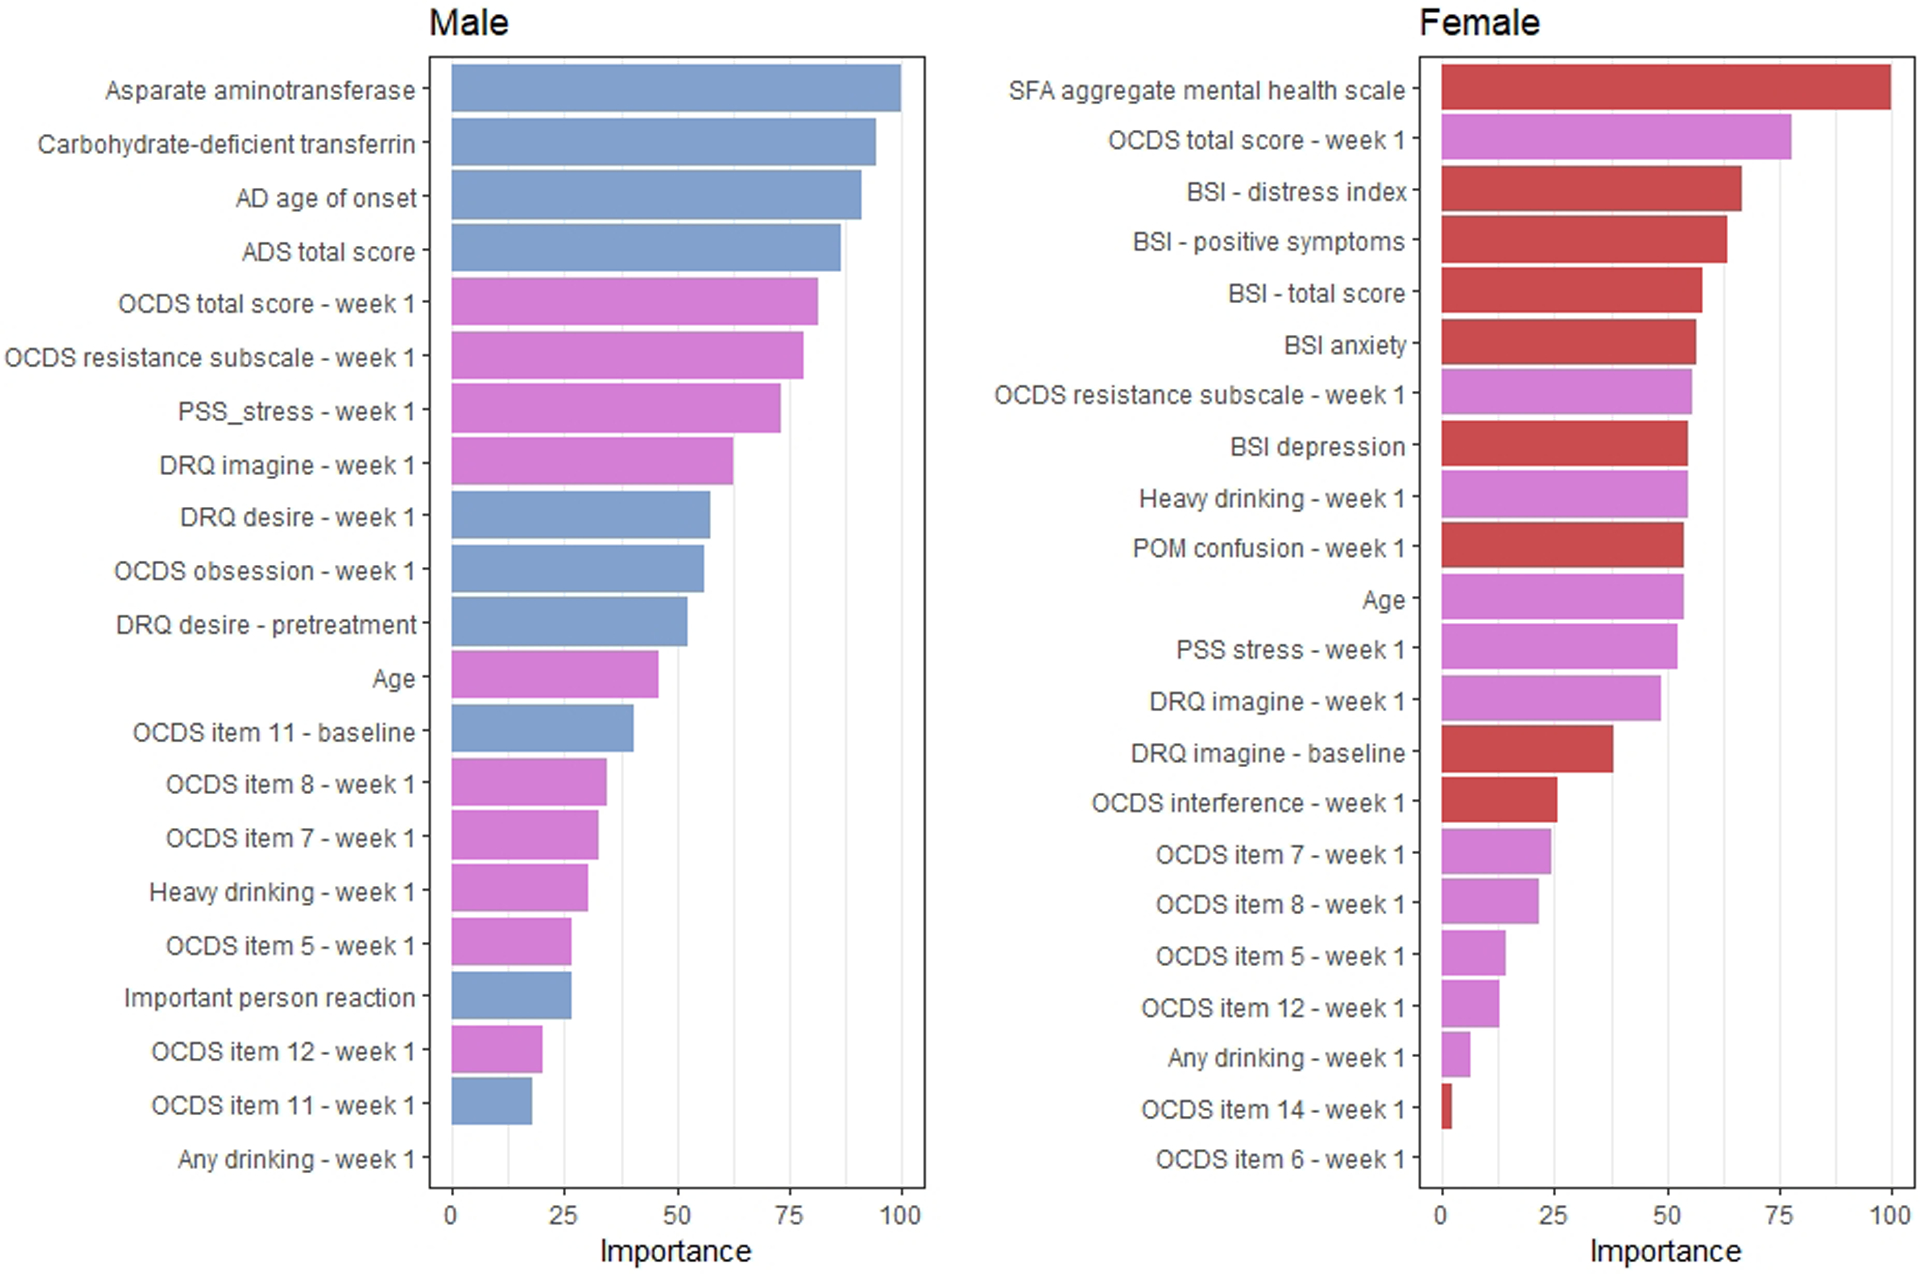
Variable importance ratings in models trained from sex stratified samples. The importance of variable m is the loss in accuracy when feature m is permuted in the out of bag sample averaged across all trees that include m (Brieman, 2001). Blue and red bars indicate that a feature was selected only in the male- and female-restricted models, respectively, and magenta bars indicate that a feature was selected in both models.
Discussion
In this study we developed models using routinely collected clinical data to predict critical alcohol use outcomes in patients completing a structured outpatient treatment program. The performance of these models was comparable to other studies that have predicted treatment outcomes using machine learning algorithms in people with AUD (Symons et al., 2020) and other psychiatric disorders (Chekroud et al., 2016). Classification accuracy also was likely well above clinical judgement. We did not have data to make this comparison in the current study because COMBINE clinicians did not make formal clinical predictions. However, a recent study comparing machine learning models to clinician judgement in terms of predicting AUD treatment success found that psychologists (accuracy = 56.36%) were outperformed by the best machine learning models (accuracy = 70%; Symons et al., 2020). Psychologists’ predictions were particularly poor in correctly predicting treatment nonsuccess (sensitivity to treatment nonsuccess = 0.50). As such, the models developed here likely generate more accurate decisions compared to human clinical judgement, particularly in identifying patients who are going to return to heavy drinking and may therefore benefit from additional intervention. The primary model estimated using random forest was comparable in terms of classification accuracy compared to the baseline logistic regression model (see supplemental materials). Kappa values were comparable between the models. This finding is consistent with Symons et al (2020), who showed that “traditional” logistic regression performed as well as a comprehensive suite of machine learning algorithms in predicting outcomes for patients entering AUD treatment.
It should be noted that the models presented here are not intended to inform theoretical accounts of relapse. Witkiewitz (2011) rigorously examined these data using a classical statistical approach, and we recommend this manuscript to readers who are interested in understanding these associations from an inferential perspective. Rather, our sole focus in creating these models was accurate prediction of the end-point outcome of no heavy drinking (Bzdok et al., 2018). Although treatment condition was included as a candidate feature in our analyses, it was not primary focus. An interesting future direction for this line of research may be to utilize data-driven machine learning approaches to identify factors predicting patient reponses to specific treatments. Causal forests, a extension of random forests able, can be used to identify factors contributing to treatment response heterogeneity and is able to efficiently handle high dimensional feature spaces (Davis and Heller, 2017). This algorithm could be used to develop models that estimate personalized treatment effects based on patient characteristics.
How might these models be used to support and improve treatment delivery among outpatients receiving AUD treatment? Models like those presented here could be easily integrated into clinical care at several key decision points. In terms of treatment planning, our models predicting heavy drinking during the first and last months of treatment answer a critical question: is a patient likely to succeed in treatment? Patients who are unlikely to benefit could be immediately diverted to a higher level of care without incurring the financial and psychological cost of an unsuccessful treatment attempt (e.g., stepped care model; Borsari et al., 2012). The model predicting intrasession drinking episodes could be used throughout treatment to improve week to week decision making by, for example, allowing clinicians to preempt drinking lapses during high-risk periods. An advantage of these models is that the classification cut points can be tailored to the needs of the clinical use case. In some clinical settings, the “cost” of a false positive may be higher than that of a false negative: the cut point can be easily adjusted to accommodate the relative weights of prediction errors.
The models generalized to novel clinical sites with small losses of accuracy, suggesting that they were robust across settings and may be able to tolerate some deviation from the training data. That the models performed well on data collected outside of the sites on which it was trained suggests generalizability across communities and providers. This consistency across sites may relate to the multisite design of the COMBINE trial, which has been shown to improve generalizability in other machine learning applications (Rozycki et al., 2018). On the other hand, all sites delivered treatment as described in the standardized protocol. Generalizability would likely suffer from deviations from the COMBINE protocol (e.g., changes in treatment length, session frequency). There are several ways to address this limitation. Larger datasets, likely mined from medical records across different treatment modalities and patient cohorts, would likely produce more generalizable models. Another solution is to develop and deploy models unique to each site; other research using neuroimaging data to predict schizophrenia diagnoses found that site-specific models outperformed a general model (Cai et al., 2020). Future work is needed to understand the loss of generalizability that occurs due to expected variability between treatment programs and subpopulations of people with AUD.
Calibration curves (see supplemental material) showed that our models overestimated the probability of between session heavy drinking in lower quantile estimates and overestimated in the upper quantiles. Models meant for production that will be used to ultimately guide clinical decision making may benefit from postestimation recalibration, especially if users will directly interpret the probability estimates (Van Calster, 2019).
Another important advantage of this type of model development is its ease of implementation. There has been a longstanding interest in predicting treatment outcomes for people with AUD. Other research has focused on leveraging sophisticated neuroimaging (Garrison and Potenza, 2014) and genetic (Garbutt et al., 2014) data to predict treatment responses. Such methods are informative, but collection requires potentially invasive and expensive procedures, which may limit implementation. Predictive models based on routinely collected self-report inventories and biosample data, such as those developed in the current study, are appealing in their simplicity and relative ease with the which data driving the predictions can be collected. Indeed, top features in the primary predictive models were extracted from paper-and-pencil self-report data that can be easily collected during treatment. Although laboratory measures (e.g., GGT, liver enzymes) may not be feasible to collect in all settings, these features were less informative compared to the self-report features across all models.
We were able to leverage many of the characteristics of the COMBINE trial to build robust predictive models; however, there are additional steps that could be taken in prospectively designed studies that would likely further improve the accuracy of the models. More data could be collected with greater regularity. In the COMBINE trial, some ancillary measures were administered only at baseline and halfway through treatment (e.g., brief symptom inventory); weekly administration of these measures could improve the accuracy of session-level predictions. There are numerous additional variables, such as impulsivity (Loree et al., 2015), that have been identified as predictors of relapse that could be included in a comprehensive battery (Sliedrecht et al., 2019, Adamson et al., 2009). We recommend that future clinical trials incorporate a standardized, comprehensive assessment of state factors that patients complete regularly over the course of the trial. Larger efforts to standardize assessments across clinical trials of similar types are occurring. For example, the PhenX toolkit (Hamilton et al., 2011) compiles recommended sets of assessments for use in clinical trials. The National Institute of Mental Health Data Archives (https://nda.nih.gov/about.html) emphasize standardizing data reporting formats across trials. These initiatives increase intertrial compatibility and facilitating data harmonization that supports data intensive investigations, such as the current project.
Our examination of sex differences should be treated as preliminary due to the small sample size; however, the differences in the features selected in the sex specific models imply that there may be utility in developing sex specific models. In the female specific model, variable selection was consistent with existing research findings that negative affect and certain forms of psychopathology bear a strong association with alcohol use in women (Peltier et al., 2019). In the male specific model, variables with the highest predictive importance were related on history and severity of AUD symptoms and current drinking levels. Sample heterogeneity can reduce overall classifier accuracy, particularly when the confounder alters the association between the prediction target and other features (Li et al., 2011). Other research using machine learning techniques to predict alcohol use outcomes have stratified models by sex to create more accurate classifiers (Kinreich et al., 2021). The approach we used here (i.e., stratified model development) provides one potential solution to this problem, but there are other methods available (e.g., Li et al., 2011) to address this problem and future research will be necessary to identify the most effective strategy.
In sum, the current research demonstrates the utility of using machine learning techniques to predict treatment outcomes as well as critical events during treatment. With further development, clinical systems based on these predictive models could enhance clinical care by improving prognostic information and facilitating targeted treatment delivery, allowing clinicians and patients to anticipate and adjust the course of treatment before drinking lapses occur.
Supplementary Material
Support:
This work was funded by the National Institute on Alcohol Abuse and Alcoholism grants AA026890, AA027989, AA025670, and AA021818 and National Institute on Aging grant AG068191.
Footnotes
Conflict of Interest: The authors declare no conflict of interest.
References
- Acion L, Kelmansky D, van der Laan M, Sahker E, Jones D, Arndt S (2017) Use of a machine learning framework to predict substance use disorder treatment success. PloS one 12:e0175383. [DOI] [PMC free article] [PubMed] [Google Scholar]
- Adamson SJ, Sellman JD, Frampton CM (2009) Patient predictors of alcohol treatment outcome: a systematic review. J Subst Abuse Treat 36:75–86. [DOI] [PubMed] [Google Scholar]
- Anton RF, O’Malley SS, Ciraulo DA, Cisler RA, Couper D, Donovan DM, Gastfriend DR, Hosking JD, Johnson BA, LoCastro JS, Longabaugh R, Mason BJ, Mattson ME, Miller WR, Pettinati HM, Randall CL, Swift R, Weiss RD, Williams LD, Zweben A, Group CSR (2006) Combined pharmacotherapies and behavioral interventions for alcohol dependence: the COMBINE study: a randomized controlled trial. JAMA 295:2003–2017. [DOI] [PubMed] [Google Scholar]
- Austin PC, Steyerberg EW (2019) The integrated calibration index (ICI) and related metrics for quantifying the calibration of logistic regression models. Stat Med 38: 4051–4065. [DOI] [PMC free article] [PubMed] [Google Scholar]
- Borsari B, Hustad JT, Mastroleo NR, Tevyaw TO, Barnett NP, Kahler CW, Short EE, Monti PM (2012) Addressing alcohol use and problems in mandated college students: a randomized clinical trial using stepped care. J Consult Clin Psychol 80:1062–1074. [DOI] [PMC free article] [PubMed] [Google Scholar]
- Breiman L (2001) Random forests. Machine learning 45:5–32. [Google Scholar]
- Bzdok D, Altman N, Krzywinski M (2018) Statistics versus machine learning. Nat Methods 15:233–234. [DOI] [PMC free article] [PubMed] [Google Scholar]
- Bzdok D, Meyer-Lindenberg A (2018) Machine learning for precision psychiatry: opportunities and challenges. Biol Psychiatry Cogn Neurosci Neuroimaging 3:223–230. [DOI] [PubMed] [Google Scholar]
- Cai XL, Xie DJ, Madsen KH, Wang YM, Bogemann SA, Cheung EFC, Moller A, Chan RCK (2020) Generalizability of machine learning for classification of schizophrenia based on resting-state functional MRI data. Hum Brain Mapp 41:172–184. [DOI] [PMC free article] [PubMed] [Google Scholar]
- Charney DA, Zikos E, Gill KJ (2010) Early recovery from alcohol dependence: factors that promote or impede abstinence. J Subst Abuse Treat 38:42–50. [DOI] [PubMed] [Google Scholar]
- Chekroud AM, Zotti RJ, Shehzad Z, Gueorguieva R, Johnson MK, Trivedi MH, Cannon TD, Krystal JH, Corlett PR (2016) Cross-trial prediction of treatment outcome in depression: a machine learning approach. Lancet Psychiatry 3:243–250. [DOI] [PubMed] [Google Scholar]
- Chiappetta V, Garcia-Rodriguez O, Jin CJ, Secades-Villa R, Blanco C (2014) Predictors of quit attempts and successful quit attempts among individuals with alcohol use disorders in a nationally representative sample. Drug Alcohol Depend 141:138–144. [DOI] [PubMed] [Google Scholar]
- Connor JP, Symons M, Feeney GF, Young RM, Wiles J (2007) The application of machine learning techniques as an adjunct to clinical decision making in alcohol dependence treatment. Subst Use Misuse 42:2193–2206. [DOI] [PubMed] [Google Scholar]
- Davis J, Heller SB (2017) Using causal forests to predict treatment heterogeneity: An application to summer jobs. American Economic Review 107:546–550. [Google Scholar]
- Dawson DA, Goldstein RB, Grant BF (2007) Rates and correlates of relapse among individuals in remission from DSM-IV alcohol dependence: a 3-year follow-up. Alcohol Clin Exp Res 31:2036–2045. [DOI] [PubMed] [Google Scholar]
- Durazzo TC, Gazdzinski S, Mon A, Meyerhoff DJ (2010) Cortical perfusion in alcohol-dependent individuals during short-term abstinence: relationships to resumption of hazardous drinking after treatment. Alcohol 44:201–210. [DOI] [PMC free article] [PubMed] [Google Scholar]
- Dwyer DB, Falkai P, Koutsouleris N (2018) Machine learning approaches for clinical psychology and psychiatry. Annu Rev Clin Psychol 14:91–118. [DOI] [PubMed] [Google Scholar]
- Fleury MJ, Djouini A, Huynh C, Tremblay J, Ferland F, Menard JM, Belleville G (2016) Remission from substance use disorders: a systematic review and meta-analysis. Drug Alcohol Depend 168:293–306. [DOI] [PubMed] [Google Scholar]
- Garbutt JC, Greenblatt AM, West SL, Morgan LC, Kampov-Polevoy A, Jordan HS, Bobashev GV (2014) Clinical and biological moderators of response to naltrexone in alcohol dependence: a systematic review of the evidence. Addiction 109:1274–1284. [DOI] [PubMed] [Google Scholar]
- Garbutt JC, Kranzler HR, O’Malley SS, Gastfriend DR, Pettinati HM, Silverman BL, Loewy JW, Ehrich EW, Vivitrex Study G (2005) Efficacy and tolerability of long-acting injectable naltrexone for alcohol dependence: a randomized controlled trial. JAMA 293:1617–1625. [DOI] [PubMed] [Google Scholar]
- Garrison KA, Potenza MN (2014) Neuroimaging and biomarkers in addiction treatment. Curr Psychiatry Rep 16:513. [DOI] [PMC free article] [PubMed] [Google Scholar]
- Hamilton CM, Strader LC, Pratt JG, Maiese D, Hendershot T, Kwok RK, Hammond JA, Huggins W, Jackman D, Pan H, Nettles DS, Beaty TH, Farrer LA, Kraft P, Marazita ML, Ordovas JM, Pato CN, Spitz MR, Wagener D, Williams M, Junkins HA, Harlan WR, Ramos EM, Haines J (2011) The PhenX Toolkit: get the most from your measures. Am J Epidemiol 174:253–260. [DOI] [PMC free article] [PubMed] [Google Scholar]
- Kinreich S, McCutcheon VV, Aliev F, Meyers JL, Kamarajan C, Pandey AK, Chorlian DB, Zhang J, Kuang W, Pandey G (2021) Predicting alcohol use disorder remission: a longitudinal multimodal multi-featured machine learning approach. Translational psychiatry 11:1–10. [DOI] [PMC free article] [PubMed] [Google Scholar]
- Kinreich S, Meyers JL, Maron-Katz A, Kamarajan C, Pandey AK, Chorlian DB, Zhang J, Pandey G, Subbie-Saenz de Viteri S, Pitti D, Anokhin AP, Bauer L, Hesselbrock V, Schuckit MA, Edenberg HJ, Porjesz B (2021) Predicting risk for Alcohol Use Disorder using longitudinal data with multimodal biomarkers and family history: a machine learning study. Mol Psychiatry 26:1133–1141. [DOI] [PMC free article] [PubMed] [Google Scholar]
- Kursa MB, Rudnicki WR (2010) Feature selection with the Boruta package. J Stat Softw 36:1–13. [Google Scholar]
- Li L, Rakitsch B, Borgwardt K (2011) ccSVM: correcting Support Vector Machines for confounding factors in biological data classification. Bioinformatics 27:i342–348. [DOI] [PMC free article] [PubMed] [Google Scholar]
- Litten RZ, Egli M, Heilig M, Cui C, Fertig JB, Ryan ML, Falk DE, Moss H, Huebner R, Noronha A (2012) Medications development to treat alcohol dependence: a vision for the next decade. Addict Biol 17:513–527. [DOI] [PMC free article] [PubMed] [Google Scholar]
- Loree AM, Lundahl LH, Ledgerwood DM (2015) Impulsivity as a predictor of treatment outcome in substance use disorders: review and synthesis. Drug Alcohol Rev 34:119–134. [DOI] [PubMed] [Google Scholar]
- Mak KK, Lee K, Park C (2019) Applications of machine learning in addiction studies: A systematic review. Psychiatry Res 275:53–60. [DOI] [PubMed] [Google Scholar]
- McNair DM, Lorr M, Droppleman LF (1971) Profile of Mood States. San Diego, CA: Education and Industrial Testing service. [Google Scholar]
- Moons KG, Altman DG, Reitsma JB, Ioannidis JP, Macaskill P, Steyerberg EW, Vickers AJ, Ransohoff DF, Collins GS (2015) Transparent Reporting of a multivariable prediction model for Individual Prognosis or Diagnosis (TRIPOD): explanation and elaboration. Annals of internal medicine 162:W1–W73. [DOI] [PubMed] [Google Scholar]
- Morel D, Yu KC, Liu-Ferrara A, Caceres-Suriel AJ, Kurtz SG, Tabak YP (2020) Predicting hospital readmission in patients with mental or substance use disorders: A machine learning approach. Int J Med Inform 139:104136. [DOI] [PubMed] [Google Scholar]
- Mortimer D, Segal L (2005) Economic evaluation of interventions for problem drinking and alcohol dependence: cost per QALY estimates. Alcohol Alcohol 40:549–555. [DOI] [PubMed] [Google Scholar]
- Neto EC, Pratap A, Perumal TM, Tummalacherla M, Snyder P, Bot BM, Trister AD, Friend SH, Mangravite L, Omberg L (2019) Detecting the impact of subject characteristics on machine learning-based diagnostic applications. NPJ digital medicine 2:1–6. [DOI] [PMC free article] [PubMed] [Google Scholar]
- Peltier MR, Verplaetse TL, Mineur YS, Petrakis IL, Cosgrove KP, Picciotto MR, McKee SA (2019) Sex differences in stress-related alcohol use. Neurobiol Stress 10:100149. [DOI] [PMC free article] [PubMed] [Google Scholar]
- Rozycki M, Satterthwaite TD, Koutsouleris N, Erus G, Doshi J, Wolf DH, Fan Y, Gur RE, Gur RC, Meisenzahl EM, Zhuo C, Yin H, Yan H, Yue W, Zhang D, Davatzikos C (2018) Multisite machine learning analysis provides a robust structural imaging signature of schizophrenia detectable across diverse patient populations and within individuals. Schizophr Bull 44:1035–1044. [DOI] [PMC free article] [PubMed] [Google Scholar]
- Schnack HG, Kahn RS (2016) Detecting neuroimaging biomarkers for psychiatric disorders: sample size matters. Front Psychiatry 7:50. [DOI] [PMC free article] [PubMed] [Google Scholar]
- Segar MW, Jaeger BC, Patel KV, Nambi V, Ndumele CE, Correa A, Butler J, Chandra A, Ayers C, Rao S, Lewis AA, Raffield LM, Rodriguez CJ, Michos ED, Ballantyne CM, Hall ME, Mentz RJ, de Lemos JA, Pandey A (2021) Development and validation of machine learning-based race-specific models to predict 10-year risk of heart failure: a multicohort analysis. Circulation 143:2370–2383. [DOI] [PMC free article] [PubMed] [Google Scholar]
- Shmueli G (2010) To explain or to predict? Statistical science 25:289–310. [Google Scholar]
- Skinner HA, Allen BA (1982) Alcohol dependence syndrome: measurement and validation. J Abnorm Psychol 91:199–209. [DOI] [PubMed] [Google Scholar]
- Sliedrecht W, de Waart R, Witkiewitz K, Roozen HG (2019) Alcohol use disorder relapse factors: a systematic review. Psychiatry Res 278:97–115. [DOI] [PubMed] [Google Scholar]
- Symons M, Feeney GFX, Gallagher MR, Young RM, Connor JP (2019) Machine learning vs addiction therapists: a pilot study predicting alcohol dependence treatment outcome from patient data in behavior therapy with adjunctive medication. J Subst Abuse Treat 99:156–162. [DOI] [PubMed] [Google Scholar]
- Symons M, Feeney GFX, Gallagher MR, Young RM, Connor JP (2020) Predicting alcohol dependence treatment outcomes: a prospective comparative study of clinical psychologists versus ‘trained’ machine learning models. Addiction 115:2164–2175. [DOI] [PubMed] [Google Scholar]
- Van Calster B, McLernon DJ, van Smeden M, Wyants L, Steyerberg EW (2019) Calibration: the Alchilles heel of predictive analytics. BMC Medicine 17: 230. [DOI] [PMC free article] [PubMed] [Google Scholar]
- Walitzer KS, Dearing RL (2006) Gender differences in alcohol and substance use relapse. Clin Psychol Rev 26:128–148. [DOI] [PubMed] [Google Scholar]
- Witkiewitz K (2011) Predictors of heavy drinking during and following treatment. Psychol Addict Behav 25:426–438. [DOI] [PMC free article] [PubMed] [Google Scholar]
Associated Data
This section collects any data citations, data availability statements, or supplementary materials included in this article.