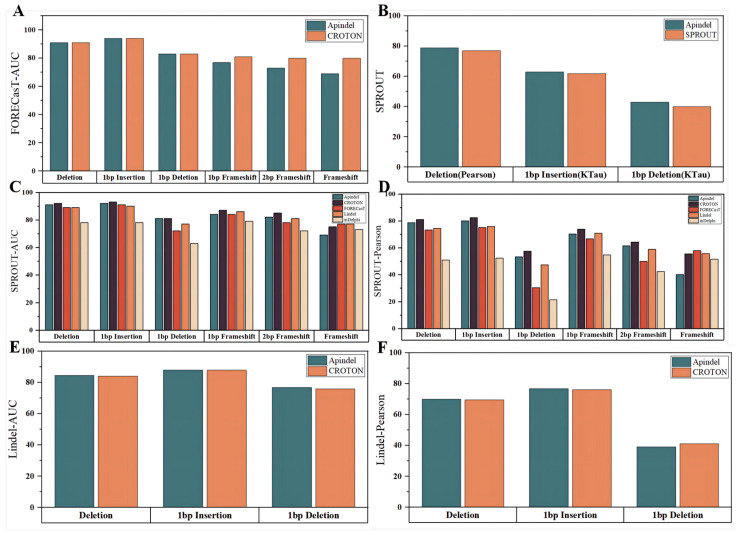
Figure 4.
Performance comparison. The horizontal coordinates indicated the prediction tasks and the vertical coordinates indicated the prediction performance of the models on the corresponding datasets, characterized by the corresponding evaluation metrics. Different colors indicated different models. (A) Shows the AUC values of Apindel and CROTON on the FORECasT test set. (B) Indicates the comparison of the prediction performance of Apindel and SPROUT on the SPROUT test set. (C,D) Denotes the AUC values and Pearson correlation coefficients of Apindel, inDelphi, CROTON, FORECasT, and Lindel on the SPROUT test set. (E,F) Represents the comparison of Apindel and CROTON on the Lindel test set.

