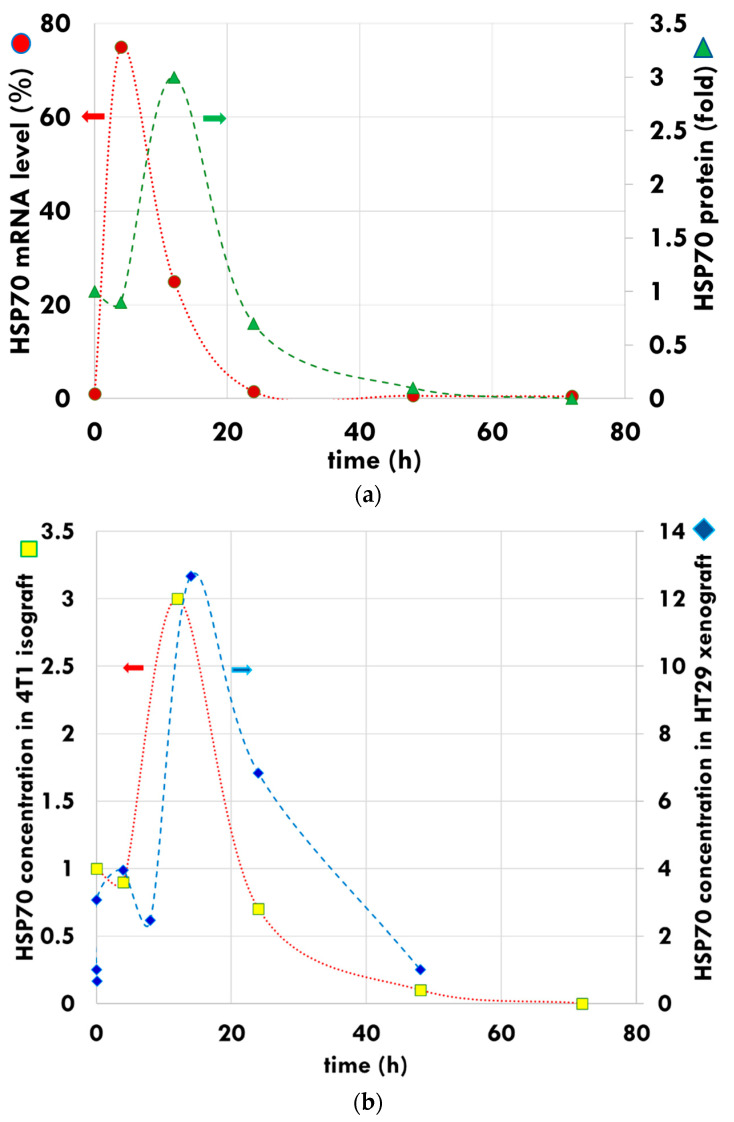
Figure 5.
Development of iHSP by mEHT. (a) The HSP70 peak is indicated at mRNA level (dots, left axis) approximately eight hours earlier than the measured HSP70 folded protein peak (triangles, right axis). (b) The HSP peak has similar features in the measurements of the 4T1 isograft (square, left axis) and HT29 xenograft (diamond, right axis). The curves are for guiding the eye.

