

Abstract
Bilirubin‐IX‐α (BR) is an endogenous molecule with a strong antioxidant feature due to its ability to scavenge free radicals. In this paper, we demonstrated that BR, at concentrations close to those found within the cell (0.1–2.5 μM), acted as a denitrosylating agent and increased the release of nitric oxide from S‐nitrosoglutathione (GSNO) and S‐nitrosocysteine (SNOC) (2.5 μM). The complexation of BR with saturating concentrations of human serum albumin (HSA, 2.5 μM) did not further increase nitric oxide release from GSNO and SNOC. At concentrations similar to those reached in plasma (5–20 μM), BR denitrosylated S‐nitroso‐HSA (2.5 μM), the main circulating S‐nitrosothiol, and this effect was potentiated by the complexation of BR with saturating HSA (20 μM). Furthermore, the product(s) of the reaction between nitric oxide and BR were identified. Ultraviolet and mass spectrometry analysis revealed that nitric oxide binds to BR forming a N‐nitroso derivative (BR–nitric oxide) with extinction coefficients of 1.393 mM−1cm−1 and 2.254 mM−1cm−1 in methanol and NaOH, respectively. The formation of BR–nitric oxide did not occur only in a reconstituted system, but was confirmed in rat fibroblasts exposed to pro‐oxidant stimuli. These results provided novel insights on the antioxidant characteristic of BR through its interaction with nitric oxide, a gaseous neurotransmitter with a well‐known dual effect, namely neuroprotective under physiological conditions or neurotoxic if produced in excess, and proposed BR–nitric oxide as a new biomarker of oxidative/nitrosative stress.
Keywords: bilirubin, denitrosylation, heme oxygenase, nitric oxide, S‐nitrosothiols
Introduction
Bilirubin‐IX‐α (BR) is the final product of heme metabolism. Two enzymes are responsible for BR formation: heme oxygenase (HO) and biliverdin reductase (BVR) [1, 2]. The microsomal HO catalyses the specific oxidation of the α‐meso‐carbon bridge of the heme moieties resulting equimolecular amounts of ferrous iron, carbon monoxide and biliverdin‐IX‐α (BV) [2]. This latter is then reduced by the cytosolic BVR to BR [1]. Once formed within the cell, BR reaches the extravascular space and the bloodstream either by passive diffusion or active transport [3, 4]. In the bloodstream BR binds to albumin (HSA), which serves as a carrier, and arrives at the liver. Within the liver, BR dissociates from HSA and enters the hepatocytes, where it is conjugated with glicuronic acid and then excreted mainly through the faeces [3].
In the last 20 years, many research papers have demonstrated that BR is an endogenous cytoprotective molecule. The first evidence about the antioxidant activity of BR was provided by Stocker and colleagues in 1987 who suggested that BR may act as chain‐breaker because of its ability to scavenge peroxyl radicals transforming itself in a stable carbon centred radical [5, 6]. Later, Snyder and colleagues based on the evidence that BR, in the nanomolar range, may protect cortical neurons from the toxicity elicited by ∼10,000 times higher levels of hydrogen peroxide [7], proposed a novel mechanism based on an amplification cycle whereby BR is oxidized to BV by reactive oxygen species and then recycled by BVR back to BR [8]. However, only a small fraction of the bile pigments undergo this redox cycle and, therefore, the relevance of this mechanism of action is still debated. Finally, BR has been shown to serve as an endogenous scavenger for both nitric oxide and reactive nitrogen species, which may alter the redox status of the cell and originate nitrosative stress [9, 10, 11, 12, 13]. Despite this important antioxidant behaviour, if produced in excess, as during haemolytic anaemia or sepsis, unconjugated BR becomes neurotoxic through multiple mechanisms involving the disruption of cell membrane structure, the reduction of mitochondrial transmembrane potential and the activation of the apoptotic cascade [3].
Nitric oxide is a gaseous molecule generated by the enzymatic activity of the three isoforms of nitric oxide synthase and it plays a main role in the regulation of physiological functions such as neurotransmission, the regulation of blood vessel tone and the immune response [9, 14]. Nitric oxide shares with BR the dual role of cytoprotective or cytotoxic agent, depending on its concentration and/or the signalling transduction pathway involved [9, 14, 15]. Among the intracellular mechanisms through which nitric oxide regulates cell signalling, worth mentioning is S‐nitrosylation, in which nitric oxide binds covalently to thiol group(s) of proteins and non‐protein molecules thus forming S‐nitrosothiols (RSNO) [16, 17]. The neuroprotective and neurotoxic effects of nitric oxide through S‐nitrosylation as well as the general features and potential pharmacological interest of RSNO have been extensively revised [9, 16, 18].
In this paper, the direct evidence that physiological concentrations of unconjugated BR, free or complexed with saturating concentrations of HSA, denitrosylate low molecular weight (l.m.w.) RSNO, such as S‐nitrosocysteine (SNOC) and S‐nitrosoglutathione (GSNO) as well as the high molecular weight (h.m.w.) RSNO S‐nitroso‐albumin (SNO–HSA), has been provided. Furthermore, the formation of a new chemical entity, such as the N‐nitroso derivative of BR (BR–nitric oxide), both in reconstituted system and in rat fibroblasts exposed to oxidative and nitrosative stress, has been demonstrated.
Materials and methods
Chemicals
All chemicals were purchased from Sigma (Sigma‐Aldrich, Milan, Italy), unless otherwise specified. Bilirubin (Frontier Scientific, Carnforth, Lancashire, UK) was dissolved in sodium hydroxide (0.1 M) at a concentration of 10 mM and further diluted in double‐distilled water. Bilirubin solution was freshly prepared before each experiment and protected from light. The formation of the BR–HSA complex, at saturating concentrations of the protein, was allowed by incubating BR and HSA for 10 min. at 37°C in the dark at a ratio up to 1:1 [10 and references therein]. Sulphanilamide (SA, with or without 0.2% mercuric chloride) and N‐(1‐naphthyl)ethyl‐enediamine (NNED) were dissolved in HCl (0.5 M) at the working solution of 1% (w/v) and 0.02% (w/v), respectively. The fluorescent cell‐permeant dye 4‐amino‐5‐ methylamino‐2′,7′‐difluorofluorescein (DAF‐FM) diacetate was purchased from Molecular Probes (Invitrogen, Carlsbad, CA, USA). All the organic solvents used were high‐performance liquid chromatography (HPLC) grade.
Preparation of RSNO and stability of solutions
GSNO and SNOC were prepared as described by Arnelle and Stamler [19], whereas SNO–HSA was synthesized as follows. Commercially available fatty acid free HSA is formed by a mixture of both thiol‐reduced and thiol‐oxidized protein and the amount of the former is ∼0.25 ± 0.02 thiol/mol (N= 8). To increase the yield of SNO–HSA, the protein was treated with reducing agents such as dithiothreitol (DTT, 100 mM) and β‐mercaptoethanol (β‐ME, 100 mM) at 4°C for 30 min.; at the end of incubation excess DTT and β‐ME were removed by chromatography through a Sephadex‐G25 column. By this procedure, the amount of reduced thiols in the protein increased to 1.05 ± 0.1 thiol/mol (N= 8). This reduced HSA was then reacted with an equal concentration of nitrite in HCl (0.5 M) to form SNO–HSA. The effective concentrations of the stock solutions of RSNO were assessed by the Saville assay (see below). Previous studies have established that essentially no nitrite remains in the RSNO solutions using this synthetic method [20, 21]. S‐nitrosothiols were further diluted in phosphate buffered saline (PBS)/ethylenediaminetetraacetic acid (EDTA) (0.1 mM) to the desired concentration. Because RSNO are rather unstable in solution, they were freshly prepared before the experiments, protected from light and used within 10 min. from the preparation.
RSNO determination
The concentration of RSNO was determined as previously described by the Saville method with modifications. Briefly, GSNO and SNOC (2.5 μM) were incubated with BR (0.1–2.5 μM) or HSA (2.5 μM)‐bound BR, whereas SNO–HSA (2.5 μM) was reacted with BR alone (1–20 μM) or complexed with HSA (20 μM) in PBS/EDTA (0.1 mM), pH 7.4 (1 ml) at 37°C with continuous shaking. At 0, 1, 2, 5 and 10 min. of incubation, 600 μl of sample was divided in two aliquots: 300 μl were mixed with an equal volume of 1% SA and the remainder with 1% SA plus 0.2% mercuric chloride (which specifically breaks the S–nitric oxide bond) and incubated for further 15 min. At the end of incubation, 0.02% NNED was added to all samples and incubated for an additional 15 min. at room temperature. Absorbance values were measured spectrophotometrically at 540 nm, by using a Hewlett‐Packard 8453 Ultraviolet‐Visible‐Near infrared (UV‐VIS‐NIR) spectrophotometer (Hewlett‐Packard, currently, Agilent Technologies Inc. Palo Alto, CA, USA). The contribution of RSNO‐derived nitrite was calculated subtracting the absorbance of the sample incubated in the absence of mercuric chloride (which measures the amount of non‐RSNO‐derived nitrite) to the respective one incubated in the presence of mercuric chloride (which measures the amount of total nitrite). Because BR and nitrite have overlapping spectra and to avoid any possible bias in calculating the correct isosbestic point, nitrite production was evaluated by measuring the area under the spectral curve at 540 nm. S‐nitrosothiols concentrations were calculated by reference to a standard curve of GSNO (0.39–50 μM) in PBS/EDTA (0.1 mM), pH 7.4. By this method, a linear fitting (r 2= 0.99) has been obtained and the detection limit of the assay was 0.39 μM GSNO.
Because stock solutions of RSNO and BR were prepared in strong acidic and alkaline environments, respectively, the pH of the reaction mixture was always measured before the beginning of the experiment. Only minor modifications with respect to pH 7.4 were observed. Because BR and RSNO are light sensitive, all experiments were performed in subdued light.
Synthesis, purification and identification of nitrosated bilirubin
In a first set of experiments BR was nitrosated as follows. Briefly, BR (10 mM) in NaOH (0.1 M) was mixed with an equal volume of sodium nitrite (10 mM) in the presence of HCl (0.5 M), pH 5 at 37°C for 2 hrs; this method has been previously used to bind nitric oxide to non‐cysteine residues [22]. However, because the main intracellular source of nitric oxide is represented by l.m.w. RSNO [16], in a second series of experiments BR was nitrosated using SNOC as nitrosating agent. Briefly, BR (10 mM) in NaOH (0.1 M) was mixed with an equal volume of SNOC (10 mM) in PBS/EDTA (0.1 mM), pH 7.4 at 37°C for 2 hrs. At the end of incubation, the sample was neutralized and subjected to further analysis for the characterization of the potential new compound(s) formed. Nowadays, the combined use of UV, HPLC /mass (HPLC/MS) and high‐resolution mass spectrometry (HRMS) is considered an ideal approach for the evaluation of new chemical entities.
UV: The UV spectra were performed by V‐530 JASCO spectrophotometer (Jasco‐Europe, Cremella, Italy).
HPLC/MS: The HPLC/MS was carried out in a Waters Corporation system (Milford, MA, USA) composed of an autosampler/collector Waters 2767 sample manager, a 600E pump working in analytical mode, a 486 UV detector and a ZSpray™ Mass Detector (ZMD) mass spectrometer equipped with an electron spray ionization (ESI) source. The separation was performed using a 250 × 4.6 mm 5 μ reversed‐phase C18 Luna‐Phenomenex column at a flow rate of 1 ml/min. The run time was 30 min. The gradient was built using 0.5 M ammonium acetate in H2O (solution A) and acetonitrile (solvent B) as eluting phase, in the following proportion, given as percent volume of solvent B in the total mixture: the column was equilibrated with 5% solvent B and kept at this concentration for the first 5 min. after injection; there followed a linear gradient of solvent B from 5% to 80% over a period of 30 min. After this, the column was re‐equilibrated at 5% solvent B for a new injection. The MS conditions were as follows: capillary voltage 3.15 kV, cone voltage 7 V, extractor 2 V, radio frequency (RF) lens 0.34 V, source block and desolvation temperature 120°C and 250°C, respectively, ion energy 0.5 V, low mass (LM) resolution 14.5, high mass (HM) resolution 15.0 and multiplier 650 V. The nebulizer gas was set to 650 l/hr. The samples were collected at the exhaust of the UV detector at the same time as the appearance of the mass signal.
HRMS: The HRMS experiments were carried out in a hybrid Q‐Star Pulsar‐i (MDS‐Sciex Applied Biosystems, Toronto, Canada) mass spectrometer equipped with an ion spray ionization source. Samples were introduced by direct infusion (5 μl/min.) of the solution coming from the HPLC/MS separation at the optimum ion spray voltage of 4800 V. The nitrogen gas flow was set at 30 psi and the declustering and the focusing potentials were kept at 70 and 140 V relative to ground, respectively. MS experiments were performed in the collision cell q on the isotopically pure (12C) peak of the selected precursor ions by keeping the first quadrupole analyser at unit resolution, and scanning the TOF analyser. The collision energy was set to 25 eV, for each compound, while the gas pressure of the collision chamber was regulated at the instrumental parameters CAD 5, which corresponds to a pressure of the chamber of 6.86 × 10⁻³ Torr and a gas thickness of 9.55 × 10¹⁵ molecules/cm2. All the acquisitions were averaged over 60 scans at a TOF resolving power of 8000. The molecular formula was evaluated by means of Analyst™ QS Software (MDS‐Sciex).
For the calculation of the molar extinction coefficient (ε), a standard curve was prepared by diluting known concentrations of BR–nitric oxide in methanol or NaOH and then plotted against their absorbance at 316 nm. The slope of the line represented the ε.
Cell culture experiments
The Rat‐1 diploid immortalized rat fibroblasts were grown and maintained in Eagle’s minimum essential medium supplemented with 10% heat inactivated foetal bovine serum (FBS) and 2 mM glutamine at 37°C, in a humidified 5% CO2 atmosphere. To evaluate the effects of BR and SNOC on cell viability, cells were plated in triplicate in 24‐well plates at a density of 5 × 10⁴ cells per well and allowed to adhere 24–36 hrs. They were then incubated with increasing doses of BR (0.2–0.5–1‐2–5‐10 μM) or SNOC (0.2–0.5–1‐2–5‐10–100 μM) for 2 hrs. Control cells were incubated with comparable amount of the vehicle. After treatment, the medium was removed and cultures were incubated with fresh medium containing 1 mg/ml MTT (3‐[4,5‐dimethylthiazol‐2‐yl]‐2,5‐diphenyltetrazolium bromide) for 2 hrs at 37°C. The medium was then discarded and acid isopropanol (0.04 M HCl in isopropanol) was added to each well to stop the cleavage of the tetrazolium ring by the dehydrogenase enzymes that convert MTT to an insoluble purple formazan in living cells. Plates were then kept in agitation at room temperature for about 15–20 min. and the level of the coloured formazan derivative was determined on a multiscan reader at a wavelength of 540 nm (reference wavelength 630 nm).
To evaluate the denitrosylating activity of BR, Rat‐1 cells were pre‐incubated with BR (0.5 μM) alone for 1 hr and in the presence of the cell‐permeable nitric oxide fluorescent probe DAF‐FM‐diacetate (5 μM) for additional 1 hr. Fifteen minutes before the end of incubation SNOC (5 μM) was added. At the end of incubation, after a quick detachment from the plate, Rat‐1 cells were subjected to flow cytometry. Nitric oxide amount was expressed as DAF‐FM diacetate fluorescence percentage of control value.
For the evaluation of the intracellular formation of BR–nitric oxide, Rat‐1 cells were treated with hemin (500 μM) or H2O2 (500 μM) in serum free medium for 6 hrs. Medium was then discarded and replaced with fresh medium without serum for additional 18 hrs. Parallel cultures were treated with bacterial lipopolysaccharide (LPS, 2 μg/ml) in medium containing 1% FBS for 24 hrs. Afterwards, cell medium was collected for the measurement of BR and nitrite whereas cells were gentle scraped and centrifuged to obtain the pellet. This latter was then extracted with 0.5 ml methanol and underwent matrix‐assisted laser desorption/ionization‐time of flight mass spectrometry (MALDI‐TOF/TOF MS/MS). MALDI spectra were recorded on a 4700 Proteomics analyser with TOF/TOF optics (Applied Biosystems, Foster City, CA, USA). A 200‐Hz frequency‐tripled Nd:YAG laser was used. An average of 5000 to 8000 laser shots were used to acquire the MS/MS spectra from α‐CHCA matrix. The collisions were carried out using air as collision gas and by setting the collision energy at 1 KV, defined as the difference between the accelerating potential, fixed at 8 kV and the floating cell, kept at 7 kV. The internal calibration was performed by using five peptides in the range 900–2500 u as standards. MALDI spectra were elaborated by in‐house software packages. MASCOT was used for database search.
Spectrophotometric determination of biliverdin and bilirubin formation
The formation of BV was evaluated as previously described [10]. The amount of BR formed by Rat‐1 exposed to hemin, H2O2 and LPS was measured in the cell culture medium as described by Turcanu et al.[23].
Nitrite
The amount of nitrite formed by Rat‐1 exposed to hemin, H2O2 and LPS was measured in the cell culture medium by using the Griess method as previously described [11]. Briefly, at the end of the incubation, 300 μl of medium was mixed with equal volumes of 1% SA and 0.02% NNED and incubated for 15 min. at room temperature. Absorbance values were measured at 540 nm and nitrite concentrations calculated by reference to a standard curve of nitrite in PBS/EDTA (0.1 mM).
Thiol content
Thiol concentration was assayed by using the Ellman reagent [24].
Statistical analysis
Data are expressed as mean ± S.E.M. of (N) replicates per group. Statistical analysis was performed using anova combined with Dunnet’s or two‐tailed Student’s t‐tests for comparison within the same group or two groups, respectively. Differences were considered significant at P < 0.05. The initial rate of nitric oxide release and the EC50 values were calculated by nonlinear regression analysis using a Prism 4.0 software (GraphPad Software).
Results
Characterization of the experimental system
Because it is well established that iron or copper (which often contaminate buffer salts) catalyse the rapid homolytic decomposition of RSNO into RS− and nitric oxide [25], all the experiments were performed in PBS (10 mM, pH 7.4) supplemented with EDTA (0.1 mM). The chelator stabilized GSNO, SNOC and SNO–HSA, which exhibited a spontaneous rate of nitric oxide release of 0.011 ± 0.001, 0.010 ± 0.002 and 0.020 ± 0.0015 μM/min., respectively (N= 6).
To exclude the possibility that the modification in RSNO concentration was due to the NaOH in which BR was dissolved, control experiments were performed by adding increasing concentrations of NaOH to RSNO. At concentrations up to 200 μM NaOH did not show any significant effect on RSNO denitrosylation (data not shown).
Bilirubin denitrosylated S‐nitrosothiols
Bilirubin (0.5 μM) denitrosylated the l.m.w. S‐nitrosothiols GSNO and SNOC (2.5 μM) in a time‐dependent manner (Figs 1A and 2A). Kinetic analyses have shown that the denitrosylating effect of BR on GSNO and SNOC proceeded very rapidly. In fact ∼66% of GSNO and SNOC were degraded within the first 2.5 min. of incubation with BR and the reaction reached the plateau after 5–10 min. Further studies, performed by incubating the bile pigment with RSNO for 5 min., have shown that BR (0.1–2.5 μM) denitrosylated both GSNO and SNOC (2.5 μM) in a dose‐dependent manner and this effect became significant as little as 0.2 μM BR (Figs 1B and 2B). Finally, BR (0.1–2.5 μM) dose‐dependently increased the initial rate of nitric oxide release from both GSNO and SNOC (Figs 1C and 2C). When BR (0.1–2.5 μM) was complexed with a saturating concentration of HSA (2.5 μM) its ability to denitrosylate GSNO and SNOC was unchanged; however, 0.5–2.5 μM BR–HSA reduced the initial rate of nitric oxide release with respect to BR alone (Figs 1C and 2C). Similar results have been obtained when BR was tested at concentrations close to those reached in plasma. Under this condition, BR (1–20 μM) denitrosylated the h.m.w. S‐nitrosothiol SNO–HSA (2.5 μM) in a time‐ and dose‐dependent fashion (Fig. 3A and B) and the complexation with saturating HSA (20 μM) increased the ability of the bile pigment to denitrosylate SNO–HSA and release nitric oxide (Fig. 3A, B and C). To better understand the role of HSA in the interaction between BR and RSNO the ‘pharmacodynamic’ parameters potency and efficacy were calculated (Table 1). The potency was expressed as EC50, namely the concentration of BR or BR–HSA, which denitrosylates the 50% of both the l.m.w. and h.m.w. RSNO, whereas the efficacy or maximal activity indicates the overall ability of BR or BR–HSA to denitrosylate RSNO and was expressed as percent of the initial concentration of RSNO. As shown in Table 1, the complexation with saturating HSA decreased both the potency and efficacy of BR to denitrosylate RSNO.
Figure 1.
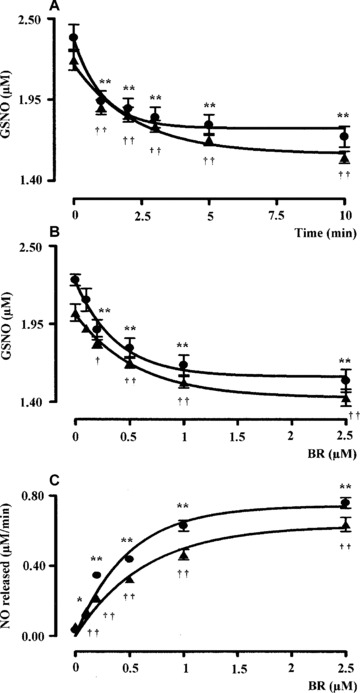
(A) Kinetic analysis, (B) dose–response curve and (C) initial rate of NO release following the interaction of bilirubin with S‐nitrosoglutathione (GSNO). (A) Bilirubin alone (BR, 0.5 μM, filled circle) or complexed with human serum albumin (HSA, 2.5 μM, filled triangle) was reacted with the l.m.w. S‐nitrosothiol GSNO (2.5 μM) in PBS/EDTA (0.1 mM), pH 7.4 at 37°C in the dark and the degradation of GSNO was monitored over time by spectrophotometric analysis as described in ‘Materials and methods’. (B) Bilirubin alone (0.1–2.5 μM, filled circle) or complexed with HSA as above (filled triangle) were reacted with GSNO 2.5 μM in PBS/EDTA (0.1 mM), pH 7.4 for 5 min. at 37°C in the dark and the degradation of GSNO was calculated as explained in ‘Materials and methods’. (C) The initial rate of nitric oxide release calculated from (B) was plotted against the respective BR/BR–HSA concentration as above. Data are expressed as mean ± S.E.M. of six replicates per group. * or † P < 0.05 and ** or †† P < 0.01 versus time 0 in (A) and 0 μM BR in (B–C) (anova corrected by Dunnet’s post hoc test). Furthermore, in (C) P < 0.05 between 0.5–2.5 μM BR–HSA versus BR alone (Student’s t‐test).
Figure 2.
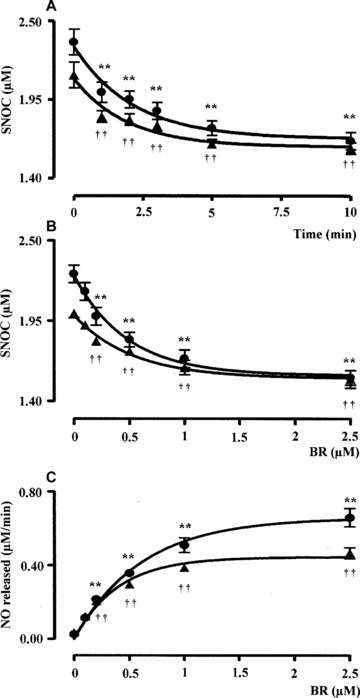
(A) Kinetic analysis, (B) dose–response curve and (C) initial rate of nitric oxide release following the interaction of bilirubin with the l.m.w. S‐nitrosocysteine (2.5 μM). Experimental conditions and symbols were the same as in Fig. 1. Data are expressed as mean ± S.E.M. of six replicates per group. * or † P < 0.05 and ** or †† P < 0.01 versus time 0 in (A) and 0 μM BR in (B–C) (anova corrected by Dunnet’s post hoc test). Furthermore, in (C) P < 0.05 between 0.5–2.5 μM BR–HSA versus BR alone (Student’s t‐test).
Figure 3.
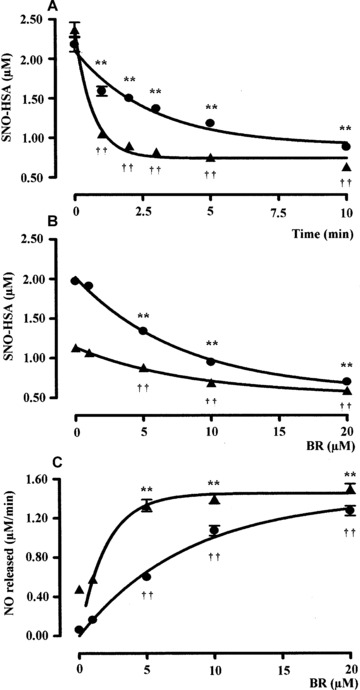
(A) Kinetic analysis, (B) dose–response curve and (C) initial rate of nitric oxide release following the interaction of bilirubin with S‐nitrosoalbumin. (A) Bilirubin alone (BR, 5 μM, filled circle) or complexed with human serum albumin (HSA, 20 μM, filled triangle) was reacted with the h.m.w. RSNO S‐nitrosoalbumin (SNO–HSA, 2.5 μM) in PBS/EDTA (0.1 mM), pH 7.4 at 37°C in the dark and the degradation of SNO–HSA was monitored over time by spectrophotometric analysis as described in ‘Materials and methods’. (B) Bilirubin alone (1–20 μM, filled circle) or complexed with HSA as above (filled triangle) were reacted with SNO–HSA 2.5 μM in PBS/EDTA (0.1 mM), pH 7.4 for 5 min. at 37°C in the dark and the degradation of SNO–HSA was calculated as explained in ‘Materials and methods’. (C) The initial rate of nitric oxide release calculated from (B) was plotted against the respective BR/BR–HSA concentration as above. Data are expressed as mean ± S.E.M. of six replicates per group. ** or †† P < 0.01 versus time 0 in (A) and 0 μM BR in (B‐C) (anova corrected by Dunnet’s post hoc test). Furthermore, in (A) P < 0.05 between 1–10 min. of incubation with BR–HSA and in (B–C) P < 0.05 between 1–20 μM BR–HSA versus BR alone (Student’s t‐test).
Table 1.
Biochemical parameters regarding the ability of BR or BR–HSA to denitrosylate S‐nitrosoglutathione (GSNO), S‐nitrosocysteine (SNOC) and S‐nitroso‐human serum albumin (SNO–HSA)
| BR | BR–HSA | |||
|---|---|---|---|---|
| EC50 (μM) | Maximal activity (%) | EC50 (μM) | Maximal activity (%) | |
| GSNO | 0.29 ± 0.023 | 34 ± 3 | 0.55 ± 0.032** | 34 ± 4 |
| SNOC | 0.26 ± 0.016 | 35 ± 1 | 0.31 ± 0.012* | 23 ± 2** |
| SNO–HSA | 2.45 ± 0.110 | 61 ± 3 | 3.74 ± 0.220** | 51 ± 1* |
Both EC50 and maximal activity have been calculated on the dose–response curve after 10 min. of incubation, a time‐point at which the denitrosylating ability of BR/BR–HSA was maximal. Data are expressed as mean ± S.E.M. of six replicates per group. *P < 0.05 and **P < 0.01 versus BR alone.
The ability of BR to increase RSNO‐derived nitric oxide release was also confirmed in Rat‐1 fibroblasts. In preliminary experiments, treatment with BR (up to 10 μM for 2 hrs) or SNOC (up to 100 μM for 2 hrs) did not affect Rat‐1 cells viability as assessed by using the MTT test (data not shown). In these fibroblasts, the release of nitric oxide from SNOC (5 μM for 15 min.) significantly increased in the presence of BR (0.5 μM for 2 hrs) (control: 100%; SNOC 5 μM: 160 ± 12%*; SNOC 5 μM + BR 0.5 μM: 240 ± 23%†; BR 0.5 μM: 105 ± 10%; data are expressed as DAF‐FM diacetate fluorescence, percent of control, mean ± S.E.M. of three replicates per group; *P < 0.05 versus control and †P < 0.05 versus SNOC).
Characterization of the products derived from the reaction between BR and nitric oxide
As a result of the interaction between BR (2.5 μM) and SNOC (2.5 μM) in PBS/EDTA (0.1 mM) pH 7.4 at 37°C, a peak at 316 nm within the UV spectrum of BR appeared and its absorbance increased with time (1–10 min.) (Fig. 4A), whereas when BR (2.5 μM)‐HSA (2.5 μM) was reacted with SNOC (2.5 μM), BV was the main product formed (30 ± 10% of degraded BR after 10 min., N= 6), thus confirming previous findings [5, 10, 13].
Figure 4.
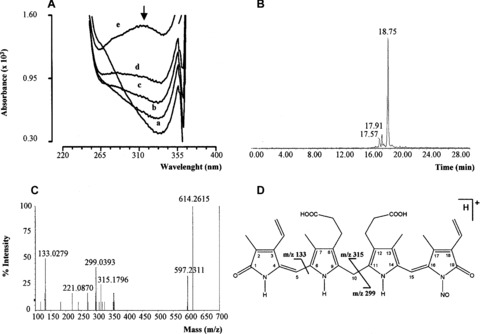
Biochemical analysis of nitrosated bilirubin (BR–nitric oxide) (A) S‐nitrosocysteine (SNOC, 2.5 μM) was added to 2.5 μM bilirubin (BR) in PBS/EDTA (0.1 mM), pH 7.4 at 37°C in the dark and spectra recorded at time 0 (a) and after 1 (b), 2 (c), 5 (d) and 10 (e) minutes. The arrow indicates peak at 316 nm. Bilirubin (10 mM) was reacted with sodium nitrite (10 mM) in 0.5 M HCl at 37°C for 2 hrs in the dark. At the end of incubation, BR–nitric oxide was analysed by (B) HPLC/MS and (C) MS/MS as described in ‘Materials and methods’. (D) Structure and main fragments of BR–nitric oxide (for further information see text). Representative UV spectra (A), extracted ion chromatogram of BR–nitric oxide (B) and MS/MS spectrum of BR–nitric oxide (C) are shown.
To characterize the product(s) with absorption at 316 nm, a wavelength which was previously shown quite specific for molecules containing N–nitric oxide moieties [26], BR was mixed with acidified nitrite or SNOC (both of which release rapidly nitric oxide) for 2 hrs at 37°C, the deriving product(s) purified by HPLC/MS and then analysed by HRMS in order to obtain the exact formula and infer the possible structure by tandem mass spectrometry (MS/MS). The HPLC/MS analysis demonstrated the presence of several compounds in the reaction mixture containing BR and nitric oxide but, among these, our attention was focused on the species with retention time 18.75 min. (Fig. 4B) because its m/z[M+H]+ 614 was close to the molecular weight of the suggested BR–nitric oxide. For this reason, the compound was further analysed by HRMS that confirmed a peak with m/z 614.2586 corresponding to the formula [C33H36N5O7]+ with a mass error of 4.5 ppm and through the MS/MS analysis three fragments with m/z 315, 299 and 133 were identified (Fig. 4C). The analysis of these fragments demonstrated that their molecular weights were compatible with those derived in case of fragmentation of a molecule of BR containing a N–nitric oxide moiety (Fig. 4D).
The final step of the BR–nitric oxide chemical characterization was the calculation of its ε by UV spectroscopy. The apparent ε316 nm was 1.393 mM−1cm−1 and 2.254 mM−1cm−1 in methanol and NaOH, respectively.
Formation of BR–nitric oxide in Rat‐1 fibroblasts
With the purpose to demonstrate the formation of BR–nitric oxide also in living cells, Rat‐1 fibroblasts were exposed to mild pro‐ oxidant conditions which increased the formation of both BR and nitric oxide.
Rat‐1 fibroblasts treated with heme (500 μM for 6 hrs and then plain medium for additional 18 hrs), H2O2 (500 μM for 6 hrs and then plain medium for additional 18 hrs) and LPS (2 μg/ml, 24 hrs) exhibited an increased synthesis of BR and nitric oxide with respect to control cells (Fig. 5). The reason why Rat‐1 fibroblasts were incubated with LPS for 24 hrs rather than 6 hrs (similarly to hemin and hydrogen peroxide) was that the endotoxin, at the concentration 2 μg/ml, was a milder pro‐oxidant than 500 μM heme or hydrogen peroxide (Fig. 5) and therefore a longer time of incubation was necessary. The MALDI‐TOF/TOF MS/MS analysis performed on Rat‐1 cellular extract revealed the formation of a compound with m/z[M+H]+ 614 matching the theoretical isotopic distribution of BR–nitric oxide. The MS/MS displayed the same fragmentation pattern of BR–nitric oxide with the formation of fragments with m/z 462, 327, 299 and 286 (Fig. 6). Importantly, BR–nitric oxide was not found in control Rat‐1 fibroblasts (data not shown).
Figure 5.
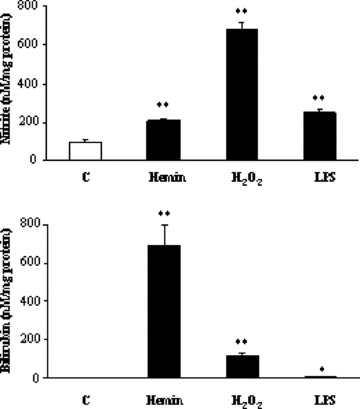
Nitrite and bilirubin formation under pro‐oxidant conditions in Rat‐1 fibroblasts. Rat‐1 fibroblasts were exposed to hemin (H, 500 μM for 6 hrs plus 18 hrs in serum‐free medium), hydrogen peroxide (H2O2, 500 μM for 6 hrs plus 18 hrs in serum‐free medium) and bacterial lipopolysaccharide (2 μg/ml for 24 hrs in 1% FBS medium). At the end of incubation, medium was collected and assayed for nitrite and BR as described under ‘Materials and methods’. Data are expressed as mean ± S.E.M. of three replicates per group. *P < 0.05 and **P < 0.01 versus control (Ctrl).
Figure 6.
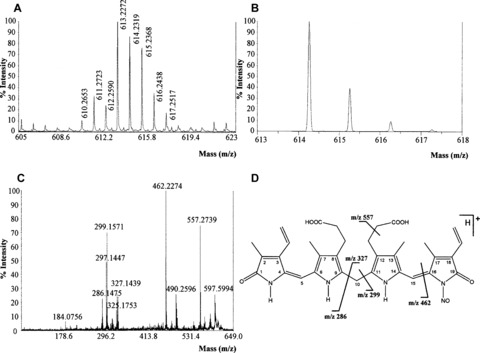
Experimental mass spectrometry of N‐nitrosated bilirubin (BR–nitric oxide). Rat‐1 fibroblasts were treated as in Fig. 5. At the end of incubation, cells were extracted in methanol and subjected to MALDI‐TOF/TOF MS/MS as described under ‘Materials and methods’. Representative experimental MALDI‐MS (A), theoretical MALDI‐MS (B) and MALDI‐MS/MS (C) spectra of BR–nitric oxide are shown. (D) Structure and main fragments of BR–nitric oxide (for further information see text).
Discussion
In this paper, the first direct evidence that BR, at physiological concentrations, denitrosylates RSNO and increases nitric oxide release was provided. Furthermore, the formation of a new chemical entity, such as BR–nitric oxide, was also unravelled in both a reconstituted system and in Rat‐1 fibroblasts. The main goal of this study was to mimic in vitro the physiological interaction between RSNO and BR occurring within the cell or in the bloodstream. Therefore, both RSNO and BR have been used at pathophysiological concentrations. SNOC and GSNO are the main non‐protein RSNO in cells and extracellular fluids and their concentration has been found to be ∼0.1 μM [16, 27, 28]. However, this concentration significantly increases during oxidative stress‐related conditions, such as pneumonitis or sepsis, up to 5–10 μM [28, 29]. Interestingly, some brain areas are endowed with high RSNO concentration; in rat cerebellum the concentration of GSNO has been estimated to be 6–8 μM [30]. With regard to BR, its intracellular concentration strictly depends on the cell type and whether or not a stressful situation occurs; indeed, in fibroblasts, macrophages and aortic endothelial cells BR concentration has been found in the range 0.5–2 μM [23, 31, 32]. On the contrary, SNO–HSA is the main RSNO in the bloodstream [33] and its concentration ranges from 1 μM, under physiological conditions, up to 6 μM in diseases such as pre‐eclampsia [34]. Concerning BR, its plasma levels are 5–15 μM and it is bound to saturating concentrations of HSA [3, 5, 6].
An important point strictly related to the concentrations of BR used in this study is the possibility that the bile pigment, at high concentrations, may form insoluble aggregates; according to some literature, the solubility limit for unconjugated BR in aqueous solution should be ∼70 nM [4]. Furthermore, BR may precipitate if dissolved in buffers or cell culture media containing high calcium or magnesium. In fact, it has been shown that in the presence of calcium BR forms calcium bilirubinate and precipitates [35, 36]. This reaction is very common also in human beings and is responsible for the formation of a particular type of gallstones in patients suffering from pre‐hepatic jaundice [37]. In order to overcome these limitations due to BR solubility, the bile pigment is often complexed with HSA. Once bound to albumin, the amount of free BR is lower than the total (bound + free) BR concentrations [4]. On this basis some investigators attributed at the low concentration of BR released by BR–HSA the effects of BR in biological systems. However, in our opinion, the biological effects seen when BR is complexed with HSA should be ascribed to the BR–HSA complex per se. In fact, previous studies clearly demonstrated that the complexation of BR with albumin does not alter significantly its uptake from cells [38] and does not reduce the efficacy of the bile pigment to scavenge peroxyl radicals [5]. Indeed, chemical studies have shown that when BR binds albumin the tetrapyrrole rings are ‘entrapped’ by the protein but the reactive hydrogen atom at C‐10 is exposed and available for chemical reactions [5]. According to this idea are the results which demonstrate that BR–HSA denitrosylates l.m.w. RSNO at a similar extent than BR. However, as shown in Figs. 1 and 2 and summarized in Table 1, the complexation with HSA reduces the affinity of BR for GSNO and SNOC as well as the maximal activity and the initial rate of nitric oxide release. The denitrosylating effect of BR has been confirmed in rat fibroblasts pre‐treated with SNOC and exposed to BR in a serum‐free HSA‐containing medium; under this condition, BR significantly increased the amount of nitric oxide released by SNOC. The rationale for the use of Rat‐1 cells for this experiment is because their cell cycle and replication time are close to those found in several human cells and they have a well‐characterized sensitivity to oxidative stress [32]. All these characteristics make Rat‐1 cells a valuable model to study a variety of physiological and pathological processes. The denitrosylating activity of BR–HSA was also confirmed against SNO–HSA; in this last case, BR–HSA significantly increased the initial rate of nitric oxide release but its affinity for the RSNO was lower than BR. The reason why HSA reduces the affinity of BR for SNO–HSA is not easy to explain and out of the scope of this paper. The possible interaction between the two molecules of HSA and the steric hindrance could be a plausible explanation. Taken together, these results demonstrate that both BR and BR–HSA denitrosylate l.m.w. and h.m.w. RSNO, respectively. These experimental conditions are strictly related to those in which BR exerts its pathophysiological conditions within the cell and in the bloodstream.
An intriguing result of this study was the discovery of a new chemical entity formed during the reaction of BR and nitric oxide, namely BR–nitric oxide. As a matter of fact, the formation of a N‐nitroso product of BR was suggested by our group in 2003 [11], but its complete identification was performed in the current study. It is noteworthy that the formation of this species did not occur only during the in vitro reaction between BR and nitric oxide, but also in cells exposed to oxidative/nitrosative stress, thus further confirming its biological relevance. This result contributes to close a loop in the biochemistry of BR and nitric oxide. In fact, several lines of evidence have shown that during oxidative/nitrosative stress a marked increase of both nitric oxide and BR occurs, mainly through the inducible nitric oxide synthase and the inducible HO (HO‐1)/BVR systems, respectively [15, 39, 40]. Furthermore, it has been shown that nitric oxide and reactive nitrogen species increased both HO‐1 expression and activity [15]. This positive feedback may be considered as a double‐edged sword. Although the cytoprotective activity of physiological BR and nitric oxide is no longer matter of question, they may become toxic for cells and tissues, including brain, if produced in excess, as during pro‐oxidant conditions [9, 12, 41]. Within this frame, the formation of BR–nitric oxide could be considered as a potential mechanism through which two dangerous molecules, may reciprocally scavenge each other thus damping down an exaggerated toxic response for cells. In addition, the formation of BR–nitric oxide under pro‐oxidant conditions put forth the possibility to consider the nitrosated bile pigment as a marker of oxidative/nitrosative stress similarly to nitrotyrosine [9]. Moreover, in selected brain areas, such as the cerebellum, endowed with both HO and BVR activities [42] along with GSNO levels in the micromolar range [30], the interaction between BR and nitric oxide becomes very attractive also under basal conditions. In fact, BR by increasing nitric oxide release by GSNO, may contribute to the physiological actions of this gaseous neurotransmitter such as synaptic plasticity and neuroprotection (for an exhaustive review on this topic see [9]).
The formation of BR–nitric oxide documented in this paper may have important implications in clinics, too. Liver cirrhosis is a clinical syndrome characterized by a massive destruction of hepatic parenchyma secondary to infectious or non‐infectious disorders [43]. Common laboratory findings in cirrhotic patients are a significant increase in both BR and conjugated BR (due to impaired uptake, conjugation and excretion of the bile pigment) along with a decrease in HSA plasma levels [44]. Moreover, portal hypertension and oesophageal variceal bleeding are common complications of hepatic cirrhosis, in particular at later stages of the disease [43]. In these patients, the local administration of GSNO or SNOC may have a dual effect: firstly, to favour the formation of BR–nitric oxide, which is much more water‐soluble than BR and therefore easily excreted, and secondly, to release nitric oxide which could dilate portal vein and decrease hypertension.
Taken together, the results shown in this paper unravelled a new mechanism of action, i.e. RSNO denitrosylation, through which BR may exert its typical effects in tissues and demonstrated the formation of nitrosated BR as an effect of the BR/nitric oxide interaction. This finding may have important repercussion not only for basic but also for clinical research.
Acknowledgements
This work was supported by Fondi Ateneo 2007 and 2008 (to C.M.). The contribution of Mr. Francesco Demetrio Minuto for graphic assistance is gratefully acknowledged. The authors state that no conflict of interest exists.
References
- 1. Kutty RK, Maines MD. Purification and characterization of biliverdin reductase from rat liver. J Biol Chem . 1981; 256: 3956–62. [PubMed] [Google Scholar]
- 2. Maines MD. Heme oxygenase: function, multiplicity, regulatory mechanisms, and clinical applications. FASEB J . 1988; 2: 2557–68. [PubMed] [Google Scholar]
- 3. Kapitulnik J. Bilirubin: an endogenous product of heme degradation with both cytotoxic and cytoprotective properties. Mol Pharmacol . 2004; 66: 773–9. [DOI] [PubMed] [Google Scholar]
- 4. Ostrow JD, Pascolo L, Shapiro SM, et al . New concepts in bilirubin encephalopathy. Eur J Clin Invest . 2003; 33: 988–97. [DOI] [PubMed] [Google Scholar]
- 5. Stocker R, Glazer AN, Ames BN. Antioxidant activity of albumin‐bound bilirubin. Proc Natl Acad Sci USA . 1987; 84: 5918–22. [DOI] [PMC free article] [PubMed] [Google Scholar]
- 6. Stocker R, Yamamoto Y, McDonagh AF, et al . Bilirubin is an antioxidant of possible physiological importance. Science . 1987; 235: 1043–6. [DOI] [PubMed] [Google Scholar]
- 7. Dorè S, Takahashi M, Ferris CD, et al . Bilirubin, formed by activation of heme oxygenase‐2, protects neurons against oxidative stress injury. Proc Natl Acad Sci USA . 1999; 96: 2445–50. [DOI] [PMC free article] [PubMed] [Google Scholar]
- 8. Baranano DE, Rao M, Ferris CD, et al . Biliverdin reductase: a major physiologic cytoprotectant. Proc Natl Acad Sci USA . 2002; 99: 16093–8. [DOI] [PMC free article] [PubMed] [Google Scholar]
- 9. Calabrese V, Mancuso C, Calvani M, et al . Nitric oxide in the central nervous system: neuroprotection versus neurotoxicity. Nat Rev Neurosci . 2007; 8: 766–75. [DOI] [PubMed] [Google Scholar]
- 10. Mancuso C, Bonsignore A, Capone C, et al . Albumin‐bound bilirubin interacts with nitric oxide by a redox mechanism. Antioxid Redox Signal . 2006; 8: 487–94. [DOI] [PubMed] [Google Scholar]
- 11. Mancuso C, Bonsignore A, Di Stasio E, et al . Bilirubin and S‐nitrosothiols interaction: evidence for a possible role of bilirubin as a scavenger of nitric oxide. Biochem Pharmacol . 2003; 66: 2355–63. [DOI] [PubMed] [Google Scholar]
- 12. Mancuso C, Pani G, Calabrese V. Bilirubin: an endogenous scavenger of nitric oxide and reactive nitrogen species. Redox Rep . 2006; 11: 207–13. [DOI] [PubMed] [Google Scholar]
- 13. Minetti M, Mallozzi C, Di Stasi AM, et al . Bilirubin is an effective antioxidant of peroxynitrite‐mediated protein oxidation in human blood plasma. Arch Biochem Biophys . 1998; 352: 165–74. [DOI] [PubMed] [Google Scholar]
- 14. Moncada S, Palmer RM, Higgs EA. Nitric oxide: physiology, pathophysiology, and pharmacology. Pharmacol Rev . 1991; 43: 109–42. [PubMed] [Google Scholar]
- 15. Calabrese V, Signorile A, Cornelius C, et al . Practical approaches to investigate redox regulation of heat shock protein expression and intracellular glutathione redox state. Methods Enzymol . 2008; 441: 83–110. [DOI] [PubMed] [Google Scholar]
- 16. Hess DT, Matsumoto A, Kim SO, et al . Protein S‐nitrosylation: purview and parameters. Nat Rev Mol Cell Biol . 2005; 6: 150–66. [DOI] [PubMed] [Google Scholar]
- 17. Stamler JS. Redox signaling: nitrosylation and related target interactions of nitric oxide. Cell . 1994; 78: 931–6. [DOI] [PubMed] [Google Scholar]
- 18. Richardson G, Benjamin N. Potential therapeutic uses for S‐nitrosothiols. Clin Sci . 2002; 102: 99–105. [PubMed] [Google Scholar]
- 19. Arnelle DR, Stamler JS. NO+, NO, and NO‐ donation by S‐nitrosothiols: implications for regulation of physiological functions by S‐nitrosylation and acceleration of disulfide formation. Arch Biochem Biophys . 1995; 318: 279–85. [DOI] [PubMed] [Google Scholar]
- 20. Stamler JS, Loscalzo J. Capillary zone electrophoretic detection of biological thiols and their S‐nitrosated derivatives. Anal Chem . 1992; 64: 779–85. [DOI] [PubMed] [Google Scholar]
- 21. Stamler JS, Osborne JA, Jaraki O, et al . Adverse vascular effects of homocysteine are modulated by endothelium‐derived relaxing factor and related oxides of nitrogen. J Clin Invest . 1993; 91: 308–18. [DOI] [PMC free article] [PubMed] [Google Scholar]
- 22. Zhang YY, Xu AM, Nomens M, et al . Nitrosation of tryptophan residue(s) in serum albumin and model dipeptides. J Biol Chem . 1996; 24: 14271–9. [PubMed] [Google Scholar]
- 23. Turcanu V, Dhouib M, Poindron P. Determination of heme oxygenase activity in murine macrophages for studying oxidative stress inhibitors. Anal Biochem . 1998; 263: 251–3. [DOI] [PubMed] [Google Scholar]
- 24. Ellman GL. Tissue sulfhydryl groups. Arch Biochem Biophys . 1959; 82: 70–7. [DOI] [PubMed] [Google Scholar]
- 25. Stamler JS, Toone EJ. The decomposition of thionitrites. Curr Opin Chem Biol . 2002; 6: 779–85. [DOI] [PubMed] [Google Scholar]
- 26. Bonnett R, Holleyhead RJ. Reaction of tryptophan derivatives with nitrite. Chem Soc . 1974; 1: 962–4. [Google Scholar]
- 27. Corradi M, Montuschi P, Donnelly LE, et al . Increased nitrosothiols in exhaled breath condensate in inflammatory airway diseases. Am J Respir Crit Care Med . 2001; 163: 854–8. [DOI] [PubMed] [Google Scholar]
- 28. Marzinzig M, Nussler AK, Stadler J, et al . Improved methods to measure end products of nitric oxide in biological fluids: nitrite, nitrate, and S‐nitrosothiols. Nitric Oxide . 1997; 1: 177–89. [DOI] [PubMed] [Google Scholar]
- 29. Gaston B, Reilly J, Drazen JM, et al . Endogenous nitrogen oxides and bronchodilator S‐nitrosothiols in human airways. Proc Natl Acad Sci USA . 1993; 90: 10957–61. [DOI] [PMC free article] [PubMed] [Google Scholar]
- 30. Kluge I, Gutteck‐Amsler U, et al . S‐nitrosoglutathione in rat cerebellum: identification and quantification by liquid chromatography‐mass spectrometry. J Neurochem . 1997; 69: 2599–607. [DOI] [PubMed] [Google Scholar]
- 31. Foresti R, Hoque M, Bains S, et al . Haem and nitric oxide: synergism in the modulation of the endothelial haem oxygenase‐1 pathway. Biochem J . 2003; 372: 381–90. [DOI] [PMC free article] [PubMed] [Google Scholar]
- 32. Palozza P, Serini S, Currò D, et al . beta‐Carotene and cigarette smoke condensate regulate heme oxygenase‐1 and its repressor factor Bach1: relationship with cell growth. Antioxid Redox Signal . 2006; 8: 1069–80. [DOI] [PubMed] [Google Scholar]
- 33. Stamler JS, Jaraki O, Osborne J, et al . Nitric oxide circulates in mammalian plasma primarily as an S‐nitroso adduct of serum albumin. Proc Natl Acad Sci USA . 1992; 89: 7674–7. [DOI] [PMC free article] [PubMed] [Google Scholar]
- 34. Tyurin VA, Liu SX, Tyurina YY, et al . Elevated levels of S‐nitrosoalbumin in preeclampsia plasma. Circ Res . 2001; 88: 1210–5. [DOI] [PubMed] [Google Scholar]
- 35. Nakama T, Furusawa T, Itoh H, et al . Correlation of cholesterol and bilirubin solubilization in bile salt solution. Gastroenterol Jpn . 1979; 14: 565–72. [DOI] [PubMed] [Google Scholar]
- 36. Ostrow JD. The etiology of pigment gallstones. Hepatology . 1984; 4: 215S–22S. [DOI] [PubMed] [Google Scholar]
- 37. Trotman BW. Pigment gallstone disease. Gastroenterol Clin North Am . 1991; 20: 111–26. [PubMed] [Google Scholar]
- 38. Zucker SD, Goessling W. Mechanism of hepatocellular uptake of albumin‐bound bilirubin. Biochim Biophys Acta . 2000; 1463: 197–08. [DOI] [PubMed] [Google Scholar]
- 39. Mancuso C. Heme oxygenase and its products in the nervous system. Antioxid Redox Signal . 2004; 6: 878–87. [DOI] [PubMed] [Google Scholar]
- 40. Calabrese V, Sultana R, Scapagnini G, et al . Nitrosative stress, cellular stress response, and thiol homeostasis in patients with Alzheimer’s disease. Antioxid Redox Signal . 2006; 8: 1975–86. [DOI] [PubMed] [Google Scholar]
- 41. Mancuso C, Capone C, Ranieri SC, et al . Bilirubin as an endogenous modulator of neurotrophin redox signaling. J Neurosci Res . 2008; 86: 2235–49. [DOI] [PubMed] [Google Scholar]
- 42. Maines MD. The Heme oxygenase system: a regulator of second messenger gases. Annu Rev Pharmacol Toxicol . 1997; 37: 517–54. [DOI] [PubMed] [Google Scholar]
- 43. Podolski DK, Isselbacher KJ. Harrison’s principles of internal medicine. 12th ed. New York : McGrow‐Hill; 1991. pp. 1340–50. [Google Scholar]
- 44. Isselbacher KJ. Harrison’s principles of internal medicine. 12th ed. New York : McGrow‐Hill; 1991. pp. 1317–22. [Google Scholar]