Figure 1.
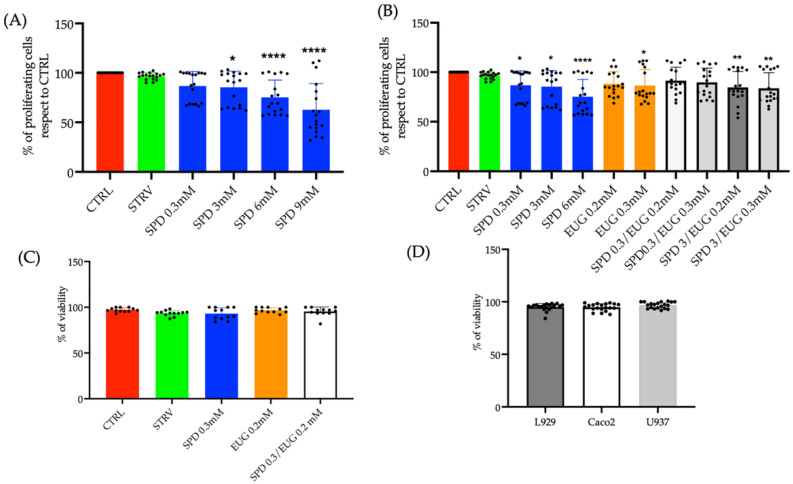
(A) Effect of varying spermidine (SPD) concentrations on cellular proliferation in Caco-2, L929 and U939 lines after 24 h, reported as an average response on all three cell lines using the MTT assay. (B) Effect of eugenol (EUG) concentration in combination with SPD on Caco-2, L929 and U937 lines after 24 h, reported as an average response using the MTT assay. Comparison was made to the untreated control and starvation-induced cells (STARV). (C) The effect on cell viability using the blue trypan exclusion assay after a 24 h exposure to 0.3 mM SPD and 0.2 mM EUG alone and in combination (0.3 mM SPD + 0.2 mM EUG) on Caco-2, L929 and U939 lines expressed as an average response or (D) as a response of the individual cell lines. The designation of the number of stars *, ** and **** represents significant differences between treatments as determined by one-way ANOVA at the 99% confidence level (p < 0.01). The black dots indicate the positioning of the individual replicates within the bar for each sample.

