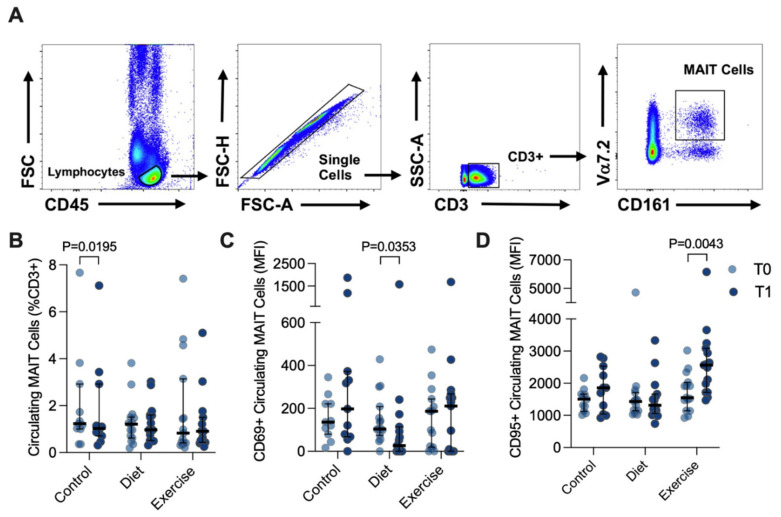
Figure 3.
Circulating MAIT cells before (T0) and after (T1) diet or exercise intervention. (A) Representative flow cytometry dot plots showing gating strategy for defining circulating CD3+ Vα7.2hi CD161hi MAIT cells. (B) Circulating MAIT cells in control participants (n = 11, as 3 participant samples were lost during processing), and participants completing either 12 weeks of dietary (n = 15) or exercise (n = 15) intervention. (C) CD69+ and (D) CD95+ circulating MAIT cells before and after intervention. Data were analysed via Wilcoxon matched pairs signed-rank test, and individual values and median ± interquartile range are depicted. MFI: median fluorescence intensity. MAIT: Mucosal-associated invariant T.

