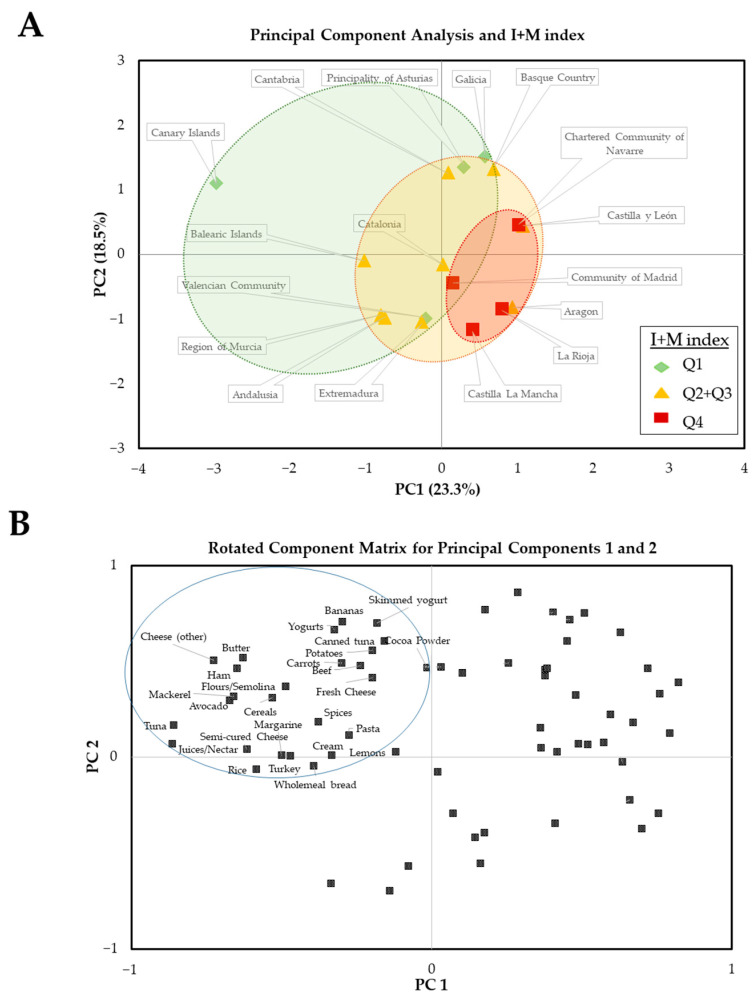
Figure 3.
Principal Component Analysis derived matrices. (A) Matrix of Principal Components 1 and 2 (% of explained variability) of foods considered a source of essential micronutrients for the immune system in the Spanish regions and, classified according to the tercile of I + M index: quartile 1 (Q1, low I + M, in green), quartiles 2 + 3 (Q2 + Q3, intermediate I + M, in yellow) and quartile 4 (Q4, high I + M, in red). (B) Rotated Component Matrix for Principal Components 1 and 2. The points representing food items that contribute to negative PC1 and positive PC2 (parameters associated with the lower impact of COVID-19) are labeled and circled.

