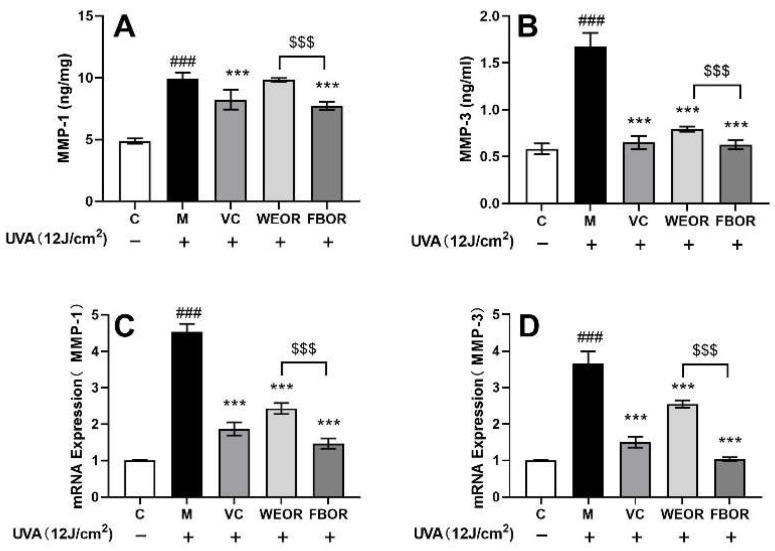
Figure 6.
Effects of WEOR and FBOR on the activity and expression of MMPs in fibroblasts: (A) MMP-1 protein content; (B) MMP-3 protein content; (C) MMP-1 mRNA expression level; (D) MMP-3 mRNA expression level. (*** p < 0.001, versus the UVB irradiation model group; ### p < 0.001, versus the control group. $$$ p < 0.001, the WEOR group versus the FBOR group. C: Control group; M: UVB irradiation model group).

