Abstract
Coaggregating strains of aquatic bacteria were identified by partial 16S rRNA gene sequencing. The coaggregation abilities of four strains of Blastomonas natatoria and one strain of Micrococcus luteus varied with culture age but were always maximum in the stationary phase of growth. Each member of a coaggregating pair carried either a heat- and protease-sensitive protein (lectin) adhesin or a saccharide receptor, as coaggregation was reversed by sugars.
Coaggregation is the cell-to-cell recognition of genetically distinct partner cell types (13) and was first demonstrated for bacteria from dental plaque (6). Coaggregation between oral bacteria is mediated by lectin-saccharide interactions between cell surface molecules on the partner organisms (1, 5, 8, 10). Coaggregation also occurs between members of the urogenital flora (16) and between strains of Lactobacillus from chicken crops (19). Most recently, coaggregation between aquatic biofilm-forming bacteria was described and found to be reversed by simple sugars (2), although involvement of surface proteins was not investigated. In addition, most of the aquatic strains were unidentified, and the coaggregation scores for some pairs of aquatic bacteria showed variation between different batch cultures. This study describes the identification of five aquatic coaggregating bacteria by using 16S rRNA gene sequencing and investigates the role of surface proteins in the coaggregation process. In addition, the relationship between coaggregation ability and phase of growth in batch culture is presented.
Five coaggregating bacteria isolated from biofilm samples and previously designated as strains 2.1, 2.3, 2.6, 2.8, and 2.13 (2) were grown on R2A agar at 25°C (Difco) (15). Batch cultures were grown in 100 ml of liquid R2A broth, with shaking at 200 rpm at 25°C. All five strains were characterized by a combination of biochemical tests and light microscopy and by sequencing approximately 650 bases of the 16S rRNA gene. Bacterial genomic DNA from each strain was obtained by boiling a single bacterial colony, and the primers used for amplification and sequencing of 16S rRNA gene fragments were 8FPL (20) and 806R (22). The nucleotide sequence of each PCR product was compared to known sequences in the EMBL database, and the organism with the closest sequence similarity was identified.
All five strains could be identified to the species level, as all had greater than 98.5% similarity with the closest sequence in the database. Four strains were identified as Blastomonas natatoria (strains 2.1, 2.3, 2.6, and 2.8) and one strain was identified as Micrococcus luteus (strain 2.13). B. natatoria strains were gram-negative, obligately aerobic, oxidase- and catalase-positive rods giving highly pigmented yellow colonies on R2A agar. All four strains divided asymmetrically to give daughter cells with a single polar flagellum. Comparison of the partial 16S rRNA gene sequence of each of the B. natatoria strains showed that they had 97.9 to 99.7% identity, indicating that they were very closely related members of the same species. M. luteus 2.13 was a large nonmotile tetrad-forming, oxidase- and catalase-positive coccus. This confirms the previous identification of the strain as M. luteus by the API identification system (2). B. natatoria strains have been previously isolated from aquatic environments (17, 18) and biofilms (7). However, M. luteus is a ubiquitous organism commonly isolated from human skin (9), although it has been isolated from biofilms developed from tap water (P. S. Handley and C. J. Kerr, unpublished data).
In order to assess the coaggregating ability of the strains, a visual coaggregation assay, modified from the work of Cisar et al. (3), was used. Briefly, cells were grown separately in batch culture, harvested simultaneously, and washed three times in filter-sterilized deionized water. Cells of each strain were then suspended in deionized water to an optical density at 650 nm of 1.5 and mixed in equal volumes (200 μl) in 6- by 50-mm silica Durham tubes (Scientific Laboratory Supplies, Nottingham, United Kingdom). The mixture was then vortexed for 10 s and rolled gently for 30 s, and the degree of coaggregation was assessed visually in a semiquantitative assay with the scoring scheme originally described by Cisar et al. (3). If specific cell-to-cell recognition occurs, the cells flocculate (coaggregate) together and settle out. The scoring criteria were as follows: 0, no flocs in suspension; 1, very small uniform flocs in a turbid suspension; 2, easily visible small flocs in a turbid suspension; 3, clearly visible flocs which settle, leaving a clear supernatant; 4, very large flocs of coaggregates that settle almost instantaneously, leaving a clear supernatant. Control tubes of each isolate on their own were also included to assess autoaggregation. Where present, autoaggregation was scored by using the same criteria, and the score was deducted from the coaggregation score.
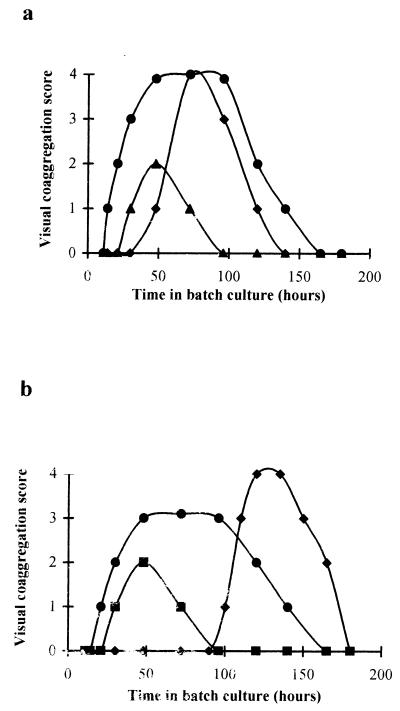
Of the 10 possible pairwise combinations of strains, 6 pairs coaggregated with a maximum score ranging from 2 to 4; however, the expression of coaggregation was related to the time at which cells were harvested from batch culture (Fig. 1). For all six coaggregating pairs, a cycle of appearance and disappearance of coaggregation ability was observed. Early in batch culture, none of the pairs could coaggregate, but as the cultures aged, coaggregation scores increased to a pair-dependent maximum value. Maximum coaggregation ability was maintained for up to 50 h depending upon the partnership and then declined to zero as the cultures aged further. The experiment was repeated three times, with separate batch cultures, and the coaggregation scores were always identical at every sample time. Small differences in harvesting times could therefore explain the variations in coaggregation scores between different batch cultures observed by Buswell et al. (2).
FIG. 1.
The influence of culture age on the visual coaggregation scores for the six coaggregating pairs. (a) B. natatoria 2.1-B. natatoria 2.6 (⧫), B. natatoria 2.3-M. luteus 2.13 (▴), and B. natatoria 2.1-M. luteus 2.13 (●). (b) B. natatoria 2.1-B. natatoria 2.3 (●), B. natatoria 2.1-B. natatoria 2.8 (⧫), and B. natatoria 2.8-M. luteus 2.13 (■). Each point represents the mean coaggregation value from three separate experiments. Scores were always exactly reproducible.
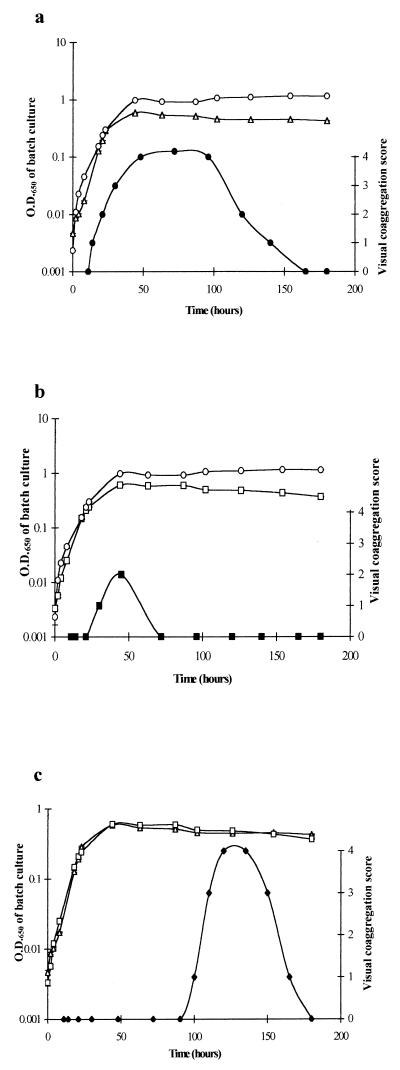
The phase of growth of each organism growing in R2A broth was linked to the time of maximum expression of the coaggregation phenotype for all six coaggregating pairs. Three patterns of gain and loss of coaggregation ability during batch culture growth were detected (Fig. 2). The first pattern is illustrated by the pair of B. natatoria 2.1 and M. luteus 2.13, which developed the ability to coaggregate during exponential phase (Fig. 2a), reaching a maximum score of 4 in stationary phase. The second pattern is represented by the pair of M. luteus 2.13 and B. natatoria 2.8, which coaggregated optimally upon entry into stationary phase, reaching a score of 2 (Fig. 2b). The third pattern of coaggregation is illustrated for the pair of B. natatoria 2.1 and B. natatoria 2.8, which coaggregated only in later (144 h growth) stationary phase (Fig. 2c). All pairs eventually lost the ability to coaggregate. This is the first observation of growth phase dependency of coaggregation in aquatic bacteria. However, expression of a coaggregation adhesin on Streptococcus gordonii DL1 from dental plaque has been linked with growth phase in batch culture (14), although coaggregation between oral bacteria has not been shown to be completely lost at any stage of batch culture growth.
FIG. 2.
The relationship between growth phase and visual coaggregation score for three pairs of strains. (a) Optical density of B. natatoria 2.1 (▵) and M. luteus 2.13 (○) in relation to the visual coaggregation score between B. natatoria 2.1 and M. luteus 2.13 (●). (b) Optical density of B. natatoria 2.8 (□) and M. luteus 2.13 (○) in relation to the visual coaggregation score between B. natatoria 2.8 and M. luteus 2.13 (■). (c) Optical density of B. natatoria 2.1 (▵) with B. natatoria 2.8 (□) in relation to the visual coaggregation score of B. natatoria 2.1 and B. natatoria 2.8 (⧫).
Finally, the surface-associated molecules involved in coaggregation were investigated by heat and protease treatment and by sugar reversal tests. Inhibition of coaggregation by heat pretreatment of each member of a coaggregating pair was carried out by the method of Kolenbrander et al. (11). Members of coaggregating pairs were pretreated individually with protease type XIV from Streptomyces griseus (Sigma) by the method of Cookson et al. (4). Heat or protease treatment of one member of a maximally coaggregating pair totally inhibited coaggregation, but treatment of the other member of the same pair had no effect on coaggregation (Tables 1 and 2). Therefore, heat- and protease-sensitive protein adhesins (lectins) mediated all coaggregation partnerships. The ability of sugars to reverse coaggregation was determined by the addition of lactose, galactose, N-acetyl-d-galactosamine, methyl-α-d-galactopyranoside, and galactosamine (all obtained from Sigma) to coaggregating pairs at a final concentration of 50 mM. For all six coaggregating pairs, at least one sugar reversed coaggregation (Fig. 3). Therefore, coaggregation among these five aquatic bacteria is mediated by lectin-saccharide interactions, which also mediate many interactions between oral bacteria (3, 5, 21).
TABLE 1.
The effect of heat pretreatment on coaggregation scores when each partner was heated separately and then mixed with a heated or unheated partnera
| Strain | Partner | Score for strain with partner
|
|||||
|---|---|---|---|---|---|---|---|
| 2.1
|
2.3
|
2.8
|
|||||
| UT | T | UT | T | UT | T | ||
| 2.13 | UT | 4 | 0 | 2 | 0 | 2 | 0 |
| T | 4 | 0 | 2 | 0 | 2 | 0 | |
| 2.8 | UT | 4 | 4 | ||||
| T | 1 | 1 | |||||
| 2.6 | UT | 4 | 1 | ||||
| T | 4 | 1 | |||||
| 2.3 | UT | 3 | 1 | ||||
| T | 3 | 1 | |||||
Boldface numbers indicate untreated control scores. UT, untreated partner; T, treated partner.
TABLE 2.
The effect of protease treatment on coaggregation scores of the six coaggregating pairs when each partner is pretreated separately with protease and then mixed with either a treated or an untreated partnera
| Strain | Partner | Score for strain with partner
|
|||||
|---|---|---|---|---|---|---|---|
| 2.1
|
2.3
|
2.8
|
|||||
| UT | T | UT | T | UT | T | ||
| 2.13 | UT | 4 | 1 | 2 | 0 | 2 | 0 |
| T | 4 | 1 | 2 | 0 | 2 | 0 | |
| 2.8 | UT | 4 | 4 | ||||
| T | 1 | 1 | |||||
| 2.6 | UT | 4 | 1 | ||||
| T | 4 | 1 | |||||
| 2.3 | UT | 3 | 0 | ||||
| T | 3 | 0 | |||||
Boldface numbers indicate untreated control scores. UT, untreated partner; T, treated partner.
FIG. 3.
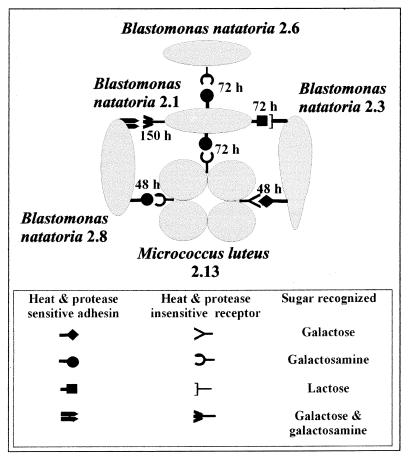
Diagrammatic representation of specific intergeneric and interstrain (intraspecies) coaggregation between aquatic bacteria. Cells are not drawn to scale. M. luteus 2.13 grows as tetrads, and B. natatoria 2.3 is a club-shaped rod. B. natatoria 2.1, 2.6, and 2.8 are symmetrical small rods. Each interaction is shown as complementary symbols representing a protein adhesin (lectin) or a sugar (saccharide) receptor. Numbers represent the length of time (hours) of growth in batch culture for optimal coaggregation to occur for each pair.
A diagrammatic model is presented to indicate the specificity of the lectin-saccharide-mediated coaggregation between M. luteus 2.13 and the four B. natatoria strains (Fig. 3) and to show the time at which coaggregation is maximally expressed for each pair. Thus, aquatic strains may carry multiple adhesins or receptors or a combination of both, which is also a common feature of coaggregating oral bacteria (13). These aquatic strains exhibited intergeneric coaggregation between M. luteus 2.13 and the B. natatoria strains, and interstrain (intraspecies) coaggregation between the B. natatoria strains (Fig. 3). Intergeneric coaggregation is extremely common between different genera of plaque bacteria (12), but interstrain coaggregation between such closely related strains has not been reported so far for plaque bacteria. While the four Blastomonas strains are all from the same species, the partial 16S rRNA gene sequencing showed that they differed in sequence identity. Therefore, the strains are genetically distinct, and the definition of coaggregation as “occurring between genetically distinct partner cell types” (13) is still valid.
Nucleotide sequence accession numbers.
The sequences were deposited into the EMBL sequence database, and the accession numbers are AJ250438 for M. luteus 2.13 and AJ250434, AJ250435, AJ250436, and AJ250437 for B. natatoria 2.1, 2.3, 2.6, and 2.8, respectively.
Acknowledgments
This work was supported by the BBSRC in collaboration with the Centre for Applied Microbiology and Research (CAMR), Salisbury, Wiltshire, United Kingdom.
REFERENCES
- 1.Bourgeau G, McBride B C. Dextran-mediated inter-bacterial aggregation between dextran-synthesizing streptococci and Actinomyces viscosus. Infect Immun. 1976;13:1228–1234. doi: 10.1128/iai.13.4.1228-1234.1976. [DOI] [PMC free article] [PubMed] [Google Scholar]
- 2.Buswell C M, Herlihy Y M, Marsh P D, Keevil C W, Leach S A. Coaggregation amongst aquatic biofilm bacteria. J Appl Microbiol. 1997;83:477–484. [Google Scholar]
- 3.Cisar J O, Kolenbrander P E, McIntire F C. Specificity of coaggregation reactions between human oral streptococci and strains of Actinomyces viscosus or Actinomyces naeslundii. Infect Immun. 1979;24:742–752. doi: 10.1128/iai.24.3.742-752.1979. [DOI] [PMC free article] [PubMed] [Google Scholar]
- 4.Cookson A L, Handley P S, Jacob A E, Watson G K, Allison C. Coaggregation between Prevotella nigrescens and Prevotella intermedia with Actinomyces naeslundii strains. FEMS Microbiol Lett. 1995;132:291–296. [Google Scholar]
- 5.Ebisu S, Nakae H, Okada H. Coaggregation of Eikenella corrodens with oral bacteria mediated by bacterial lectin-like substances. Adv Dent Res. 1988;2:323–327. doi: 10.1177/08959374880020022101. [DOI] [PubMed] [Google Scholar]
- 6.Gibbons R J, Nygaard M. Inter-bacterial aggregation of plaque bacteria. Arch Oral Biol. 1970;15:1397–1400. doi: 10.1016/0003-9969(70)90031-2. [DOI] [PubMed] [Google Scholar]
- 7.Hugenholtz P, Fuerst J A. Heterotrophic bacteria in an air-handling system. Appl Environ Microbiol. 1992;58:3914–3920. doi: 10.1128/aem.58.12.3914-3920.1992. [DOI] [PMC free article] [PubMed] [Google Scholar]
- 8.Kagermeier A, London J. Identification and preliminary characterization of a lectinlike protein from Capnocytophaga gingivalis (emended) Infect Immun. 1986;51:490–494. doi: 10.1128/iai.51.2.490-494.1986. [DOI] [PMC free article] [PubMed] [Google Scholar]
- 9.Kloos W E, Musselwhite M S. Distribution and persistence of Staphylococcus and Micrococcus species and other aerobic bacteria on human skin. Appl Microbiol. 1975;30:381–385. doi: 10.1128/am.30.3.381-395.1975. [DOI] [PMC free article] [PubMed] [Google Scholar]
- 10.Kolenbrander P E. Oral microbiology and coaggregation. In: Shapiro J A, Dworkin M, editors. Bacteria as multicellular organisms. Oxford, United Kingdom: Oxford University Press; 1997. pp. 245–269. [Google Scholar]
- 11.Kolenbrander P E, Andersen R N, Holdeman L V. Coaggregation of oral Bacteroides species with other bacteria: central role in coaggregation bridges and competitions. Infect Immun. 1985;48:741–746. doi: 10.1128/iai.48.3.741-746.1985. [DOI] [PMC free article] [PubMed] [Google Scholar]
- 12.Kolenbrander P E, Andersen R N, Moore L V H. Intrageneric coaggregation among strains of human oral bacteria: potential role in primary colonization of the tooth surface. Appl Environ Microbiol. 1990;56:3890–3894. doi: 10.1128/aem.56.12.3890-3894.1990. [DOI] [PMC free article] [PubMed] [Google Scholar]
- 13.Kolenbrander P E, London J. Adhere today, here tomorrow: oral bacterial adherence. J Appl Bacteriol. 1993;175:3247–3252. doi: 10.1128/jb.175.11.3247-3252.1993. [DOI] [PMC free article] [PubMed] [Google Scholar]
- 14.McNab R, Jenkinson H F. Altered adherence properties of a Streptococcus gordonii hppA (oligopeptide permease) mutant result from transcriptional effects on cshA adhesin gene expression. Microbiology. 1998;144:127–136. doi: 10.1099/00221287-144-1-127. [DOI] [PubMed] [Google Scholar]
- 15.Reasoner D J, Geldrich E E. A new medium for the enumeration and subculture of bacteria from potable water. Appl Environ Microbiol. 1985;49:1–7. doi: 10.1128/aem.49.1.1-7.1985. [DOI] [PMC free article] [PubMed] [Google Scholar]
- 16.Reid G, McGroarty J A, Angotti R, Cook R L. Lactobacillus inhibitor production against Escherichia coli and coaggregation ability with uropathogens. Can J Microbiol. 1988;34:344–351. doi: 10.1139/m88-063. [DOI] [PubMed] [Google Scholar]
- 17.Sly L I, Hargreaves M H. Two unusual budding bacteria isolated from a swimming pool. J Appl Bacteriol. 1984;56:476–486. doi: 10.1111/j.1365-2672.1984.tb01376.x. [DOI] [PubMed] [Google Scholar]
- 18.Sly L I, Cahill M M. Transfer of Blastobacter natatorius (Sly 1985) to the genus Blastomonas gen. nov. as Blastomonas natatoria comb. nov. Int J Syst Bacteriol. 1997;47:566–568. doi: 10.1099/00207713-47-2-566. [DOI] [PubMed] [Google Scholar]
- 19.Vandevoorde L, Christiaens H, Verstraete W. Prevalence of coaggregation reactions among chicken lactobacilli. J Appl Bacteriol. 1992;72:214–219. doi: 10.1111/j.1365-2672.1992.tb01826.x. [DOI] [PubMed] [Google Scholar]
- 20.Weisberg W G, Barns S M, Pelletier D A, Lane D J. 16S ribosomal DNA amplification for phylogenetic study. J Bacteriol. 1991;173:697–703. doi: 10.1128/jb.173.2.697-703.1991. [DOI] [PMC free article] [PubMed] [Google Scholar]
- 21.Weiss E I, London J, Kolenbrander P E, Kagermeier A S, Andersen R N. Characterization of lectinlike surface components on Capnocytophaga ochracea ATCC 33596 that mediate coaggregation with gram-positive oral bacteria. Infect Immun. 1987;55:1198–1202. doi: 10.1128/iai.55.5.1198-1202.1987. [DOI] [PMC free article] [PubMed] [Google Scholar]
- 22.Wilson K E, Blitchington R B, Greene R C. Amplification of bacterial 16S ribosomal DNA with polymerase chain reaction. J Clin Microbiol. 1990;28:1942–1946. doi: 10.1128/jcm.28.9.1942-1946.1990. [DOI] [PMC free article] [PubMed] [Google Scholar]


