

Abstract
This study aims to determine the effects of D-methionine (D-Met) isomer and the methionine precursor 2-hydroxy-4-methylthiobutanoic acid i (HMBi) supplementation on milk protein synthesis on immortalized bovine mammary epithelial cell (MAC-T). MAC-T cells were seeded using 10-cm dishes and cultured in Dulbecco’s modified Eagle’s medium/F12 (DMEM/F12) basic medium. The basic medium of DMEM/F12 was replaced with the lactogenic DMEM/F12 differentiation medium when 90% of MAC-T cells reached confluency. The best dosage at 0.6 mM of D-Met and HMBi and incubation time at 72 h were used uniformly for all treatments. Each treatment was replicated six times wherein treatments were randomly assigned in a 6-well plate. Cell, medium, and total protein were determined using a bicinchoninic acid protein assay kit. Genes, proteomics and metabolomics analyses were also done to determine the mechanism of the milk protein synthesis pathway. Data were analyzed by two-way analysis of variance (ANOVA) with supplement type and plate as fixed effects. The least significant difference test was used to evaluate the differences among treatments. The HMBi treatment group had the highest beta-casein and S6 kinase beta-1 (S6K1) mRNA gene expression levels. HMBi and D-Met treatments have higher gene expressions compared to the control group. In terms of medium protein content, HMBi had a higher medium protein quantity than the control although not significantly different from the D-Met group. HMBi supplementation stimulated the production of eukaryotic translation initiation factor 3 subunit protein essential for protein translation initiation resulting in higher medium protein synthesis in the HMBi group than in the control group. The protein pathway analysis results showed that the D-Met group stimulated fructose–galactose metabolism, glycolysis pathway, phosphoinositide 3 kinase, and pyruvate metabolism. The HMBi group stimulated the pentose phosphate and glycolysis pathways. Metabolite analysis revealed that the D-Met treatment group increased seven metabolites and decreased uridine monophosphate (UMP) production. HMBi supplementation increased the production of three metabolites and decreased UMP and N-acetyl-L-glutamate production. Taken together, D-Met and HMBi supplementation are effective in stimulating milk protein synthesis in MAC-T cells by genes, proteins, and metabolites stimulation linked to milk protein synthesis.
Keywords: D-Methionine (D-met), 2-Hydroxy-4-methylthiobutanoic acid i (HMBi), Immortalized bovine mammary epithelial cell line (MAC-T), Methionine, Milk protein, Proteomics
INTRODUCTION
In many feed systems, methionine (Met) is known as a limiting amino acid (AA) for milk protein synthesis in dairy cows [1-3]. Met plays a critical role in protein synthesis and is active in many other biochemical and cellular processes [2,3]. The primary role of Met is to initiate mRNA translation by binding methionyl-tRNA into the 40S ribosome, then joining with the 60S ribosome to form the 80S ribosome [4]. Met supplementation has been reported to increase protein expression, mammalian target of rapamycin (mTOR) phosphorylation, and beta-casein expression [5]. Supplementation with Met in bovine mammary epithelial cells causes the increase of mTOR pathway activation and phosphorylation of glycogen synthase kinase 3 which acts as an inhibitor of mTOR [6]. Met supplementation in bovine mammary epithelial resulted in positive effects on milk protein synthesis because of phosphorylation of proteins related to the mTOR pathway [7]. Met infusion into bovine mammary tissue has also been reported to increase S6 kinase beta-1 (S6K1) and ribosomal protein (RP)S6 phosphorylation [8]. Several past studies have shown that nutrient–gene interaction allows Met to directly regulate the expression of genes linked to milk protein synthesis [9,10].
D-Met is one form of Met that can be made synthetically and used as a supplement in the diets of dairy cows. The roles of enzymes are particular to the specific isomer. D-Met is converted into L-form via a two-step process, mainly in the liver, kidney, and other tissues [11-13]. Amino acid (AA) oxidase removes the amine group via an oxidation reaction to form the intermediate 2-keto-4-methylthiobutanoic, followed by attachment of transaminase to the amine group forming the L-Met [11-13].
The Met hydroxy analog 2-hydroxy-4-methylthiobutanoic acid (HMBi), a Met pre-cursor, has long been proposed to provide Met and thus increase the milk protein contents in dairy cows fed with Met-limited ration [14]. The chemical structure of HMBi is mainly similar to that of Met. The main difference in their structures is that instead of an amine group, HMBi has a hydroxyl group (OH). The analog also exists in both D- and L- isomer forms. HMBi has several beneficial effects on rumen fermentation, including enhancing cellulolytic activity, fiber degradation, and increased acetate production [15-17].
Recently, different omics studies detected distinct clusters of differentially concentrated metabolites following treatment with various ratios of Met, Lysine, Phenylalanine, Valine, and Tryptophan [18-20]. However, to our knowledge, no studies have applied proteomic and metabolomic approaches to analyze the effects of supplementation with D-Met and its precursor HMBi on the beta-casein synthesis and milk protein synthesis-related pathways. The present study aims to determine the effect of adding D-Met and the Met precursor HMBi on the stimulation of milk protein synthesis in bovine mammary epithelial cells. It also investigates the related pathways that increase protein synthesis and beta-casein expression in immortalized bovine mammary epithelial cell lin (MAC-T) cells using proteomic and metabolomic data.
MATERIALS AND METHODS
Amino acid dosage and time of sampling
MAC-T cells which are immortalized mammary epithelial [21] came from McGill University, Canada, and were cultured following the procedure of Wang et al. [21,22]. The AA profile of the differentiation medium is shown in Table 1. Cell confluency can be estimated by considering the doubling time characteristics of our cells.
Table 1. Amino acid profile of lactogenic medium (mM).
| Amino acid | Lactogenic medium (mM) |
|---|---|
| Arginine | 0.7 |
| Cysteine | 0.1 |
| Glutamine | 2.5 |
| Glycine | 0.25 |
| Histidine | 0.15 |
| Isoleucine | 0.42 |
| Leucine | 0.45 |
| Lysine | 0.5 |
| Methionine | 0.12 |
| Phenylalanine | 0.22 |
| Serine | 0.25 |
| Threonine | 0.45 |
| Tryptophan | 0.04 |
| Tyrosine | 0.21 |
| Valine | 0.45 |
An initial experiment was done to determine the effects of various dosages of supplemental Met and its culture time on beta-casein mRNA expression. Additional Met (+0.3, +0.6, +0.9 mM) were supplemented to lactogenic medium without fetal bovine serum. Cells were harvested 24 hours.
Beta-casein secretion on MAC-T cells was harvested at 0, 12, 24, 36, 48, 72, 96, and 120 h after incubating with the lactogenic medium to determine the effect of the treatments on culture time. Preliminary study shows that 0.6 mM and incubation time at 72 h were the best dosage and incubation time respectively and were used uniformly for all treatments. D-Met and HMBi were obtained from Sigma-Aldrich (M9375) (Sigma-Aldrich, St. Louis, MO, USA) and Adisseo MetaSmart® (Adisseo, Antony, France), respectively. Treatments were replicated six times and randomly assigned on a 6-well plate.
RNA extraction and cDNA synthesis
Using TRIzol reagent (Life Technologies, Carlsbad, CA, USA), the total RNA from MAC-T cells were extracted. The RNA quality and quantity were determined in NanoDrop 1000 spectrophotometer using RNA-40 module (Thermo Fisher, Waltham, MA, USA). Values of > 1.8 A260/280 were acceptable. The cDNA was synthesized using the iScript cDNA synthesis kit (Bio-Rad Laboratories, Hercules, CA, USA). The sample was incubated first at 25°C for 5 min, then 42°C for 30 min, and finally at 85°C for 5 min. The cDNA quantity and quality were evaluated using the ssDNA-33 module of the Thermo NanoDrop 1000 spectrophotometer (Thermo Fisher).
Real-time polymerase chain reaction
RT-PCR was done with a total volume of 20 μL/well using 96-micro-well plates (Sigma-Aldrich). Cycling temperature was performed using the T100 Thermal Cycler System (Bio-Rad). Beta-actin served as the reference gene. The reaction mixture is shown in Table 2. RT-PCR oligonucleotide sequences of forward and reverse primers specific for the target genes that were tested and validated are shown in Table 3. RT-PCR reactions were found in Table 4. The Livak method was used to determine the relative gene expression of the target gene to the control group using the threshold cycle (2–ΔΔCT method) [23] to analyze relative gene expression changes from real-time quantitative PCR experiments. Relative quantification of expression levels of target genes in the treatment group was compared to the untreated group. A Gene expression ratio equal to 1 was used for all the control values. Therefore, a relative gene expression value greater or less than 1 correspond to a fold increase or decrease in expression relative to the control. Furthermore, to test the significance of the differences observed, least significant difference (LSD) test was performed.
Table 2. Reaction mixture in RT-PCR reaction.
| Component | Amount |
|---|---|
| cDNA | 50 ng |
| Forward primer | 0.6 μL |
| Reverse primer | 0.6 μL |
| PCR master mix | 10 μL |
| (DEPC)-treated water | 6.3 μL |
RT-PCR, real-time polymerase chain reaction; DEPC, diethyl pyrocarbonate.
Table 3. Primer pairs, accession number, annealing temperature, and product sizes of primers used in RT-PCR reaction.
| Gene | F/R | Sequence (5’ → 3’) | Accession number | Annealing temperature | Length |
|---|---|---|---|---|---|
| Beta-casein | Forward | AAATCTGCACCTTCCTCTGC | XM_015471671.2 | 59.0°C | 123 |
| Reverse | GAACAGGCAGGACTTTGGAC | ||||
| S6K1 | Forward | GGACATGGCAGGGGTGTTT | XM_027519044.1 | 55.6°C | 138 |
| Reverse | GGTATTTGCTCCTGTTACTT | ||||
| Beta-actin | Forward | GCATGGAATCCTGCGGC | NM_173979 | 58.0°C | 121 |
| Reverse | GTAGAGGTCCTTGCGGATGT |
RT-PCR, real-time polymerase chain reaction; S6K1, S6 kinase beta-1.
Table 4. PCR cycling conditions were used to analyze beta-casein expression.
| PCR cycling step | Temperature | Time | Cycle |
|---|---|---|---|
| Initial incubation | 95°C | 3 min | 1 |
| Denaturation | 95°C | 10 sec | 50 |
| Annealing | 55°C | 10 sec | 1 |
| Extension | 72°C | 30 sec | 1 |
PCR, polymerase chain reaction.
The melting curve was also considered to determine the Ct. This is to keep the cycle threshold firmly within the geometric phase. This is very important to calculate the fold changes from sample to sample and to get quantity information from a standard curve. Certain regions of the melting curve were also avoided, specifically, Ct was set not to be too low to avoid the noise during amplification. Also, too high Ct was also avoided wherein it is already linear or in the plateau phase of amplification where data are less predictable. We target the spot where all the curves are straight and parallel to one another which is the point where the precision of our replicates is the highest. It is somewhere toward the middle of the geometric phase or maybe slightly higher.
Protein extraction and quantification
After 72 h of incubation, the culture medium was collected for protein quantification by centrifuging at 300×g for 5 min at 4°C by removing the dead cell fragments. The medium was quantified using a Pierce bicinchoninic acid assay (BCA) kit (Pierce Biotechnology, Rockford, IL, USA). The cells attached at the bottom of the well were then washed with 1× phosphate-buffered saline (PBS). Then 200 μL cell lysis buffer (pH 8.3) containing 10 mM Tris/HCl, 8 M urea, 5 mM ethylenediaminetetraacetic acid (EDTA), 4% 3-[(3-cholamidopropyl) dimethylammonio]-1-propane sulfonate (CHAPS), and 1× protease inhibitor cocktail (GE Healthcare, Piscataway, NJ, USA) were added. Cell lysates were stood at 20°C for 30 min and centrifuged at 14,000×g for 30 min at 20°C [21]. The collected cells underwent cell protein quantification by BCA using the Pierce Protein Assay Kit (Pierce Biotechnology).
Proteome analysis
Lysis buffer containing 20 mM Tris, 10 mM KCl, 1.5 mM MgCl2, 0.5 mM EDTA, 0.1% sodium dodecyl sulfate (SDS), and complete EDTA-free Protease Inhibitor Cocktail (Roche, Basel, Switzerland) was used to extract cell proteins. Cell lysates were incubated at 4°C for 30 min and then centrifuged at 13,000×g for 10 min at 4°C [24]. All treatments were replicated three times.
The proteome analysis was performed according to the procedures described by Ishihama et al. [24]. The exponentially modified protein abundance index (emPAI)-based abundances compared with the actual values were within 63% on average, which is similar or better than the determination of abundance by protein staining [24]. Also, metabolite quantity determination was done as described by a previous study done by Park et al. [25].
Statistical analysis
Statistical analyses were done using SAS v. 9.1 software (SAS Institute, Cary, NC, USA). The dose responses were analyzed by computing the polynomial orthogonal contrasts (linear, quadratic, cubic) of responses to the supplementation of Met. Data were analyzed by two-way analysis of variance (ANOVA) with supplement type and plate as fixed effects. Significant differences among treatments were evaluated using LSD test. The significant difference was determined at a level of p < 0.05. The experimental model was:
Where: μ = grand mean
αi = effect of Met type and the Met precursor HMBi
βj = effect of plate
γij = interaction of treatment (D-Met/HMBi) and plate
εijk= error variability
Significant increases and decreases in protein quantity were determined by the semi-quantification relative ratio (the ratio was > 2 or > 0.5 respectively) [26,27]. The detected proteins were analyzed for pathway analysis (Bos taurus) by using a website program (http://www.pantherdb.org accessed on 26 October 2021). Differentially expressed metabolites and affected pathway detection metabolites were analyzed using Dunnett’s Multiple Comparison test by SAS software (V 9.1, SAS Institute). Pathway detection metabolites affected by the application of treatments were analyzed using the Metabo Analyst 3.0 program (University of California, Davis), a pathway detection metabolite tool for pathway analysis of cattle (Bos taurus).
RESULTS AND DISCUSSION
Amino acid dosage and sampling time
The preliminary Met dosage test showed that +0.6 mM was the optimal concentration for increasing beta-casein mRNA gene expression. Beta-casein mRNA expression increased at a Met-dose of +0.6 mM (Fig. 1). Polynomial orthogonal contrasts (linear, quadratic, cubic) analyzed the dose responses to Met supplementation (Table 5). Linear contrasts of dose responses revealed significant differences (p < 0.05).
Fig. 1. Beta-casein gene expression level in MAC-T cells supplemented with different levels of Met (0, 0.3, 0.6, 0.9 mM) for 24 h.
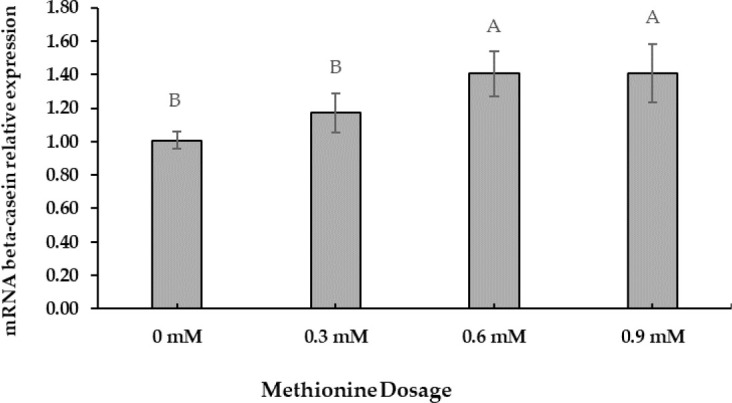
The values are expressed as means + SE (n = 6) and A, B imply significant differences at p < 0.05 by least significant difference (LSD) test. MAC-T, immortalized bovine mammary epithelial cell line; Met, methionine.
Table 5. Polynomial orthogonal contrasts of dose response to methionine supplementation.
| Contrast | DF | Contrast SS | Mean square | F-value | Pr > F |
|---|---|---|---|---|---|
| Linear | 1 | 0.619 | 0.619 | 6.20 | 0.022 |
| Quadratic | 1 | 0.039 | 0.039 | 0.39 | 0.538 |
| Cubic | 1 | 0.027 | 0.027 | 0.27 | 0.608 |
DF, degrees of freedom; SS, sum of squares.
A cell viability test was performed to evaluate D-Met isomer and HMBi supplementation; the 0.6-mM dose had no significant toxic effect than the control (Fig. 2). The result implies that +0.6 mM is the most effective level for increasing beta-casein mRNA expression identical to the previously reported result [27-29].
Fig. 2. Cell viability test for D-Met and HMBi supplementation (0.6 mM/L).
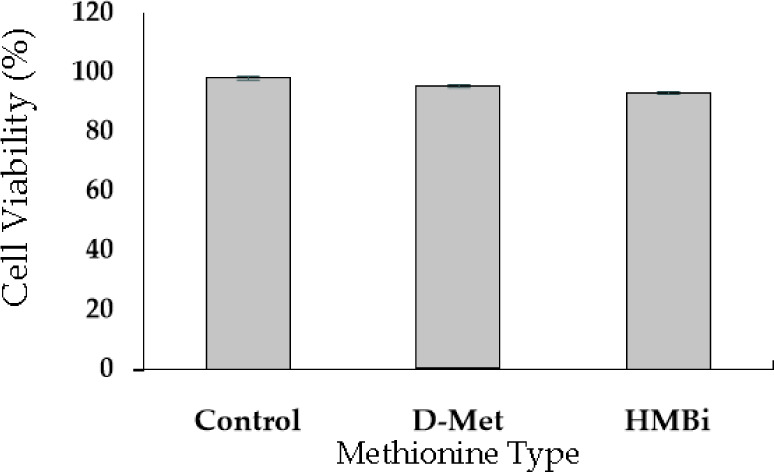
The values are expressed as means + SE (n = 6). D-Met, D-methionine; HMBi, 2-hydroxy-4-methylthiobutanoic acid i.
The optimal incubation time for increasing beta-casein mRNA expression was 72 h (Fig. 3A; p < 0.05). No significant increase in beta-casein mRNA expression was observed even after 72 h. Maximum cell protein synthesis coincides with maximum beta-casein mRNA expression (Fig. 3B; p < 0.05). This result indicates that 72 h should be used as the optimal incubation time for further tests of Met isomer and precursor efficacy since MAC-T cells were completely differentiated into beta-casein-secreting cells. Previous studies have reported that relative gene expression for beta-casein production is generally increased by supplementation with Met [28,29].
Fig. 3. (A) Beta-casein mRNA expression level; (B) cell protein quantity in MAC-T cells at different time points incubated with methionine (0, 24, 48, 72, 96, 120 h).
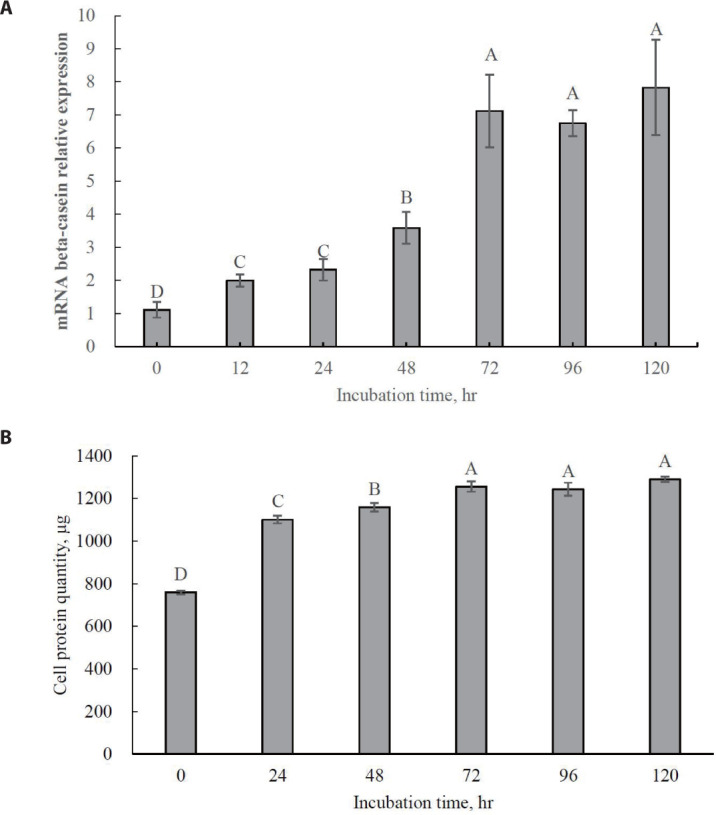
The values are expressed as means ± SE (n = 6) and A, B, C, D imply significant differences at p < 0.05 by least significant difference (LSD) test. MAC-T, immortalized bovine mammary epithelial cell line.
No significant difference in cell protein upon addition of the treatments (Fig. 4A; p > 0.05). The culture medium treated with HMBi led to significantly higher protein content than the control, yet it was not significantly different from the D-Met treatment (Fig. 4B; p > 0.05). Availability of Met is critical for regulating translation and a major limiting factor for protein synthesis in the mammary epithelial cells [30-32].
Fig. 4. (A) Cell protein quantity; (B) medium protein quantity; (C) total protein quantity (cell and medium; (D) beta-casein mRNA expression; (E) S6K1 mRNA expression in MAC-T cells supplemented with D-Methionine (D-Met; +0.6 mM), or 2-hydroxy-4-methylthiobutanoic acid I (HMBi; +0.6 mM).
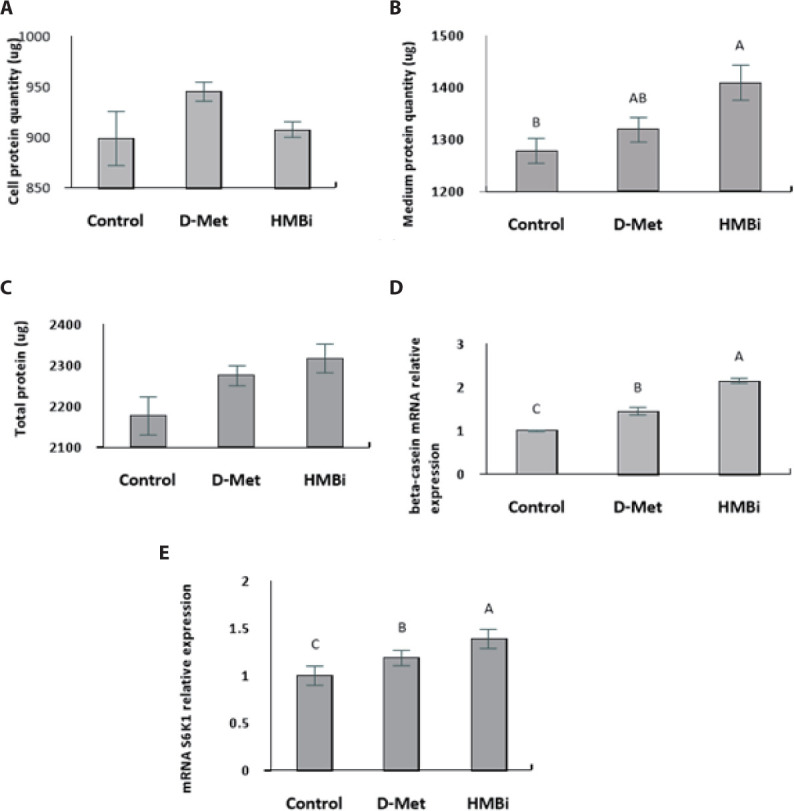
The values are means ± SE (n = 6) and A, B, C imply significant differences at p < 0.05 by Least Significant Difference (LSD) test. S6K1, S6 kinase beta-1; MAC-T, immortalized bovine mammary epithelial cell line; HMBi, 2-hydroxy-4-methylthiobutanoic acid i.
Overall, there were no significant differences in total protein (cell and medium) among the treatments (Fig. 4C; p > 0.05). Following supplementation with D -Met and the Met precursor HMBi at optimal dosage and time, HMBi has the highest beta-casein expression (Fig. 4D; p > 0.05). The addition of HMBi showed the highest gene expression for S6K1, a downstream target of mTOR pathway (Fig. 4E; p > 0.05) [2,7,8].
Proteome analysis
For the proteomics analysis, the upregulated and downregulated proteins in the D-Met group were 46 and 68, and 40 and 78 in the HMBi group (Table 6). Expression of proteins linked to protein and energy metabolism was altered after supplementations with D-Met and HMBi. The addition of HMBi upregulated the elongation protein eukaryotic translation initiation factor 3 subunit (EIF3A) but downregulated the ribosomal proteins RPS12 and RPS21. Supplementation with D-Met stimulated phosphoinositide 3 (PI3) kinase, an upstream mTOR activator [19,28,33,34]. The list of all upregulated and downregulated proteins are listed in Tables 8 and 9.
Table 6. Differentially expressed proteins upon supplementation with D-Met and HMBi in MAC-T cells compared to control.
| Detection protein | D-Met | HMBi |
|---|---|---|
| Increasing number | 46 | 40 |
| Decreasing number | 68 | 78 |
| Selected downregulated and upregulated proteins | ||
| Eukaryotic translation initiation factor 3 subunit A (EIF3A) | ▲ | |
| Ribosomal protein S21 (RPS21) | ▼ | |
| Glyceraldehyde-3-phosphate dehydrogenase (GAPDH) | ▲ | |
| Malate dehydrogenase, mitochondrial (MDH2) | ▲ | ▲ |
| Eukaryotic translation initiation factor 4A1 (EIF4A1) | ▼ | |
| Eukaryotic translation initiation factor 4A2 (EIF4A2) | ▲ | |
| ATP synthase, H+ transporting, mitochondrial F1 complex, alpha subunit 1 (ATP5A1) | ||
| Ribosomal protein S12 (RPS12) | ▼ |
▲, Upregulated (> 2-fold protein expression than in control); ▼, Downregulated (< 0.5-fold protein expression than in control).
D-Met, D-methionine; HMBi, 2-hydroxy-4-methylthiobutanoic acid I; MAC-T, immortalized bovine mammary epithelial cell line.
Table 8. List of all upregulated proteins in MAC-T cell supplemented with 0.6 mM D-Met and HMBi.
| Protein ID | Protein name | Score (Protein probability > 95%) | %emPAI (Semi quantification) | |||||
|---|---|---|---|---|---|---|---|---|
| Con | D-Met | HMBi | Con | D-Met | HMBi | |||
| 1 | IPI00700035 | HSPA1A Heat shock 70 kDa protein 1B | 175 | 191 | 254 | 0.316 | 0.440 | 0.728* |
| 2 | IPI00710719 | AHNAK AHNAK nucleoprotein isoform 1 | - | - | 61 | - | - | 0.043* |
| 3 | IPI00696012 | MYH9 myosin, heavy chain 9, non-muscle | - | 230 | 74 | - | 0.560* | 0.343* |
| 4 | IPI00716130 | UBA1 Uncharacterized protein | 105 | 161 | 143 | 0.172 | 0.240 | 0.428* |
| 5 | IPI01017790 | PDIA6 protein disulfide-isomerase A6 | 123 | 97 | 149 | 0.460 | 1.000 | 1.071 |
| 6 | IPI00889470 | LOC617875 histone H4-like | - | - | 97 | - | - | 3.556* |
| 7 | IPI00699333 | ANXA8L1 Annexin A8 | 118 | 84 | 61 | 0.632 | 0.880 | 0.457* |
| 8 | IPI00867095 | ALDOA Fructose-bisphosphate aldolase | 98 | 116 | 70 | 0.574 | 1.240* | 0.857 |
| 9 | IPI00691199 | LOC525863 Histone H4 | - | 80 | - | - | 3.280* | - |
| 10 | IPI01002058 | NME1-NME2 protein-like | - | 75 | - | - | 1.320* | - |
| 11 | IPI00699002 | ANP32B Acidic leucine-rich nuclear phosphoprotein 32 family member B | - | 107 | 36 | - | 0.520* | 0.557* |
| 12 | IPI00708046 | TUBB2B Tubulin beta-5 chain | - | 76 | 75 | - | 0.640* | 1.028* |
| 13 | IPI00717000 | LOC617264 Uncharacterized protein | - | 76 | 80 | - | 0.480* | 0.514* |
| 14 | IPI00710895 | PGK1 Phosphoglycerate kinase 1 | 86 | 94 | 43 | 0.230 | 1.080* | 0.343 |
| 15 | IPI00688257 | HNRNPU Heterogeneous nuclear ribonucleoprotein U | - | 37 | 32 | - | 0.160* | 0.171* |
| 16 | IPI00903886 | NME2 Nucleoside diphosphate kinase | 32 | - | 51 | 0.373 | - | 1.157* |
| 17 | IPI00734138 | HNRNPH1 Uncharacterized protein | - | 21 | 39 | - | 0.280* | 0.300* |
| 18 | IPI00707320 | YWHAQ 14-3-3 protein theta | - | - | 47 | - | - | 1.243* |
| 19 | IPI00715044 | KRT17 Keratin, type I cytoskeletal 17 | - | 62 | 58 | - | 0.640* | 0.686* |
| 20 | IPI00710991 | PLS3 Plastin 3 | 51 | 31 | 46 | 0.144 | 0.440* | 0.471* |
| 21 | IPI00695994 | COPS3 COP9 signalosome complex subunit 3 | - | 45 | - | - | 0.320* | - |
| 22 | IPI00697851 | KRT5 Keratin, type II cytoskeletal 5 | 33 | - | 27 | 0.172 | - | 0.514* |
| 23 | IPI00691963 | CALR Calreticulin | 56 | 25 | 39 | 0.230 | 0.320 | 0.686* |
| 24 | IPI01004191 | FLNB filamin-B | - | 38 | - | - | 0.040* | - |
| 25 | IPI00867349 | CAST protein (Fragment) | - | 19 | 20 | - | 0.160* | 0.171* |
| 26 | IPI00707656 | ANXA3 Annexin A3 | - | 19 | 28 | - | 0.400* | 0.428* |
| 27 | IPI00699280 | RPSA Similar to 40S ribosomal protein SA (Fragment) | - | 37 | - | - | 0.840* | - |
| 28 | IPI00839940 | PLCD1 1-phosphatidylinositol-4,5-bisphosphate phosphodiesterase delta-1 | - | - | 23 | - | - | 0.171* |
| 29 | IPI00698663 | S100A4 Protein S100-A4 | - | 35 | 34 | - | 1.360* | 1.457* |
| 30 | IPI00713814 | GAPDH Glyceraldehyde-3-phosphate dehydrogenase | - | - | 31 | - | - | 0.428* |
| 31 | IPI00717685 | STIP1 Stress-induced-phosphoprotein 1 | - | 43 | - | - | 0.240* | - |
| 32 | IPI00712250 | MDH2 Malate dehydrogenase, mitochondrial | - | 23 | 30 | - | 0.440* | 0.471* |
| 33 | IPI00713144 | LRRC16B leucine-rich repeat-containing protein 16B | - | 31 | - | - | 0.080* | - |
| 34 | IPI00903900 | HIST3H2BB Histone H2B | - | - | 31 | - | - | 1.114* |
| 35 | IPI00841695 | CCT4 T-complex protein 1 subunit delta | 29 | 43 | 37 | 0.172 | 0.520* | 0.557* |
| 36 | IPI01028198 | - 18 kDa protein | - | 30 | - | - | 0.880* | - |
| 37 | IPI00692963 | SEC23A Protein transport protein Sec23A | - | - | 20 | - | - | 0.171* |
| 38 | IPI00708921 | KRT18 keratin, type I cytoskeletal 18 | - | - | 30 | - | - | 0.343* |
| 39 | IPI00695841 | TMSB10 Thymosin beta-10 | - | 31 | - | - | 3.680* | - |
| 40 | IPI00696435 | YWHAE 14-3-3 protein epsilon | - | 16 | - | - | 0.520* | - |
| 41 | IPI00696263 | CAPNS1 Calpain small subunit 1 | - | 27 | - | - | 0.560* | - |
| 42 | IPI00692247 | HSPA9 Stress-70 protein, mitochondrial | 41 | 18 | 16 | 0.144 | 0.200 | 0.428* |
| 43 | IPI00709051 | AGR2 Anterior gradient homolog 2 | - | 28 | - | - | 0.760* | - |
| 44 | IPI00714624 | CCT3 T-complex protein 1 subunit gamma | - | 26 | - | - | 0.240* | - |
| 45 | IPI00715091 | RPS20 40S ribosomal protein S20 | - | - | 26 | - | - | 1.285* |
| 46 | IPI00709865 | RPSA 40S ribosomal protein SA | - | - | 24 | - | - | 0.471* |
| 47 | IPI00715705 | IVL IVL protein | - | 21 | - | - | 0.320* | - |
| 48 | IPI00867215 | LRRC47 LRRC47 protein | - | 23 | - | - | 0.240* | - |
| 49 | IPI00724124 | OLA1;LOC100335717 Obg-like ATPase 1 | - | 23 | - | - | 0.320* | - |
| 50 | IPI00710228 | MCRS1 Uncharacterized protein | - | - | 23 | - | - | 0.300* |
| 51 | IPI00688180 | FLNB Uncharacterized protein | - | - | 17 | - | - | 0.043* |
| 52 | IPI00706431 | LAD1 Ladinin 1 | - | - | 20 | - | - | 0.300* |
| 53 | IPI00703110 | YWHAZ 14-3-3 protein zeta/delta | - | 16 | - | - | 0.560* | - |
| 54 | IPI00716730 | ORC5 ORC5L protein | - | 22 | - | - | 0.280* | - |
| 55 | IPI00716013 | MYL6 Isoform Smooth muscle of Myosin light polypeptide 6 | - | 22 | - | - | 0.920* | - |
| 56 | IPI00702582 | ACOT12 Uncharacterized protein | - | 22 | - | - | 0.240* | - |
| 57 | IPI01002054 | INSR insulin receptor | - | 22 | - | - | 0.080* | - |
| 58 | IPI00695895 | Uncharacterized protein | - | - | 22 | - | - | 0.257 |
| 59 | IPI00712889 | LAMB3 Laminin, beta 3 | - | 21 | - | - | 0.120* | - |
| 60 | IPI00912185 | UGT2B11 UDP glucuronosyltransferase 2B10 isoform 1 | - | 21 | - | - | 0.240* | - |
| 61 | IPI01002579 | KCNC2 potassium voltage-gated channel, Shaw-related subfamily, member 2, partial | - | 21 | - | - | 0.320* | - |
| 62 | IPI00711396 | ATP6V0A2 V-type proton ATPase 116 kDa subunit a isoform 2 | - | - | 21 | - | - | 0.171* |
| 63 | IPI00732001 | SPTAN1 Uncharacterized protein | - | 21 | - | - | 0.040* | - |
| 64 | IPI00838304 | Uncharacterized protein | - | 20 | 19 | - | 0.280* | 0.300* |
| 65 | IPI00843042 | NAP1L4 Nucleosome assembly protein 1-like 4 | - | - | 21 | - | - | 0.386* |
| 66 | IPI00717231 | ACAA1 Uncharacterized protein | - | 19 | - | - | 0.320* | - |
| 67 | IPI01003646 | LOC100337336 Kelch-like protein 30-like | - | 19 | 17 | - | 0.360* | 0.386* |
| 68 | IPI00867250 | GAL3ST1 Galactosylceramide sulfotransferase | - | - | 16 | - | - | 0.343* |
| 69 | IPI00700826 | USP34 hypothetical protein isoform 1 | - | 14 | - | - | 0.040* | - |
| 70 | IPI00826303 | VPRBP HIV-1 Vpr binding protein, partial | - | 14 | - | - | 0.080* | - |
Upregulated proteins in MAC-T cell supplemented with 0.6 mM D-Met and HMBi related to control.
MAC-T, immortalized bovine mammary epithelial cell line; D-Met, D-methionine; HMBi, 2-hydroxy-4-methylthiobutanoic acid i.
Table 9. List of all downregulated proteins in MAC-T cell supplemented with 0.6 mM D-Met and HMBi.
| Protein ID | Protein name | Score (Protein probability > 95%) | %emPAI (Semi quantification) | |||||
|---|---|---|---|---|---|---|---|---|
| Con | D-Met | HMBi | Con | D-Met | HMBi | |||
| 1 | IPI01001130 | MYH9 myosin, heavy chain 9, non-muscle | 181 | - | - | 0.488 | -* | -* |
| 2 | IPI00699981 | LOC617745 histone cluster 1, H2bd-like | 133 | 74 | - | 0.517 | 0.720 | -* |
| 3 | IPI00697107 | TUBB2A Tubulin beta-2B chain | 102 | - | - | 0.460 | -* | -* |
| 4 | IPI01003935 | LOC781223 histone cluster 1, H4j-like | 93 | - | - | 0.833 | -* | -* |
| 5 | IPI00700324 | HNRNPUL2 Uncharacterized protein | 86 | - | - | 0.115 | -* | -* |
| 6 | IPI01000167 | AHNAK AHNAK nucleoprotein | 74 | 89 | - | 0.029 | 0.040 | -* |
| 7 | IPI00689857 | PRDX6 Peroxiredoxin-6 | 141 | 91 | 34 | 2.958 | 1.320* | 0.643* |
| 8 | IPI00883375 | MTAP;PRDX3 PRDX3 protein | 60 | - | - | 0.345 | -* | -* |
| 9 | IPI00710783 | HBA1;HBA Hemoglobin subunit alpha | 81 | - | - | 0.747 | -* | -* |
| 10 | IPI00688839 | NENF Neudesin | 61 | - | - | 0.603 | -* | -* |
| 11 | IPI00686173 | GSTP1 Glutathione S-transferase P | 83 | 38 | 39 | 1.637 | 0.640* | 1.500 |
| 12 | IPI00706942 | TPI1 Triosephosphate isomerase | 86 | 62 | - | 2.010 | -* | -* |
| 13 | IPI00711327 | CDH1 CDH1 protein | 51 | - | - | 0.115 | -* | -* |
| 14 | IPI00903886 | NME2 Nucleoside diphosphate kinase | 32 | - | 51 | 0.373 | -* | 1.157 |
| 15 | IPI00718337 | STMN1 Stathmin | 53 | - | - | 0.632 | -* | -* |
| 16 | IPI00685112 | USP5 ubiquitin specific peptidase 5 (isopeptidase T) isoform 2 | 85 | 73 | - | 0.115 | 0.160 | -* |
| 17 | IPI00694304 | CLU Clusterin | 49 | - | - | 0.201 | -* | -* |
| 18 | IPI00968674 | HMGCS1 hydroxymethylglutaryl-CoA synthase, cytoplasmic | 41 | - | - | 0.172 | - | - |
| 19 | IPI00695201 | HNRNPA2B1 Heterogeneous nuclear ribonucleoproteins A2/B1 | 41 | - | - | 0.287 | -* | -* |
| 20 | IPI00701642 | PGD 6-phosphogluconate dehydrogenase, decarboxylating | 49 | 39 | - | 0.431 | 0.280 | -* |
| 21 | IPI00712785 | COPB1 Coatomer subunit beta | 44 | - | - | 0.086 | -* | -* |
| 22 | IPI00727752 | PLCD1 1-phosphatidylinositol-4,5-bisphosphate phosphodiesterase delta-1-like | 42 | - | - | 0.115 | -* | -* |
| 23 | IPI00697851 | KRT5 Keratin, type II cytoskeletal 5 | 33 | - | 27 | 0.172 | -* | 0.514 |
| 24 | IPI00715690 | CTNNA1 Catenin alpha-1 | 32 | 30 | - | 0.230 | 0.160 | -* |
| 25 | IPI00689750 | LMNA Uncharacterized protein | 44 | - | - | 0.144 | -* | -* |
| 26 | IPI00699723 | RANBP6 Uncharacterized protein | 27 | - | 63 | 0.230 | -* | 0.343 |
| 27 | IPI00715354 | SFN 14-3-3 protein sigma | 72 | - | - | 2.556 | -* | -* |
| 28 | IPI00690789 | MVD Diphosphomevalonate decarboxylase | 37 | - | - | 0.258 | -* | -* |
| 29 | IPI00698874 | DCPS Scavenger mRNA-decapping enzyme DcpS | 37 | - | - | 0.287 | -* | -* |
| 30 | IPI00685732 | EEF1B2 Elongation factor 1-beta | 37 | - | - | 0.431 | -* | -* |
| 31 | IPI00718050 | DYNLRB1 Dynein light chain roadblock-type 1 | 37 | - | - | 1.034 | -* | -* |
| 32 | IPI00713760 | GDI2 Rab GDP dissociation inhibitor beta | 59 | 29 | - | 0.201 | 0.280 | -* |
| 33 | IPI00710020 | S100A14 Protein S100-A14 | 36 | - | - | 1.005 | -* | -* |
| 34 | IPI01003068 | LOC100337475 ribosomal protein SA-like | 23 | - | - | 0.603 | -* | -* |
| 35 | IPI00685123 | TLN1 talin-1 | 41 | 47 | - | 0.029 | 0.040 | -* |
| 36 | IPI00692093 | ANXA5 Annexin A5 | 53 | - | 36 | 0.287 | -* | 0.428 |
| 37 | IPI01001213 | TCHH trichohyalin isoform 1 | 37 | 33 | - | 0.057 | 0.080 | -* |
| 38 | IPI00709590 | KRT4 KRT4 protein | 35 | - | - | 0.172 | -* | -* |
| 39 | IPI00760419 | RPS21 40S ribosomal protein S21 | 28 | 41 | - | 1.292 | 1.800 | -* |
| 40 | IPI00845184 | KRT6A KRT6A protein | 33 | - | 38 | 0.172 | -* | 0.257 |
| 41 | IPI00694938 | SERPINH1 Serpin H1 | 39 | - | - | 0.230 | -* | -* |
| 42 | IPI00695508 | CALM3;CALM Calmodulin | 32 | - | 29 | 0.661 | -* | 0.985 |
| 43 | IPI00715508 | PAFAH1B3 Platelet-activating factor acetylhydrolase IB subunit gamma | 31 | - | - | 0.431 | -* | -* |
| 44 | IPI00691137 | LOC100137883;LOC100297716;TMSB4 Thymosin beta-4 | 31 | - | - | 0.7237 | -* | -* |
| 45 | IPI00686092 | PRDX1 Peroxiredoxin-1 | 48 | 15 | - | 0.488 | 0.680 | -* |
| 46 | IPI00705354 | ATOX1 Copper transport protein ATOX1 | 24 | - | 17 | 1.637 | -* | 2.442 |
| 47 | IPI00702790 | MACF1 microtubule-actin cross-linking factor 1 | 30 | - | - | 0.029 | -* | -* |
| 48 | IPI00686546 | CCT2 T-complex protein 1 subunit beta | 31 | 58 | - | 0.172 | 1.240 | -* |
| 49 | IPI00718444 | CTNND1 catenin delta-1 | 28 | 19 | - | 0.086 | 0.120 | -* |
| 50 | IPI00687409 | LOC100336093;MYL12B Myosin regulatory light chain 12B | 37 | - | - | 0.574 | -* | -* |
| 51 | IPI00699092 | TTC39B tetratricopeptide repeat domain 39B | 29 | - | - | 0.144 | -* | -* |
| 52 | IPI00693929 | DCTN2 Dynactin subunit 2 | 24 | 21 | - | 0.230 | 0.320 | -* |
| 53 | IPI00694142 | MIF Macrophage migration inhibitory factor | 31 | 26 | - | 0.919 | 1.280 | -* |
| 54 | IPI00710727 | VCP Transitional endoplasmic reticulum ATPase | 39 | - | 28 | 0.230 | -* | 0.171 |
| 55 | IPI00712042 | RNH1 Ribonuclease/angiogenin inhibitor 1 | 37 | 19 | - | 0.230 | 0.320 | -* |
| 56 | IPI00707751 | EEF2 Elongation factor 2 | 47 | - | 28 | 0.115 | -* | 0.171 |
| 57 | IPI00712133 | FASN Fatty acid synthase | 36 | 27 | 19 | 0.086 | 0.120 | 0.043* |
| 58 | IPI00706632 | EEF1G Elongation factor 1-gamma | 33 | - | 23 | 0.431 | -* | 0.300 |
| 59 | IPI00906952 | Uncharacterized protein | 33 | - | - | 0.316 | -* | -* |
| 60 | IPI00695419 | DBI Acyl-CoA-binding protein | 36 | - | - | 1.149 | -* | -* |
| 61 | IPI00924223 | ZEB2 Uncharacterized protein | 27 | - | - | 0.086 | -* | -* |
| 62 | IPI01017521 | ASPM Abnormal spindle-like microcephaly-associated protein homolog (Fragment) | 27 | - | - | 0.029 | -* | -* |
| 63 | IPI00709465 | P4HB Protein disulfide-isomerase | 27 | - | - | 0.201 | -* | -* |
| 64 | IPI00688816 | CLTC Clathrin heavy chain 1 | 36 | 28 | - | 0.057 | 0.080 | -* |
| 65 | IPI00691663 | PLS1 Plastin-1 | 40 | 22 | - | 0.144 | 0.200 | -* |
| 66 | IPI00716748 | BCAM Basal cell adhesion molecule | 33 | 19 | - | 0.144 | 0.200 | -* |
| 67 | IPI00713901 | EIF2S2 Eukaryotic translation initiation factor 2 subunit 2 | 29 | 23 | - | 29 | 23 | -* |
| 68 | IPI00704353 | TUBA4A Tubulin alpha-4A chain | 29 | 23 | - | 0.201 | 0.280 | -* |
| 69 | IPI00711750 | ARPC3 Actin-related protein 2/3 complex subunit 3 | 32 | - | - | 0.546 | -* | -* |
| 70 | IPI01001324 | LOC533883 KIAA1671 protein-like | 25 | - | - | 0.057 | -* | -* |
| 71 | IPI00714708 | DHX9 ATP-dependent RNA helicase A | 25 | - | - | 0.086 | -* | -* |
| 72 | IPI00903876 | Uncharacterized protein | 25 | - | - | 0.747 | -* | -* |
| 73 | IPI00701894 | JUP Junction plakoglobin | 35 | 14 | - | 0.144 | 0.200 | -* |
| 74 | IPI00711338 | LONP2 Lon protease homolog 2, peroxisomal | 24 | - | - | 0.115 | -* | -* |
| 75 | IPI00698179 | HSPA4 Uncharacterized protein | 17 | - | - | 0.115 | -* | -* |
| 76 | IPI00704325 | WARS Tryptophanyl-tRNA synthetase, cytoplasmic | 23 | - | - | 0.201 | -* | -* |
| 77 | IPI00690680 | HDDC3 HD domain-containing protein 3 | 23 | - | - | 0.546 | -* | -* |
| 78 | IPI00727417 | MSN Moesin | 29 | 16 | - | 0.144 | 0.200 | -* |
| 79 | IPI01002905 | HSPD1 60 kDa heat shock protein, mitochondrial | 30 | 23 | - | 0.546 | 0.240* | -* |
| 80 | IPI00713536 | RPS12 40S ribosomal protein S12 | 22 | 25 | - | 0.775 | 1.080 | -* |
| 81 | IPI00685613 | LOC100295775 Uncharacterized protein | 20 | 21 | - | 0.976 | 1.360 | -* |
| 82 | IPI01004262 | LOC100337442 ribosomal protein L35-like | 29 | - | 13 | 0.172 | -* | 0.257 |
| 83 | IPI01028151 | STAT1 134 kDa protein | 24 | - | 24 | 0.086 | -* | 0.129 |
| 84 | IPI00715345 | PC Pyruvate carboxylase, mitochondrial | 16 | - | 32 | 0.086 | -* | 0.129 |
| 85 | IPI00696935 | HNRNPD Uncharacterized protein | 19 | 22 | - | 0.287 | 0.400 | -* |
| 86 | IPI01003143 | SHROOM2 SHROOM2-like, partial | 21 | - | - | 0.057 | -* | -* |
| 87 | IPI00709517 | DIAPH1 diaphanous homolog 1-like | 24 | - | - | 0.086 | -* | -* |
| 88 | IPI00700509 | CCT7 T-complex protein 1 subunit eta | 24 | - | 20 | 0.172 | -* | 0.257 |
| 89 | IPI00716534 | DDX1 DEAD (Asp-Glu-Ala-Asp) box polypeptide 1 | 20 | - | - | 0.115 | -* | -* |
| 90 | IPI00685601 | RPS3 40S ribosomal protein S3 | 20 | - | - | 0.402 | -* | -* |
| 91 | IPI00710247 | KPNB1 Uncharacterized protein | 15 | - | - | 0.115 | -* | -* |
| 92 | IPI00698249 | MYH10 Nonmuscle myosin heavy chain B (Fragment) | 20 | - | - | 1.149 | -* | -* |
| 93 | IPI00689902 | NPM1 Nucleophosmin | 16 | - | 16 | 0.345 | -* | 0.514 |
| 94 | IPI00692105 | SELV selenoprotein V | 14 | - | 13 | 0.258 | -* | 0.386 |
Downregulated proteins in MAC-T cell supplemented with 0.6 mM D-Met and HMBi related to control.
MAC-T, immortalized bovine mammary epithelial cell line; D-Met, D-methionine; HMBi, 2-hydroxy-4-methylthiobutanoic acid i.
HMBi supplementation stimulated the production of EIF3A protein essential for protein translation initiation [19,28] higher than the D-Met group. EIF3A is vital for stimulating protein synthesis [19,28]. The RPS12 and RPS21 were decreased in the HMBi group but not in the D-Met group. The RPS12 and RPS21 proteins are ribosome protein components found in 40S subunit [35]. Increase in EIF3A and the decrease in RPS12 and RPS21 ribosomal protein components when milk protein synthesis is increasing agreed with previous studies [36,37]. It is said that protein export and transformation of AA going to tRNA is increased during lactation involving EIF3A despite a decrease in protein synthesis machinery like RPS12 and RPS21 in the ribosomes. This results in an overall increase in milk protein synthesis and mammary gland milk protein secretion [36,37]. Another study found a decrease in ribosomal protein expression in spite of the increase in milk protein synthesis during lactation [36]. This finding suggests that the decrease or no increase in the number of ribosomal components despite the increase in beta-casein expression and milk protein secretion is a way in which the mammary gland can focus on mRNA translation of proteins related to milk synthesis rather than ribosomes. This allows mammary epithelial cells to synthesize milk protein at an optimal level [36]. The ribosomes in the mammary gland decrease during lactation to favor beta-casein synthesis [36].
Pathways linked to protein and energy metabolism significantly affected by the supplemental treatments are shown in Table 7. The glycolysis pathway was activated by D-Met and HMBi treatments. The pentose phosphate pathway was activated by HMBi supplementation, and pyruvate metabolism was stimulated by D-Met supplementation. The activation by D-Met supplementation of glyceraldehyde 3-phosphate dehydrogenase (GAPDH), pyruvate metabolism, glycolysis, and galactose metabolism which are energy production pathways will eventually inhibit adenosine monophosphate kinase (AMPK), a known inhibitor of mTOR, and this will result in promoting beta-casein gene expression and increase protein synthesis [38-41]. In addition, the activation of the above-mentioned pathways was expected because the treatment supplementation provides additional energy sources since D-Met and HMBi are known carbon skeleton sources.
Table 7. Protein and energy metabolism-related pathways affected by supplementation treatments compared with control.
| Detected pathway | D-Met | HMBi |
|---|---|---|
| Apoptosis signaling | ● | |
| ATP synthesis | ||
| Fructose galactose metabolism | ● | |
| FAS signaling | ● | ● |
| Glycolysis | ● | ● |
| Heterotrimeric G-protein signaling pathway (Gi alpha- and Gs alpha-mediated) | ● | |
| Heterotrimeric G-protein signaling pathway (Gq alpha- and Go alpha-mediated) | ● | |
| Pentose phosphate | ● | |
| PI3 kinase | ● | |
| Pyruvate metabolism | ● | |
| Ubiquitin proteasome | ● | |
| Insulin/IGF pathway-mitogen activated protein kinase/MAP kinase cascade | ● | |
| Insulin/IGF pathway -protein kinase B signaling cascade | ● |
●, Significantly increased protein and energy metabolism-related pathways (p < 0.05) relative to control, run in PANTHER program for Bos taurus (see methods for detailed explanation).
D-Met, D-methionine; HMBi, 2-hydroxy-4-methylthiobutanoic acid i; ATP, adenosine triphosphate; PI3, phosphoinositide 3; IGF, insulin-like growth factor; MAP, mitogen-activated protein.
HMBi also stimulated the glycolysis and pentose phosphate pathways, which are involved in metabolic pathways of energy production, and promote increased glucose 1-phosphate which is an energy metabolic intermediate product. These reactions could also influence mTOR stimulation by inhibiting AMPK that will increase beta-casein gene expression and milk protein synthesis [39,40]. The AMPK is a fuel-sensing enzyme that is present in mammalian cells [40]. Previous studies reported that energy intermediates indirectly activate protein synthesis by blocking AMPK, a known direct inhibitor of the mTOR pathway [7,39,40]. An increase in energy status can block the inhibition of AMPK to mTOR [34].
In the analysis of intracellular AA levels inside MAC-T cells, intracellular Met levels in MAC-T cells increased significantly in the D-Met supplemented cells (Fig. 5; p < 0.05). The lack of increase in cell-free Met in HMBi treatment suggests that a small amount of HMBi was converted to Met within the cells. Thus a direct reaction of HMBi with the cell could be possible, as shown in the significantly higher beta-casein and S6K1 gene expression and numerically higher medium protein quantity in HMBi compared to D-Met treatment and control groups.
Fig. 5. The amino acid content in MAC-T cells was supplemented with control, D-Met (+0.6 mM), and HMBi (+0.6 mM).
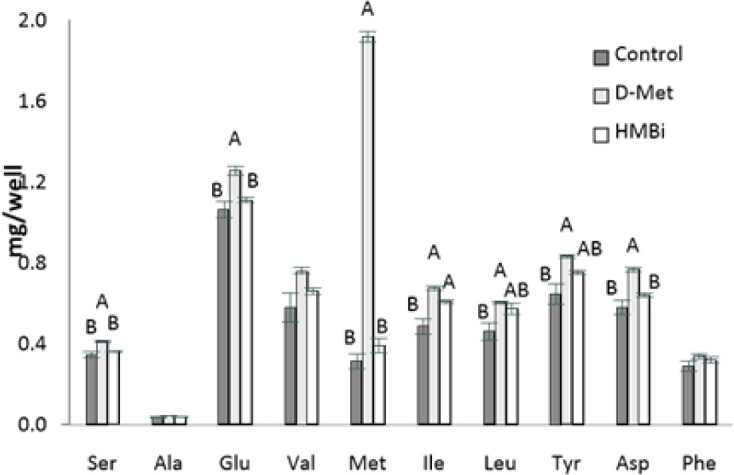
The values are means ± SE (n = 3). A, B, indicate significant differences at p < 0.05 by least significant difference (LSD) test. MAC-T, immortalized bovine mammary epithelial cell line; D-Met, D-methionine; HMBi, 2-hydroxy-4-methylthiobutanoic acid i.
This trend is also seen in serine, glumatic acid, and aspartic acid. There was also a higher concentration of isoleucine found inside the cells in the D-Met and HMBi groups compared to control (p < 0.05). The D-Met group has a higher intracellular concentration of leucine and tyrosine than the control but is not significantly different from the HMBi group (p < 0.05).
Metabolome analysis
Pathway metabolite detection results are listed in Table 10. Most pathways related to the detected metabolites were involved in energy and AA metabolism. Energy pathways such as glycolysis, gluconeogenesis, and the pyruvate metabolism pathway were activated by D-Met supplementation. The detected metabolites affected by supplemental treatments are listed in Table 11. D-Met supplementation increased the production of seven metabolites and decreased UMP. HMBi supplementation increased the production of three metabolites (and decreased that of UMP and N-acetyl-L-glutamate). It also increased the production of the energy metabolite glucose 1-phosphate.
Table 10. Metabolic pathways affected by supplementation treatment compared with control.
| Metabolite-related pathway | D-Met | HMBi |
|---|---|---|
| Alanine, aspartate, and glutamate metabolism | ● | |
| Aminoacyl-tRNA biosynthesis | ● | ● |
| Arginine and proline metabolism | ● | |
| β-Alanine metabolism | ● | |
| Butanoate metabolism | ||
| Citrate cycle (TCA cycle) | ||
| Cysteine and methionine metabolism | ● | |
| D-Glutamine and D-glutamate metabolism | ● | |
| Glycine, serine, and threonine metabolism | ● | |
| Glycolysis or gluconeogenesis | ● | |
| Glyoxylate and dicarboxylate metabolism | ||
| Histidine metabolism | ||
| Inositol phosphate metabolism | ● | |
| Pantothenate and CoA biosynthesis | ||
| Pentose phosphate pathway | ● | |
| Phenylalanine metabolism | ● | |
| Propanoate metabolism | ||
| Pyruvate metabolism | ● | |
| Tyrosine metabolism | ● | |
| Ubiquinone and another terpenoid-quinone biosynthesis |
●, Significantly increased pathway metabolites determined by Metabo Analyst v. 3.0 software for Bos taurus, relative to control (p < 0.05) (see Methods for detailed explanation).
●, Pathway detection metabolites affected by the application of treatments were further analyzed by Dunnett’s Multiple Comparison test, a multiple comparison procedure to compare each of several treatments with a single control.
D-Met, D-methionine; HMBi, 2-hydroxy-4-methylthiobutanoic acid i.
Table 11. Metabolites affected by supplementation treatments compared with control.
| The observed change in the production | D-Met | HMBi |
|---|---|---|
| Increase | Serine | Glucose 1-phosphate |
| Glutamine | 6-Phosphogluconate | |
| Methionine | Isoleucine | |
| Aspartate | ||
| Isoleucine | ||
| Leucine | ||
| Tyrosine | ||
| Decrease | Uridine monophosphate | Uridine monophosphate |
| N-Acetyl-L-glutamate |
Metabolite analysis (Bos taurus). Increased and decreased metabolites were further analyzed by Dunnett’s Multiple Comparison test which is a multiple comparison procedure for treatments with a single control.
D-Met, D-methionine; HMBi, 2-hydroxy-4-methylthiobutanoic acid i.
To illustrate the interactions of different Met treatments in MAC-T cells, diagrams of the relationships among various components were created (Figs. 6 and 7). Fig. 6 shows the increased relative gene expression of beta-casein, S6K1 and EIF4A2, upregulation of GADPH protein and the stimulation of glycolysis, galactose and pyruvate metabolism that resulted in to increase in milk protein synthesis upon addition of D-Met. Fig. 7 shows that upon the addition of HMBi, there were increases in the relative gene expression of beta-casein, S6K1, and EIF3A, stimulation of glycolysis and pentose phosphate pathways, and increased in the glucose 1-phosphate metabolite.
Fig. 6. Diagram of the effect of D-Met supplementation on the milk protein synthesis pathway.
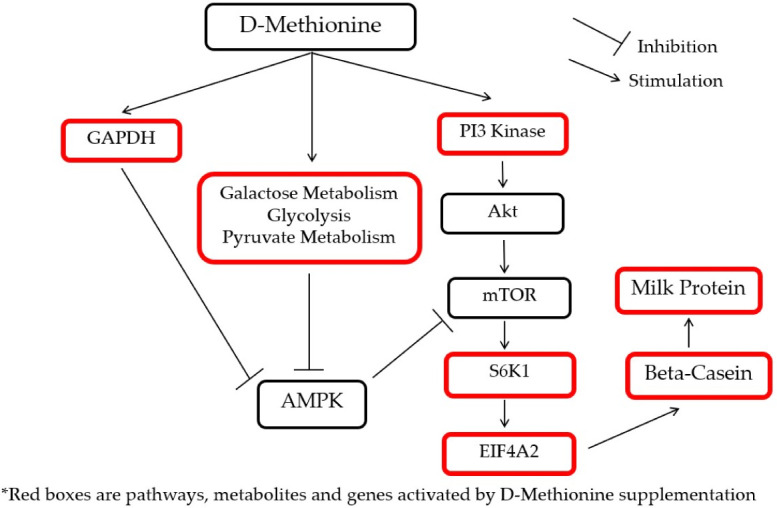
GAPDH, glyceraldehyde 3-phosphate dehydrogenase; PI3 kinases, phosphoinositide 3-kinases; mTOR, mammalian target of rapamycin; AMPK, AMP-activated protein kinase; S6K1, S6 kinase beta-1; D-Met, D-methionine.
Fig. 7. Diagram of the effect of HMBi addition on the beta-casein synthesis pathway.
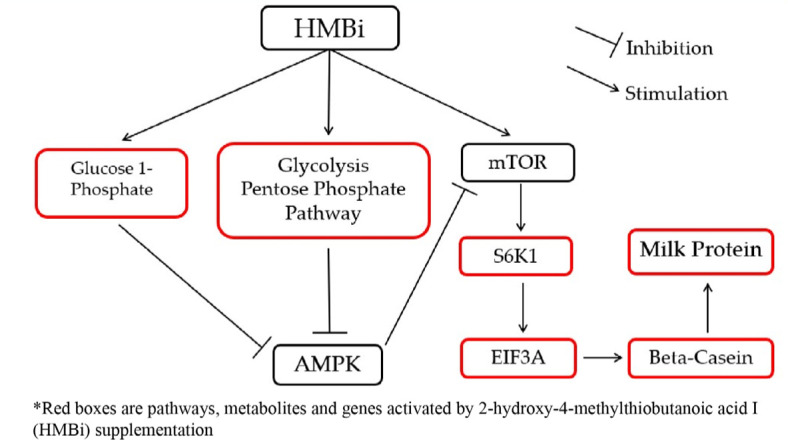
HMBi, 2-hydroxy-4-methylthiobutanoic acid i; mTOR, mammalian target of rapamycin; S6K1, S6 kinase beta-1; AMPK, adenosine monophosphate kinase; EIF3A: eukaryotic translation initiation factor 3 subunit.
CONCLUSION
Taken together, these results show that D-Met and HMBi are effective for stimulating milk protein synthesis. D-Met and HMBi supplementation effectively stimulated beta-casein and S6K1 mRNA expression. They are also effective and efficient in activating pathways linked with milk protein synthesis and increasing the expression of proteins and the production of metabolites involved in milk protein synthesis.
Acknowledgements
This paper was supported by Konkuk University Researcher Fund in 2020.
Competing interests
No potential conflict of interest relevant to this article was reported.
Funding sources
This paper was supported by the Korea Institute of Planning and Evaluation for Technology in Food, Agriculture, Forestry (IPET) through the Agri-Bio Industry Technology Development Program (117030- 03-3-HD020).
Availability of data and material
Upon a reasonable request, the datasets of this study can be available from the corresponding author.
Authors’ contributions
Conceptualization: Jeon SW, Conejos JRV, Lee HG.
Data curation: Jeon SW, Conejos JRV, Lee JS, Lee HG.
Formal analysis: Jeon SW, Conejos JRV, Lee JS, Keum SH.
Methodology: Jeon SW, Conejos JRV, Keum SH.
Validation: Lee JS, Lee HG.
Investigation: Jeon SW, Conejos JRV.
Writing - original draft: Jeon SW, Conejos JRV, Lee JS, Keum SH, Lee HG.
Writing - review & editing: Jeon SW, Conejos JRV, Lee JS, Keum SH, Lee HG.
Ethics approval and consent to participate
This article does not require IRB/IACUC approval because there are no human and animal participants.
REFERENCES
- 1.NRC [National Research Council] Nutrient requirements of dairy cattle. 7th rev. ed. Washington, DC: The National Academies Press; 2001. Subcommittee on dairy cattle nutrition. Committee on animal nutrition, board on agriculture and natural resources. [Google Scholar]
- 2.Métayer S, Seiliez I, Collin A, Duchêne S, Mercier Y, Geraert PA, et al. Mechanisms through which sulfur amino acids control protein metabolism and oxidative status. J Nutr Biochem. 2008;19:207–15. doi: 10.1016/j.jnutbio.2007.05.006. [DOI] [PubMed] [Google Scholar]
- 3.Orellana RA, Jeyapalan A, Escobar J, Frank JW, Nguyen HV, Suryawan A, et al. Amino acids augment muscle protein synthesis in neonatal pigs during acute endotoxemia by stimulating mTOR-dependent translation initiation. Am J Physiol Endocrinol Metab. 2007;293:E1416–25. doi: 10.1152/ajpendo.00146.2007. [DOI] [PubMed] [Google Scholar]
- 4.Kimball SR, Jefferson LS. Amino acids as regulators of gene expression. Nutr Metab. 2004;1:3. doi: 10.1186/1743-7075-1-3. [DOI] [PMC free article] [PubMed] [Google Scholar]
- 5.Huang YL, Zhao F, Luo CC, Zhang X, Si Y, Sun Z, et al. SOCS3-mediated blockade reveals major contribution of JAK2/STAT5 signaling pathway to lactation and proliferation of dairy cow mammary epithelial cells in vitro. Molecules. 2013;18:12987–3002. doi: 10.3390/molecules181012987. [DOI] [PMC free article] [PubMed] [Google Scholar]
- 6.Zhang X, Zhao F, Si Y, Huang Y, Yu C, Luo C, et al. GSK3β regulates milk synthesis in and proliferation of dairy cow mammary epithelial cells via the mTOR/S6K1 signaling pathway. Molecules. 2014;19:9435–52. doi: 10.3390/molecules19079435. [DOI] [PMC free article] [PubMed] [Google Scholar]
- 7.Ranga Niroshan Appuhamy JAD, Knoebel NA, Deepthi Nayananjalie WA, Escobar J, Hanigan MD. Isoleucine and leucine independently regulate mTOR signaling and protein synthesis in MAC-T cells and bovine mammary tissue slices. J Nutr. 2012;142:484–91. doi: 10.3945/jn.111.152595. [DOI] [PubMed] [Google Scholar]
- 8.Toerien CA, Trout DR, Cant JP. Nutritional stimulation of milk protein yield of cows is associated with changes in phosphorylation of mammary eukaryotic initiation factor 2 and ribosomal s6 kinase 1. J Nutr. 2010;140:285–92. doi: 10.3945/jn.109.114033. [DOI] [PubMed] [Google Scholar]
- 9.Deval C, Chaveroux C, Maurin AC, Cherasse Y, Parry L, Carraro V, et al. Amino acid limitation regulates the expression of genes involved in several specific biological processes through GCN2-dependent and GCN2-independent pathways. FEBS J. 2009;276:707–18. doi: 10.1111/j.1742-4658.2008.06818.x. [DOI] [PubMed] [Google Scholar]
- 10.Jousse C, Averous J, Bruhat A, Carraro V, Mordier S, Fafournoux P. Amino acids as regulators of gene expression: molecular mechanisms. Biochem Biophys Res Commun. 2004;313:447–52. doi: 10.1016/j.bbrc.2003.07.020. [DOI] [PubMed] [Google Scholar]
- 11.Dibner JJ, Knight CD. Conversion of 2-hydroxy-4-(methylthio)butanoic acid to L-methionine in the chick: a stereospecific pathway. J Nutr. 1984;114:1716–23. doi: 10.1093/jn/114.9.1716. [DOI] [PubMed] [Google Scholar]
- 12.Saunderson CL. Comparative metabolism of L-methionine, DL-methionine and DL-2-hydroxy 4-methylthiobutanoic acid by broiler chicks. Br J Nutr. 1985;54:621–33. doi: 10.1079/BJN19850149. [DOI] [PubMed] [Google Scholar]
- 13.Dupuis L, Saunderson CL, Puigserver A, Brachet P. Oxidation of methionine and 2-hydroxy 4-methylthiobutanoic acid stereoisomers in chicken tissues. Br J Nutr. 1989;62:63–75. doi: 10.1079/BJN19890008. [DOI] [PubMed] [Google Scholar]
- 14.Polan CE, Chandler PT, Miller CN. Methionine hydroxy analog: varying levels for lactating cows. J Dairy Sci. 1970;53:607–10. doi: 10.3168/jds.S0022-0302(70)86264-6. [DOI] [PubMed] [Google Scholar]
- 15.Patterson JA, Kung L., Jr Metabolism of DL-methionine and methionine analogs by rumen microorganisms. J Dairy Sci. 1988;71:3292–301. doi: 10.3168/jds.S0022-0302(88)79934-8. [DOI] [PubMed] [Google Scholar]
- 16.Robert J, Ferragu V, Bouza B, Williams PEV. Proceedings of the British Society of Animal Science. Scarborough: Cambridge University Press; 1998. Influence of different sources of methionine (DL methionine, hydroxyl-analogues of methionine) and sulphur on the digestibility of organic matter of maize silage measured in vitro. [DOI] [Google Scholar]
- 17.Sloan BK, Hoover WH, Miller Webster TK, Schwab CG, Whitehouse NL. Action of hydroxy methyl butanoic acid (HMB) on microbial growth and metabolism. J Dairy Sci. 2000;83:269. [Google Scholar]
- 18.Dong X, Zhou Z, Saremi B, Helmbrecht A, Wang Z, Loor JJ. Varying the ratio of Lys:Met while maintaining the ratios of Thr:Phe, Lys:Thr, Lys:His, and Lys:Val alters mammary cellular metabolites, mammalian target of rapamycin signaling, and gene transcription. J Dairy Sci. 2018;101:1708–18. doi: 10.3168/jds.2017-13351. [DOI] [PubMed] [Google Scholar]
- 19.Conejos JRV, Nejad JG, Kim JE, Moon JO, Lee JS, Lee HG. Supplementing with l-tryptophan increases medium protein and alters expression of genes and proteins involved in milk protein synthesis and energy metabolism in bovine mammary cells. Int J Mol Sci. 2021;22:2751. doi: 10.3390/ijms22052751. [DOI] [PMC free article] [PubMed] [Google Scholar]
- 20.Kim J, Lee HG. Effects of L-histidine and sodium acetate on β-casein expression in nutrient-restricted bovine mammary epithelial cells. Animals. 2021;11:1444. doi: 10.3390/ani11051444. [DOI] [PMC free article] [PubMed] [Google Scholar]
- 21.Wang T, Lim JN, Bok JD, Kim JH, Kang SK, Lee SB, et al. Association of protein expression in isolated milk epithelial cells and cis-9, trans-11 conjugated linoleic acid proportions in milk from dairy cows. J Sci Food Agric. 2014;94:1835–43. doi: 10.1002/jsfa.6502. [DOI] [PubMed] [Google Scholar]
- 22.Wang T, Lee SB, Hwang JH, Lim JN, Jung US, Kim MJ, et al. Proteomic analysis reveals PGAM1 altering cis-9, trans-11 conjugated linoleic acid synthesis in bovine mammary gland. Lipids. 2015;50:469–81. doi: 10.1007/s11745-015-4009-9. [DOI] [PubMed] [Google Scholar]
- 23.Livak KJ, Schmittgen TD. Analysis of relative gene expression data using real-time quantitative PCR and the 2-ΔΔCT Method. Methods. 2001;25:402–8. doi: 10.1006/meth.2001.1262. [DOI] [PubMed] [Google Scholar]
- 24.Ishihama Y, Oda Y, Tabata T, Sato T, Nagasu T, Rappsilber J, et al. Exponentially modified protein abundance index (emPAI) for estimation of absolute protein amount in proteomics by the number of sequenced peptides per protein. Mol Cell Proteomics. 2005;4:1265–72. doi: 10.1074/mcp.M500061-MCP200. [DOI] [PubMed] [Google Scholar]
- 25.Park C, Yun S, Lee SY, Park K, Lee J. Metabolic profiling of Klebsiella oxytoca: evaluation of methods for extraction of intracellular metabolites using UPLC/Q-TOF-MS. Appl Biochem Biotechnol. 2012;167:425–38. doi: 10.1007/s12010-012-9685-9. [DOI] [PubMed] [Google Scholar]
- 26.Kim YE, Jeon HJ, Kim D, Lee SY, Kim KY, Hong J, et al. Quantitative proteomic analysis of 2D and 3D cultured colorectal cancer cells: profiling of tankyrase inhibitor XAV939-induced proteome. Sci Rep. 2018;8:13255. doi: 10.1038/s41598-018-31564-6. [DOI] [PMC free article] [PubMed] [Google Scholar]
- 27.Lu L, Gao X, Li Q, Huang J, Liu R, Li H. Comparative phosphoproteomics analysis of the effects of L-methionine on dairy cow mammary epithelial cells. Can J Anim Sci. 2012;92:433–42. doi: 10.4141/cjas2012-063. [DOI] [Google Scholar]
- 28.Jeon SW, Conejos JR, Kim J, Kim MJ, Lee JE, Lee BS, et al. Supplementing conjugated and non-conjugated L-methionine and acetate alters expression patterns of CSN2, proteins and metabolites related to protein synthesis in bovine mammary cells. J Dairy Res. 2020;87:70–7. doi: 10.1017/S0022029919000979. [DOI] [PubMed] [Google Scholar]
- 29.Nan X, Bu D, Li X, Wang J, Wei H, Hu H, et al. Ratio of lysine to methionine alters expression of genes involved in milk protein transcription and translation and mTOR phosphorylation in bovine mammary cells. Physiol Genomics. 2014;46:268–75. doi: 10.1152/physiolgenomics.00119.2013. [DOI] [PubMed] [Google Scholar]
- 30.Reynolds CK, Harmon DL, Cecava MJ. Absorption and delivery of nutrients for milk protein synthesis by portal-drained viscera. J Dairy Sci. 1994;77:2787–808. doi: 10.3168/jds.S0022-0302(94)77220-9. [DOI] [PubMed] [Google Scholar]
- 31.Shennan DB, Peaker M. Transport of milk constituents by the mammary gland. Physiol Rev. 2000;80:925–51. doi: 10.1152/physrev.2000.80.3.925. [DOI] [PubMed] [Google Scholar]
- 32.Cant JP, Kim JJM, Cieslar SRL, Doelman J. Symposium review: amino acid uptake by the mammary glands: Where does the control lie? J Dairy Sci. 2018;101:5655–66. doi: 10.3168/jds.2017-13844. [DOI] [PubMed] [Google Scholar]
- 33.Kim J, Lee JE, Lee JS, Park JS, Moon JO, Lee HG. Phenylalanine and valine differentially stimulate milk protein synthetic and energy-mediated pathway in immortalized bovine mammary epithelial cells. J Anim Sci Technol. 2020;62:263–75. doi: 10.5187/jast.2020.62.2.263. [DOI] [PMC free article] [PubMed] [Google Scholar]
- 34.Proud CG. Signalling to translation: how signal transduction pathways control the protein synthetic machinery. Biochem J. 2007;403:217–34. doi: 10.1042/BJ20070024. [DOI] [PubMed] [Google Scholar]
- 35.O’Donohue MF, Choesmel V, Faubladier M, Fichant G, Gleizes PE. Functional dichotomy of ribosomal proteins during the synthesis of mammalian 40S ribosomal subunits. J Cell Biol. 2010;190:853–66. doi: 10.1083/jcb.201005117. [DOI] [PMC free article] [PubMed] [Google Scholar]
- 36.Bionaz M, Periasamy K, Rodriguez-Zas SL, Everts RE, Lewin HA, Hurley WL, et al. Old and new stories: revelations from functional analysis of the bovine mammary transcriptome during the lactation cycle. PLOS ONE. 2012;7:e33268. doi: 10.1371/journal.pone.0033268. [DOI] [PMC free article] [PubMed] [Google Scholar]
- 37.Mercier JC, Gaye P. In: Biochem lactation. Mepham TB, editor. Amsterdam: Elsevier Science; 1983. Milk protein synthesis; pp. 177–227. editor. p. [Google Scholar]
- 38.Berg JM, Tymoczko JL, Stryer L. Biochemistry. 5th ed. New York: W.H. Freeman; 2002. Glycolysis is an energy-conversion pathway in many organisms. [Google Scholar]
- 39.Sarbassov DD, Ali SM, Sabatini DM. Growing roles for the mTOR pathway. Curr Opin Cell Biol. 2005;17:596–603. doi: 10.1016/j.ceb.2005.09.009. [DOI] [PubMed] [Google Scholar]
- 40.Richter EA, Ruderman NB. AMPK and the biochemistry of exercise: implications for human health and disease. Biochem J. 2009;418:261–75. doi: 10.1042/BJ20082055. [DOI] [PMC free article] [PubMed] [Google Scholar]
- 41.Appuhamy JADRN, Nayananjalie WA, England EM, Gerrard DE, Akers RM, Hanigan MD. Effects of AMP-activated protein kinase (AMPK) signaling and essential amino acids on mammalian target of rapamycin (mTOR) signaling and protein synthesis rates in mammary cells. J Dairy Sci. 2014;97:419–29. doi: 10.3168/jds.2013-7189. [DOI] [PubMed] [Google Scholar]