

Abstract
The nearly universal colonization of surfaces in marine waters by bacteria and the formation of biofilms and biofouling communities have important implications for ecological function and industrial processes. However, the dynamics of surface attachment and colonization in situ, particularly during the early stages of biofilm establishment, are not well understood. Experimental surfaces that differed in their degrees of hydrophilicity or hydrophobicity were incubated in a salt marsh estuary tidal creek for 24 or 72 h. The organisms colonizing these surfaces were examined by using a cultivation-independent approach, amplified ribosomal DNA restriction analysis. The goals of this study were to assess the diversity of bacterial colonists involved in early succession on a variety of surfaces and to determine the phylogenetic affiliations of the most common early colonists. Substantial differences in the representation of different cloned ribosomal DNA sequences were found when the 24- and 72-h incubations were compared, indicating that some new organisms were recruited and some other organisms were lost. Phylogenetic analyses of the most common sequences recovered showed that the colonists were related to organisms known to inhabit surfaces or particles in marine systems. A total of 22 of the 26 clones sequenced were affiliated with the Roseobacter subgroup of the α subdivision of the division Proteobacteria (α-Proteobacteria), and most of these clones were recovered at a high frequency from all surfaces after 24 or 72 h of incubation. Two clones were affiliated with the Alteromonas group of the γ-Proteobacteria and appeared to be involved only in the very early stages of colonization (within the first 24 h). A comparison of the colonization patterns on the test surfaces indicated that the early bacterial community succession rate and/or direction may be influenced by surface physicochemical properties. However, organisms belonging to the Roseobacter subgroup are ubiquitous and rapid colonizers of surfaces in coastal environments.
Solid surfaces that are in contact with water in natural and man-made environments are rapidly colonized by bacteria. This pervasive colonization of surfaces by bacteria and the formation of bacterial biofilm or biofouling communities have important implications for ecological function, industrial processes, and human health (14, 16, 22, 52). These surface-associated microorganisms contribute substantially to nutrient cycling and degradation of xenobiotic compounds in natural systems and are responsible for biofouling of man-made structures and for infections related to indwelling medical devices. The ability to colonize surfaces provides bacteria with important advantages, including (i) increased access to nutrients, (ii) protection against toxins (e.g., biocides, heavy metals, or UV radiation), (iii) maintenance of extracellular enzyme activities, and (iv) shelter from predation. Increased recognition of the importance of surface colonization and improved methods for studying this process have led to great expansion of research in this area. However, the dynamics of surface colonization in natural systems, particularly during the early stages of biofilm establishment, are not well understood.
It is thought that development of a biofilm community on a submerged surface occurs through a sequence of specific, but poorly understood chemical and biological processes (11, 13, 78). It begins with the formation of a conditioning film, which forms spontaneously on any submerged surface (48). Once the conditioning film is in place, bacteria attach to the surface, and a biofilm microbial community begins to form (5). It is thought that surface colonization by bacteria proceeds through an ordered series of recruitment processes. First, pioneer species of bacteria interact with the conditioning film and form the initial assemblage of surface biota and biopolymers (49). Growth and reproduction of the primary colonizing bacteria are not the only contributions of these organisms to biofilm accumulation. These primary organisms also modify the surface characteristics of the substratum (10), rendering it suitable (or unsuitable) for subsequent colonization by secondary microorganisms (12). Specific and/or nonspecific interactions between the primary colonists and subsequent recruits permits new organisms to efficiently colonize, which results in a primary biofilm community (43, 80). Finally, through synergistic and/or competitive interactions among some colonist species (15, 53, 81), as well as recruitment of some new species and/or loss of some previous colonists (50, 78), the mature biofilm community is formed. This sequence of events is well understood for human dental surfaces, and the primary colonists and the participation of these organisms in subsequent colonization stages have been elucidated. However, this detailed level of understanding has not been attained for other types of surfaces. In particular, the role(s) and surface specificities of primary colonists are largely unknown for most surface types, including surfaces in marine environments.
Several physicochemical properties of substrata, such as net surface charge, surface hydrophobicity, surface free energy, critical surface tension, surface wettability, and surface molecular topography (77), are related to bacterial attachment on surfaces (see references 7 and 23 for recent reviews). It is possible to alter surface colonization by manipulating surface physicochemical properties, as demonstrated by Wiencek and Fletcher (76) and Ista et al. (36). In the present study we investigated bacterial early colonization and succession on man-made surfaces incubated in a salt marsh estuary. Surfaces having various physicochemical properties were incubated, and colonization was examined by using a cultivation-independent approach. The goals of this study were (i) to assess the diversity of primary colonizers and the earliest successional stages on surfaces having different physicochemical properties and (ii) to determine the phylogenetic affiliations of the most common early colonists on different surfaces by analyzing 16S ribosomal DNA (rDNA) sequences.
MATERIALS AND METHODS
Development of polymer test surfaces.
Plastic plates (30 by 30 cm) were spray coated with a clear epoxy undercoat. After the epoxy cured, polyurethane (PU) paint was sprayed on each surface. The PU which we used has substantial weather and chemical resistance. It consists of a polyester polyol (Desmophen R-221-75) and the isocyanurate of hexamethylenediisocyanate (Desmodur N-3300), which react to form the PU. Cobalt 2-ethyhexanoate was used as a catalyst for cross-linking PU. A 10% molar excess of Desmodur was used in order to leave some available isocyanate groups for reaction with the top coat. The top coat was then applied with a paint sprayer, and the coating was allowed to cure at room temperature in a glove bag with a constant flow of nitrogen to avoid competing reactions between the isocyanate and atmospheric moisture. Each type of top coat molecule was hydroxy functionalized in order to ensure that it reacted with the isocyanate of the PU. Although some of the top coat polymers were water soluble, they were bound to the PU and did not wash off. The polymers that were utilized as top coats in order to produce surfaces that had different properties were polyethylene glycol with a molecular weight of 300 (PEG-S) or 35000 (PEG-L), polyethylene glycol monomethyl ether with a molecular weight of 350 (PEG-M), polyvinyl alcohol (PVA), and bis(2-hydroxyethyl ether) of tetrabromobisphenol (BR). Plastic plates that were coated with only the epoxy undercoat and PU were used as control surfaces. The PEG-S and PEG-L surfaces were hydrophilic to different degrees, the PVA, Br, and PU surfaces were hydrophobic to different degrees, and the PEG-M surface was intermediate in terms of hydrophilicity (W. R. Johnson, M. C. Roper, P. A. Noble, S. T. Lindsay, J. M. Tour, and M. Fletcher, Abstr. 99th Gen. Meet. Am. Soc. Microbiol. 1999, abstr. Q-369, p. 604, 1999). The BR surface moiety, tetrabromobisphenol, is a bromophenyl compound whose structure is similar to the structures of metabolites found in the sponge-associated bacterium Micrococcus luteus (9).
Deployment and incubation in the field.
All test surfaces were randomly assigned to slots in a holder constructed from polyvinyl chloride pipes. The plates were held vertically, which allowed water to contact all surfaces. The holder was deployed at Clam Bank Creek in the North Inlet salt marsh system near Georgetown, S.C. (33°20′N, 79°11′W), at a constant depth of 1 m below the water surface on 23 June 1998. The average water temperature, salinity, and pH during incubation were 30°C, 34.9 ppt, and 7.7, respectively. Preliminary studies of bacterial colonization of the test surfaces incubated in laboratory mesocosms showed that little bacterial biomass could be recovered after incubation for less than 24 h, but substantial differences in the degree of colonization appeared within 72 h of submersion (P. A. Noble, H. Dang, C. Roper, M. Dantzler, S. Thieben, M. Kelly, S. T. Lindsay, C. R. Lovell, J. M. Tour, and M. Fletcher, Abstr. 98th Gen. Meet., Am. Soc. Microbiol. 1998, abstr. Q-66, p. 432, 1998). Replicate plates were recovered after 24 or 72 h of incubation, and the microbial biomass was collected.
Collection of colonizing microorganisms.
After the test surfaces were removed from the water, they were drained well and swabbed with sterile cotton gauze. Each gauze swab was then placed in a 50-ml sterile disposable centrifuge tube and frozen on dry ice. The samples were transported to the University of South Carolina, where they were stored at −70°C. Microorganisms were recovered from the gauze by vortexing each preparation in 20 ml of SET buffer (20% [wt/vol] sucrose, 50 mM Tris-HCl [pH 8.0], 50 mM EDTA). The gauze was removed, and the suspension was centrifuged at 8,000 × g for 10 min. Either DNA was extracted from the pellets immediately or the pellets were stored for no more than 2 days at −20°C before extraction.
Genomic DNA extraction.
DNA was extracted by using a modified version of the method of Lovell and Piceno (45). The modifications were as follows: (i) the DNA extraction buffer was 50 mM Tris (pH 8.0)–100 mM EDTA; (ii) a lysozyme digestion step (2 mg of lysozyme per ml, with incubation in an ice slurry for 30 min) was included before sodium dodecyl sulfate was added; (iii) a cetyltrimethylammonium bromide (CTAB) purification step (4), which removed polysaccharides, was included between the two high-salt–ethidium bromide–phenol extraction steps; and (iv) the ion-exchange chromatography step in which DEAE Sephacel is used was omitted as the amount of DNA recovered was usually very small. The amount of DNA was determined by fluorometry by using Hoechst dye 33258 (Sigma) and a Turner Designs model TD-360 fluorometer.
Amplification of 16S rRNA genes.
For PCR amplification of nearly full-length 16S rRNA structural genes (16S rDNA) we used domain Bacteria-specific oligonucleotide primers described by Lane (42) and Marchesi et al. (47). Forward primer 27F (5′-AGAGTTTGATCMTGGCTC-3′; M = A or C) corresponded to positions 8 to 25 in the Escherichia coli numbering system. Reverse primer 1387R (5′-GGGCGGWGTGTACAAGGC-3′; W = A or T) corresponded to E. coli positions 1387 to 1404. PCR amplification was performed by using reaction mixtures (final volume, 25 μl) containing 25 ng of sample DNA, 0.625 U of Expand High Fidelity DNA polymerase (Boehringer Mannheim, Indianapolis, Ind.), 1× Expand HF buffer, 1.5 mM MgCl2, each deoxynucleoside triphosphate at a concentration of 0.2 mM, and each primer at a concentration of 0.25 μM. Reaction mixtures that were identical except that they contained no DNA were used as negative controls, and no products were obtained in all cases. The thermal cycling program used was as follows: initial denaturation at 94°C for 3 min; 5 cycles consisting of 95°C for 60 s, 40°C for 60 s, and 72°C for 90 s; 30 cycles in which the annealing temperature was 43°C; and a final extension step consisting of 72°C for 5 min. Amplified PCR products were analyzed by electrophoresis on 1.5% (wt/vol) SeaKem LE agarose (FMC, Rockland, Maine) gels in 1× TBE (89 mM Tris, 89 mM boric acid, 2 mM EDTA); PstI-digested phage λ DNA was used as the molecular weight standard.
Cloning of 16S rDNA PCR products.
PCR products obtained from the amplification reactions were purified by using a GeneClean kit (Bio 101, Vista, Calif.) and were ligated into pGemT (Promega, Madison, Wis.) and the hybrid vectors used to transform E. coli JM109 competent cells (Promega) by following the manufacturers' instructions. Recombinants were selected by using X-Gal (5-bromo-4-chloro-3-indolyl-β-d-galactopyranoside)–IPTG (isopropyl-β-d-thiogalactopyranoside) indicator Luria-Bertani agar plates supplemented with 100 μg of ampicillin per ml, and clone libraries were constructed for each surface and sampling time. Clone libraries were named on the basis of the surfaces and incubation times used; e.g., the designation BR-24 indicates the BR surface that was incubated for 24 h.
Amplified rRNA gene restriction analysis (ARDRA) screening of 16S rDNA clones.
Crude cell lysates were prepared from clones by using a modified plasmid miniprep method (34). Small amounts of colonies from Luria-Bertani agar plates containing ampicillin were suspended in 250 μl of glass-distilled H2O and incubated in a boiling water bath for 10 min; then the preparations were centrifuged immediately for 30 s at 10,000 × g and stored at 4°C. Cloned rDNA amplimers were reamplified by PCR by using primers homologous to the T7 (5′-GTAATACGACTCACTATAGGGC-3′) and SP6 (5′-ATTTAGGTGACACTATAG-3′) RNA polymerase binding sites that flank the insertion site in the plasmid vector. PCR amplification was performed by using 15 μl of the crude lysate in a reaction mixture (final volume, 25 μl) containing 1× reaction buffer (50 mM KCl, 10 mM Tris-HCl), 1.5 mM MgCl2, each deoxynucleoside triphosphate at a concentration of 0.2 mM, each primer at a concentration of 0.25 μM, and 0.625 U of AmpliTaq Gold DNA polymerase (Perkin-Elmer, Foster City, Calif.). The thermal cycling program used was as follows: initial denaturation at 94°C for 3 min; 30 cycles consisting of 95°C for 30 s, 55°C for 30 s, and 72°C for 30 s; and a final extension step consisting of 72°C for 2 min. Amplimers were screened for the correct size (approximately 1,550 bp) and for purity by agarose gel electrophoresis.
Amplimers were restriction digested in separate reactions by using MspI and HhaI. The restriction fragments were resolved by electrophoresis on 4% (wt/vol) NuSieve 3:1 agarose gels (FMC) in 0.5× TAE (1× TAE is 40 mM Tris, 20 mM acetic acid, and 1 mM EDTA). The gels were stained with ethidium bromide and photographed, and the band patterns were compared in order to identify redundant clones and to define operational taxonomic units (OTUs). The estimated percentages of coverage for the different libraries were calculated as follows: [1 − (n/N)] × 100, where n is the number of unique clones detected in a subsample (library) of size N. This value approximated the probability that all species present in a given sample were represented at least once in the library (31, 55).
Statistical analyses of bacterial communities on surfaces.
Similarities among the surface early colonist assemblages represented by the OTUs which we identified were determined by performing cluster analyses with the SYSTAT 7.0 statistic package (SPSS Inc., Chicago, Ill.). The following two cluster analysis methods were employed: hierarchical and k-means clustering with Euclidean distances. A corresponding dendrogram was constructed with Ward linkages for hierarchical clustering.
16S rDNA sequencing and sequence analyses.
Clones representing the 26 most common OTUs identified by ARDRA were selected for sequencing. Plasmid DNA was prepared by using plasmid miniprep columns as recommended by the manufacturer (Qiagen, Santa Clarita, Calif.), and plasmid quantity and purity were assessed by using fluorometry and agarose gel electrophoresis, respectively. Both strands of sequences spanning the V3 and V5 hypervariable regions (56) of the insert DNA were amplified and sequenced by using primer RL 71A (5′-CCTACGGGAGGCAGCAG-3′), which corresponded to positions 341 to 357 in the E. coli numbering system, and primer RL 72A (5′-CCGTCAATTCCTTTGAGTTT-3′, which corresponded to positions 907 to 926 in the E. coli numbering system. The sequences were determined by using a SequiTherm EXCEL II Long-Read LC DNA sequencing kit (Epicentre Technologies, Madison, Wis.) and a model DNA4000LS sequencer (Li-Cor, Lincoln, Nebr.).
For each cloned sequence, we queried the Sequence_Match (version 2.7) online program of the Ribosomal Database Project-II (RDP-II) (46) and the advanced BLAST search program (2) for the GenBank database maintained by the National Center for Biotechnology Information for an initial determination of the nearest phylogenetic neighbor sequences. Several methods were used to verify the integrity of the sequence data and to help detect chimeras. All sequences were submitted to the RDP-II CHECK_CHIMERA program (46). For sequences that were identified as potentially chimeric, we determined the secondary structure of the 16S rRNA and looked for pairing mismatches in double-stranded regions (26). We also checked for the presence of signature nucleotides (79) in the 16S rDNA region examined.
Phylogenetic analysis of cloned 16S rDNA sequences.
Sequences were aligned by using the CLUSTAL W program (version 1.7) (70) (available from the web server http://www.pasteur.fr/∼letondal/Pise/). The alignment included sequences from representatives of the nearest-neighbor groups, as well as sequences from taxa representing several different bacterial phyla. Sequences of the organisms listed below were used to construct phylogenetic trees (the numbers in parentheses are GenBank nucleotide sequence accession numbers).
(i) Major bacterial phyla and proteobacterial subdivisions.
Sequences of the following members of major bacterial phyla and proteobacterial subdivisions were used: Aquifex pyrophilus (M83548), Chlorobium vibrioforme (M62791), Chrysiogenes arsenatis (X81319), Coprothermobacter proteolyticus (X69335), Cytophaga diffluens (M58765), Desulfovibrio desulfuricans (M34113), Fibrobacter succinogenes (M62685), Fusobacterium necrophorum (X74407), Helicobacter pylori (U00679), Mycobacterium marinum (X52920), Nitrospina gracilis (L35504), Nitrospira marina (X82559), Oscillatoria agardhii (X84811), Planctomyces maris (X62910), Pseudomonas putida (L28676), Rhodocyclus tenuis (D16209), Roseobacter litoralis (X78312), Spirochaeta halophila (M88722), Thermomicrobium roseum (M34115), and Thermotoga subterranea (U22664). Thermococcus peptonophilus (D37983) was used as the outgroup.
(ii) α-Proteobacteria.
Sequences of the following members of the α subdivision of the division Proteobacteria (α-Proteobacteria) were used: Acidiphilium cryptum (X75265), Afipia felis (AF003937), Agrobacterium tumefaciens (M11223), Bartonella quintana (U28268), Beijerinckia indica (M59060), Caulobacter crescentus (AF125194), Erythrobacter longus (M96744), Magnetospirillum magnetotacticum (Y10110), Methylobacterium extorquens (D32224), Methylosinus sporium (M95665), Rhodobacter capsulatus (D16427), Rhodobium marinum (D30790), Rhodopila globiformis (D86513), Rhodoplanes roseus (D25313), Rhodospirillum rubrum (D30778), Rhodospirillum salexigens (D14431), Rhodovulum adriaticum (D16418), Rhodovulum sulfidophilum (D16423), Roseobacter litoralis (X78312), and Sphingomonas paucimobilis (D13725). Escherichia coli (J01695) was used as the outgroup.
(iii) γ-Proteobacteria.
Sequences of the following members of the γ-Proteobacteria were used: Achromatium oxaliferum (L42543), Aeromonas salmonicida (X74680), Alteromonas macleodii (L10938), Ectothiorhodospira marina (X93476), Escherichia coli (J01695), Francisella tularensis (Z21931), Legionella pneumophila (X73402), Methylomicrobium pelagicum (U05570), Oceanospirillum maris (AB006763), Pasteurella trehalosi (U57075), Photobacterium phosphoreum (Z19107), Pseudoalteromonas peptidysin (AF007286), Pseudomonas putida (L28676), Shewanella alga (X81622), Thiobacillus ferrooxidans (X75268), Vibrio marinus (X82142), and Xanthomonas campestris (L24791). Rhodospirillum rubrum (D30778) was used as the outgroup.
(iv) Phylogenetic trees.
Phylogenetic trees were constructed with programs of the PHYLIP package (version 3.573c) (21). For the distance matrix method, we used DNADIST with the Kimura two-parameter model (39) with a transition/transversion ratio of 2.0; phylogenetic trees were then constructed from evolutionary distances by the neighbor-joining method (66) implemented through the program NEIGHBOR. For the maximum-parsimony method, we used the program DNAPARS implemented in the PHYLIP software package. For the maximum-likelihood method (19), we used fastDNAml (version 1.1) (59). For a given input file, the sequence order was jumbled a maximum of 10 times until the best tree was found twice. A total of 100 bootstrapped replicate resampling data sets were generated for each of the three analysis methods (20). The bootstrapped values indicated the resampling percentages that supported a specific branching pattern. The consensus trees were determined with the CONSENSE program. Only topologies that were found to be similar by all three methods were used. The convergence of the results of all three methods on a single topology provided a very strong indication that the correct phylogeny was determined (35, 38).
Nucleotide sequence accession numbers.
The 16S rDNA sequences determined in this study have been deposited in the GenBank database under accession no. AF177545 to AF177569.
RESULTS
ARDRA and bacterial community analyses.
A total of 12 clone libraries of 16S rDNA were constructed, one for each of the six different types of surface and the two incubation periods for each surface. A total of 916 clones were screened, and 735 of these clones contained an insert of the proper size. The diversity of the recovered 16S rDNA PCR fragments in our libraries was examined by comparative ARDRA (Tables 1 and 2). These libraries had percent coverage values ranging from 30 to 80% and encompassed substantial diversity. A total of 136 OTUs were identified by ARDRA for the 12 libraries; 93 of these OTUs occurred in only one library, while 26 OTUs occurred in at least three libraries from different types of surface. We obtained a number of clones that represented organisms which colonized most of the test surfaces within 24 h (clones D001, D002, D003, D004, D005, D009, D013, DC015, D029, and D031). Some of these clones were still obtained after 72 h of incubation (clones D001, D002, D005, D009, and D013), while others were no longer present in the assemblages (clones D015, D029, and D031). For each test surface there were also a number of OTUs that were recovered only from that surface. The PU-24 library (the control) was especially diverse.
TABLE 1.
Distribution of OTUs in the 12 16S rDNA clonal libraries
| OTU(s) | Frequency ona:
|
|||||||||||
|---|---|---|---|---|---|---|---|---|---|---|---|---|
| PVA
|
BR
|
PEG-S
|
PEG-L
|
PEG-M
|
PU
|
|||||||
| 24 h | 72 h | 24 h | 72 h | 24 h | 72 h | 24 h | 72 h | 24 h | 72 h | 24 h | 72 h | |
| D001 | 34.6 | 5.3 | 33.7 | 3.6 | 10.8 | 3.4 | 23.3 | 30.8 | 18.0 | 13.0 | ||
| D002 | 3.9 | 5.3 | 3.6 | 1.8 | 3.1 | 38.1 | 15.0 | 24.2 | 11.5 | 16.1 | 2.0 | 7.4 |
| D003 | 5.8 | 8.8 | 6.0 | 7.3 | 3.1 | 3.4 | 13.1 | 1.9 | 4.0 | |||
| D004 | 3.9 | 3.5 | 2.4 | 12.7 | 7.7 | 6.0 | 10.0 | 4.6 | 8.9 | 6.0 | 9.3 | |
| D005 | 13.5 | 21.1 | 8.4 | 21.8 | 6.2 | 10.7 | 5.0 | 13.6 | 19.6 | 2.0 | 11.1 | |
| D006 | 1.8 | 1.5 | 5.0 | 1.5 | 1.8 | 2.0 | ||||||
| D007 | 5.0 | |||||||||||
| D008 | 3.3 | |||||||||||
| D009 | 5.8 | 1.2 | 3.6 | 12.3 | 14.3 | 3.3 | 22.7 | 9.6 | 3.6 | 5.6 | ||
| D010 | 11.5 | 5.3 | 4.8 | 9.1 | 1.5 | 4.8 | 3.3 | 1.5 | 3.6 | 4.0 | ||
| D011 | 1.5 | 1.7 | ||||||||||
| D012 | 3.1 | 1.7 | 1.5 | |||||||||
| D013 | 1.9 | 1.8 | 1.2 | 3.6 | 4.6 | 1.2 | 1.7 | 4.6 | 3.9 | 16.0 | ||
| D014 | 1.8 | 1.5 | 1.7 | 1.9 | ||||||||
| D015 | 5.8 | 2.4 | 1.8 | 1.5 | 1.7 | 1.9 | 4.0 | |||||
| D016 | 3.6 | 3.4 | 1.7 | 1.9 | 10.7 | |||||||
| D017 | 1.8 | 1.7 | 1.5 | 3.9 | ||||||||
| D018 | 1.9 | 1.8 | 1.7 | |||||||||
| D019 | 4.8 | 1.5 | 1.9 | 1.8 | 3.7 | |||||||
| D020 | 2.4 | |||||||||||
| D021 | 2.4 | 1.9 | 1.9 | |||||||||
| D022 | 1.2 | |||||||||||
| D023 | 1.2 | 1.5 | 1.2 | |||||||||
| D024 | 1.2 | 1.5 | 2.0 | 1.9 | ||||||||
| D025 | 1.8 | 1.2 | 1.2 | 5.4 | 4.0 | |||||||
| D026 | 3.6 | |||||||||||
| D027, D073, D074 | 1.8 | |||||||||||
| D028 | 5.5 | 4.6 | 1.9 | 1.8 | 2.0 | |||||||
| D029 | 3.9 | 1.5 | 2.0 | |||||||||
| D030 | 1.9 | 5.3 | 1.8 | 1.5 | 2.0 | |||||||
| D031 | 1.9 | 4.6 | 1.9 | |||||||||
| D032 | 1.9 | |||||||||||
| D033 | 1.9 | 3.6 | 2.0 | |||||||||
| D034 | 4.6 | |||||||||||
| D035, D038 | 3.0 | |||||||||||
| D036, D039, D041 | 1.5 | |||||||||||
| D037 | 1.8 | 1.5 | ||||||||||
| D040 | 1.5 | 2.0 | 1.9 | |||||||||
| D042 | 1.8 | 1.5 | 1.5 | 9.3 | ||||||||
| D043 | 7.0 | 1.5 | ||||||||||
| D044 | 5.3 | |||||||||||
| D045 | 3.5 | 1.8 | ||||||||||
| D046, D047 | 3.5 | |||||||||||
| D048, D050–D054 | 1.8 | |||||||||||
| D049 | 1.8 | 1.9 | 3.7 | |||||||||
| D055 | 3.6 | 3.1 | ||||||||||
| D056, D057, D060, D135 | 2.4 | |||||||||||
| D058, D059, D061–D071, D128–D130 | 1.2 | |||||||||||
| D072 | 1.5 | 1.8 | ||||||||||
| D075 | 3.1 | |||||||||||
| D076 | 1.5 | 1.9 | ||||||||||
| D077–079 | 1.5 | |||||||||||
| D080 | 1.8 | 3.1 | ||||||||||
| D081–D088, D090–D093, D095–D097 | 1.9 | |||||||||||
| D089 | 1.9 | 1.9 | ||||||||||
| D094 | 1.5 | 1.9 | 1.9 | |||||||||
| D098, D099, D102 | 1.8 | |||||||||||
| D100, D103 | 1.8 | 1.9 | ||||||||||
| D101 | 3.6 | |||||||||||
| D104, D105 | 3.9 | |||||||||||
| D106–D108, D136 | 1.9 | |||||||||||
| D109–D115, D117–D125, D127 | 2.0 | |||||||||||
| D116 | 4.0 | |||||||||||
| D126 | 1.5 | 2.0 | ||||||||||
| D131 | 1.2 | 1.5 | 2.0 | |||||||||
| D132–134 | 1.5 | |||||||||||
Frequency (F) was calculated as follows: F = (m/N) × 100, where m is the number of clones having the same ARDRA pattern in a library and N is the total number of clones in the same library.
TABLE 2.
Analysis of clonal libraries constructed for six surfaces and two incubation periods (24 and 72 h)
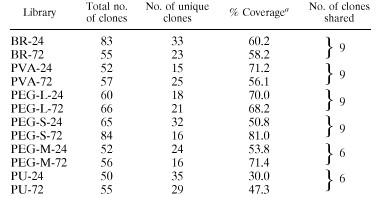 |
Percent coverage was calculated as follows: [1 − (n/N)] × 100, where n is the number of unique clones and N is the total number of clones.
Bacterial community successional changes were observed with all six surface types (Tables 1 and 2). Libraries that were obtained from the same surface type but after different incubation periods typically shared only six to nine OTUs, which accounted for 17% (in the PU-24 library) to 60% (in the PVA-24 library) of the OTUs recovered in our individual libraries.
Bacterial community structure was further analyzed by performing cluster analyses of the frequency data shown in Table 1 (excluding the data for clone D094, which was a chimera). The raw data were log transformed to minimize the effect of preferential PCR amplification on the cluster analyses, as several studies have shown that preferential amplification of some specific sequence(s) occurs with heterogeneous DNA samples (63, 68, 73). Cluster analyses performed by using the hierarchical (Fig. 1) and k-means (data not shown) clustering methods resulted in the same cluster pattern. There were two distinct clusters for the 12 libraries. Most 72-h libraries grouped together; the only exceptions were the BR-72 and PVA-72 libraries, which clustered with the 24-h libraries. Also, most of the 24-h libraries clustered together; the only exception was the PEG-M-24 library, which clustered with the 72-h group. This analysis demonstrated that successional changes occurred in the bacterial communities on most of the surfaces. It also suggested that succession on BR and PVA surfaces was delayed compared to succession on other types of surfaces and that succession on PEG-M surfaces was accelerated compared to succession on other types of surfaces.
FIG. 1.

Dendrogram resulting from a hierarchical clustering analysis of the bacterial community structures of the 12 clonal libraries constructed with Ward linkages.
16S rDNA sequence analysis.
Clones that occurred on at least three different types of surfaces (a total of 26 clones) were selected for sequence analysis, and partial 16S rRNA gene sequences were determined. The clones used included all of the most abundant OTUs in our libraries (Table 1) and accounted for 79% of the clones that had the correct insert size. The sequences were approximately 585 nucleotides long and spanned the V3 and V5 hypervariable regions of the 16S rDNA. They were aligned, and their phylogenetic positions relative to known sequences were determined. Phylogenetic analyses based on alignment data were supplemented with secondary-structure and signature nucleotide analyses (34 consensus positions for members of the Bacteria and 26 consensus positions for members of the α-Proteobacteria), and the results were consistent with the phylogenetic positions determined by the phylogenetic tree construction methods. Based on secondary structure, only one chimera (clone D094) was definitively identified, although some other sequences were possibly chimeric based on results obtained with the CHECK_CHIMERA program. All sequences were quite similar (levels of similarity, ≥96%) to sequences in the GenBank database, but none was identical to any 16S rDNA sequence of a cultured organism or an environmental clone available from RDP-II or GenBank.
Phylogenetic analyses that included representatives of numerous bacterial phyla and all proteobacterial subdivisions (data not shown) indicated that almost all of the sequences were sequences of members of the α-Proteobacteria; the only exceptions were clones D029 and D031, which belonged to the γ-Proteobacteria, and clone D042, which was related to members of the Cyanobacteria and chloroplasts. More detailed analyses were performed by using sequences of members of the α-Proteobacteria and γ-Proteobacteria.
(i) Sequences of members of the α-Proteobacteria.
In general, the results obtained by using the distance, parsimony, and likelihood methods were highly congruent. The clusters of known taxa and the positions of our clones in relation to known taxa were similar for three methods used, although the branching orders sometimes differed slightly. The results obtained with all three phylogenetic analysis methods supported placing the clones in the α-3 subgroup of the α-Proteobacteria (data not shown). More specifically, our clones fell into the Roseobacter subgroup (RDP-II designation 2.28.1.8.1.1) of the Rhodobacter group (RDP-II designation 2.28.1.8.1) (Fig. 2).
FIG. 2.

Phylogenetic tree showing the relationships among the 22 cloned sequences in the Rhodobacter group. The tree was constructed by using the maximum-parsimony method. The distancnes represent the numbers of nucleotide substitutions per homologous sequence site. Percentages of 100 bootstrap resamplings in the maximum-parsimony analysis are shown above nodes, and bootstrap values that supported certain cluster patterns generated by neighbor-joining analysis (to the left of the vertical line) and maximum-likelihood analysis (to the right of the vertical line) are shown below nodes. Bootstrap values less than 50% are not shown.
All of the cloned sequences that fell in the α-Proteobacteria were quite similar to one another, with similarity values ranging from 95.5 to 100%. The co-occurrence of closely related sequences is common in phylogenetic studies of naturally occurring bacterial communities (24, 26, 44), and the degrees of relatedness among some of the sequences may represent variation between 16S rRNA genes in different rRNA operons within the same cell, clonal variation within a population, or species differentiation (55).
(ii) Sequences of members of the γ-Proteobacteria.
The results obtained by using the distance, parsimony, and likelihood methods were also highly congruent for members of the γ-Proteobacteria. The results obtained with all three phylogenetic analysis methods supported placing two clones, D029 and D031, in the γ-3 subgroup of the γ-Proteobacteria. More specifically, our clones fell into the Alteromonas group (RDP-II designation 2.28.3.19) (data not shown).
DISCUSSION
The early stages of colonization and the succession of bacterial assemblages on human dental surfaces are well documented. It is clear from numerous studies that primary colonists recognize and specifically bind to components of the dental surface conditioning film and that once established, these organisms facilitate subsequent recruitment of many additional bacterial species. In contrast, little progress has been made in defining the early stages of colonization of surfaces in natural aquatic environments. This is due in part to the limitations of the traditional cultivation-based methods used to study aquatic microbial communities. It is well known that the majority (typically, ≥95%) of bacteria in nature cannot be cultivated by using traditional techniques (3, 8). Consequently, it is unlikely that collections of bacterial isolates are sufficiently representative of in situ diversity and ecophysiology to permit meaningful analysis of community structure or specific organism functions. In contrast, culture-independent techniques that involve extraction of total community genomic DNA or RNA followed by amplification of 16S rDNA or 16S rRNA (58, 61) by PCR have revealed that the phylogenetic diversity in naturally occurring communities is immense (17, 26, 37, 44, 54, 74). These methods are also very useful for tracking the dynamics of natural bacterial communities, for defining successional stages of biofilm communities, and for identifying key organisms in biofilm development.
Grouping of 16S rDNA clones by ARDRA provided a useful, efficient way to examine the diversity of the microbial communities on submerged test surfaces and to reduce the number of clones that were analyzed further (71). Our data revealed substantial diversity in the 16S rDNA sequences recovered from surfaces incubated in coastal marine waters for only short periods of time. A total of 136 unique OTUs were identified, although the average percent coverage of the libraries was only about 60%. The control surface (PU-24) library was especially diverse, and the percent coverage for this surface was only 30%. The rapid colonization of the surfaces used and the diversity of organisms involved may be associated with specific ecological characteristics of salt marsh ecosystems and may reflect advantages inherent in surface colonization in such systems. In such environments, high loads of particulate matter are present year round (57). Much of the particulate load is detritus resulting from decay of Spartina alterniflora, the dominant macrophyte in the low marsh zones (69), and represents a resource base for microbial growth. Diverse, abundant particle- and surface-associated microorganisms may be the natural result of physiological adaptation to this environment.
Bacterial community structure comparisons in which cluster analyses were used revealed obvious bacterial community successional changes on most of our surfaces when the surfaces incubated for 24 and 72 h were compared. The results clearly showed that the early stages of surface colonization were very dynamic and involved a characteristic assemblage of organisms. This analysis also showed that the BR-72 and PVA-72 libraries grouped with the 24-h incubation libraries. This finding is interesting since it implies that the succession of bacterial communities on the BR and PVA surfaces was delayed, at least for a short time. The relative hydrophobicity of each of these surfaces may play an important role in the reduction of surface colonization by certain bacterial species, thus altering the rate or direction of the successional progression. Previous microscopic studies of bacterial colonization on surfaces incubated in laboratory mesocosms showed that after 24 or 72 h of incubation the numbers of bacteria attached to BR and PVA surfaces were also lower than the numbers of bacteria attached to other types of surfaces (Noble et al., Abstr. 98th Gen. Meet. Am. Soc. Microbiology 1998). Cluster analysis also showed that the PEG-M-24 library grouped with the 72-h incubation group. This implies that succession of the bacterial community on the PEG-M surface was accelerated. This finding is consistent with the data of Wiencek and Fletcher (76), who found high numbers of bacteria attached to methyl-terminated alkanethiol self-assembled monolayers compared to the numbers of bacteria attached to hydroxyl-terminated self-assembled monolayers. Clearly, the degree of surface hydrophilicity or hydrophobicity and the specific surface chemical functional groups influence early stages of surface colonization. It is interesting that the PU-24 library (the control) was especially diverse, which may imply that some test surfaces may have an inhibitory or selective effect on colonization by some species, at least during the very early stages of biofilm development. However, microscopic examination revealed that there was no significant difference in the extents of biofouling on the different surface types after 1 week of incubation (Johnson et al., Abstr. 99th Gen. Meet. Am. Soc. Microbiol. 1999). Thus, it is not clear that consistent or important selection against specific colonizing species occurred on any of our test surfaces.
It is important to recognize that ARDRA of environmental clone libraries reflects the number of different 16S rRNA genes recovered from a sample but not the numbers of different kinds of organisms originally in the sample. In well-characterized bacterial species, the rRNA gene copy number varies from 1 to 14 copies per cell, and for groups of related organisms, the rRNA gene copy number can vary among species in a genus and even among strains in a species (18). Consequently, some distinguishable ARDRA patterns may be derived from the same organism. In addition, PCR-based methods for recovering 16S rDNA sequences from natural samples are subject to some important biases, particularly differential PCR amplification of DNA from heterogeneous templates (18, 63, 73). As a result of amplification biases, it is possible that the relative abundances of particular 16S rDNA sequences in clonal libraries may not accurately reflect the relative abundances of different organisms in the original sample. To minimize the impact of amplification biases on our analysis of bacterial succession on the test surfaces used and to normalize the representations of different clones among the different libraries, we log transformed the percent frequency data, as PCR is thought to be an exponential amplification process. Enumeration in PCR-based systems is problematic at best, so relative abundances (32) may be the most reliable descriptive parameter that can be obtained within the limits of current technology.
In addition to characterizing succession on the test surfaces by ARDRA, we also determined partial DNA sequences and phylogenetically analyzed the 26 OTUs that were most abundant and most common in our libraries. A total of 22 of these common OTUs were affiliated with the α-Proteobacteria, and all of these fell in the Roseobacter subgroup in the Rhodobacter group. The phylogenetic affiliation determined by using phylogenetic tree construction methods is also supported by a signature nucleotide sequence, characteristic of the Rhodobacter group, that is found in all 22 sequences (27). All of these sequences also exhibited fairly high pairwise levels of similarity. The sequences of clones D005 and D009 were identical in the region which we examined, but both the MspI digest band patterns and the HhaI digest band patterns were different. The sequence differences detected by ARDRA were clearly outside the region sequenced. Several other sequences had only three or four mismatched positions. As the error rate of the high-fidelity DNA polymerase which we used is only about 8.5 × 10⁻⁶, these differences were probably not due to PCR errors. Radiations of closely related bacterial populations that coexist in relatively circumscribed microenvironments have also been observed in other studies (1, 24, 26, 44). The significance of this apparently common phenomenon is not known; it could be the result of microevolutionary divergence within a multicopy rRNA gene family or the result of microscale adaptation as a result of selection (26, 51, 67). Bacteria belonging to the Roseobacter subgroup are abundant in coastal seawater, aerobic sediments, and decaying plant material from coastal salt marshes, and they may play important roles in biogeochemical processes, such as sulfur cycling (28, 30). Not only were the sequences which we determined obtained from most of the surfaces tested, they were also the most abundant sequences in both the 24-h libraries and the 72-h libraries. This suggests that the bacteria represented by these sequences are also important primary colonizers of surfaces in coastal waters.
Two of the sequences analyzed were affiliated with the γ-Proteobacteria, and both clustered with the Alteromonas group. Interestingly, both sequences were recovered from surfaces only after 24 h of incubation. These organisms may be involved only in very early colonization of submerged surfaces, and they may be displaced by members of the α-Proteobacteria during succession. The organisms most closely related to the two sequences, members of the genus Alteromonas, represent a rather isolated phylogenetic lineage (25). To date, only one Alteromonas species (with a few subspecies) has been described (6, 62). However, the genus Alteromonas has been implicated as an important genus in particle (or aggregate)-associated niches (1), and members of this genus may be significant surface colonists in coastal marine systems.
One of the most important problems encountered in PCR-based bacterial community analysis is the formation of chimeras. Only a single chimeric sequence was identified positively, although the CHECK_CHIMERA program showed that chimeras may have been formed for some additional sequences. The results of 16S rRNA secondary-structure and signature nucleotide analyses (26, 33, 79) argued against these sequences actually being chimeric, although no method used to identify chimeras is foolproof (40, 64). The gentle genomic DNA extraction method employed (45) minimized fragmentation, which can greatly increase chimera formation during PCR (40, 72). All of the sequences analyzed were the most common sequences in our libraries, which were obtained from independent PCRs in which we used minimally sheared DNA and a high-fidelity DNA polymerase. It seems very unlikely that the same chimeric molecule was an abundant product in several independent PCR amplifications.
It is thought that at least some important ecophysiological traits are shared by phylogenetically closely related species (60, 79). If this is true, some key traits of our unknown organisms may be inferred from the traits of their closest evolutionary relatives. Almost all of the nearest relatives of our clones are organisms that live in marine environments. Most of these organisms are also surface-associated bacteria. Within the Rhodobacter group, both strains of Rugeria algicola were isolated from the surfaces of unicellular algae (i.e., the dinoflagellate Prorocentrum lima) (41). Sagittula stellata has a holdfast structure at one pole and is able to attach to the surface of a lignocellulose or cellulose particle, and it hydrolyzes and partially mineralizes cellulose and synthetic lignin (29). Rugeria atlanticum is a marine star-shaped-aggregate-forming bacterium (65). Clone Hstp14 was recovered from an unknown microorganism obtained from the leaves of the seagrass Halophila stipulacea (75). In addition, Alteromonas macleodii subsp. fijiensis can produce copious extracellular polysaccharides under certain conditions (62), which may contribute to its ability to colonize surfaces. All of the previously described organisms mentioned above are chemoheterotrophs and require NaCl for growth. Thus, all available phylogenetic and inferred phenotypic information suggests that our cloned sequences come from true marine surface-associated microorganisms. The high relative abundances of the Roseobacter subgroup sequences in libraries constructed from several different types of surfaces, the high degrees of phylogenetic relatedness, and the universality of surface association in closely related organisms all support our identification of these organisms as important primary surface colonists in coastal marine water. In future studies we will determine the in situ abundances of these organisms in the water column and on particles and surfaces, their interactions with other surface-associated microorganisms, and their participation in biofilm formation.
ACKNOWLEDGMENTS
We thank Steven Lindsay and James Tour for preparing the test surfaces, Wes R. Johnson and M. Caroline Roper for developing field techniques and for collecting samples, George Matsui and Christopher Bagwell for providing technical advice, and Peter A. Noble and C. Bagwell for providing helpful comments on the manuscript.
This research was supported by grant N00014-97-1-0806 from the Office of Naval Research to C.R.L.
REFERENCES
- 1.Acinas S G, Antón J, Rodríguez-Valera F. Diversity of free-living and attached bacteria in offshore western Mediterranean waters as depicted by analysis of genes encoding 16S rRNA. Appl Environ Microbiol. 1999;65:514–522. doi: 10.1128/aem.65.2.514-522.1999. [DOI] [PMC free article] [PubMed] [Google Scholar]
- 2.Altschul S, Madden T L, Schaffer A A, Zhang J, Zhang Z, Miller W, Lipman D J. Gapped BLAST and PSI-BLAST: a new generation of protein database search programs. Nucleic Acids Res. 1997;25:3389–3402. doi: 10.1093/nar/25.17.3389. [DOI] [PMC free article] [PubMed] [Google Scholar]
- 3.Amann R I, Ludwig W, Schleifer K-H. Phylogenetic identification and in situ detection of individual microbial cells without cultivation. Microbiol Rev. 1995;59:143–169. doi: 10.1128/mr.59.1.143-169.1995. [DOI] [PMC free article] [PubMed] [Google Scholar]
- 4.Ausubel F M, Brent R, Kingston R E, Moore D D, Seidman J G, Smith J A, Struhl K. Current protocols in molecular biology. New York, N.Y: John Wiley & Sons, Inc.; 1987. [Google Scholar]
- 5.Baier R E, Shafrin E G, Zisman W A. Adhesion. Mechanisms that assist or impede it. Science. 1968;162:1360–1368. doi: 10.1126/science.162.3860.1360. [DOI] [PubMed] [Google Scholar]
- 6.Baumann L, Baumann P, Mandel M, Allen R D. Taxonomy of aerobic marine eubacteria. J Bacteriol. 1972;110:402–429. doi: 10.1128/jb.110.1.402-429.1972. [DOI] [PMC free article] [PubMed] [Google Scholar]
- 7.Bos R, van der Mei H C, Busscher H J. Physico-chemistry of initial microbial adhesive interactions—its mechanisms and methods for study. FEMS Microbiol Rev. 1999;23:179–230. doi: 10.1111/j.1574-6976.1999.tb00396.x. [DOI] [PubMed] [Google Scholar]
- 8.Brock T D. The study of microorganisms in situ: progress and problems. Symp Soc Gen Microbiol. 1987;41:1–17. [Google Scholar]
- 9.Bultel-Ponce V, Debitus C, Berge J-P, Cerceau C, Guyot M. Metabolites from the sponge-associated bacterium Micrococcus luteus. J Mar Biotechnol. 1998;6:233–236. [PubMed] [Google Scholar]
- 10.Busscher H J, Bos R, van der Mei H C. Initial microbial adhesion is a determinant for the strength of biofilm adhesion. FEMS Microbiol Lett. 1995;128:229–234. doi: 10.1111/j.1574-6968.1995.tb07529.x. [DOI] [PubMed] [Google Scholar]
- 11.Buswell C M, Herlihy Y M, Marsh P D, Keevil C W, Leach S A. Coaggregation amongst aquatic biofilm bacteria. J Appl Microbiol. 1997;83:477–484. [Google Scholar]
- 12.Characklis W G, McFeters G A, Marshall K C. Physiological ecology in biofilm systems. In: Characklis W G, Marshall K C, editors. Biofilms. New York, N.Y: John Wiley & Sons; 1990. pp. 341–394. [Google Scholar]
- 13.Cooksey K E, Wigglesworth-Cooksey B. Adhesion of bacteria and diatoms to surfaces in the sea—a review. Aquat Microb Ecol. 1995;9:87–96. [Google Scholar]
- 14.Costerton J W, Stewart P S, Greenberg E P. Bacterial biofilms: a common cause of persistent infections. Science. 1999;284:1318–1322. doi: 10.1126/science.284.5418.1318. [DOI] [PubMed] [Google Scholar]
- 15.Costerton J W, Lewandowski Z, Caldwell D E, Korber D R, Lappin-Scott H M. Microbial biofilms. Annu Rev Microbiol. 1995;49:711–745. doi: 10.1146/annurev.mi.49.100195.003431. [DOI] [PubMed] [Google Scholar]
- 16.Decho A W. Microbial exopolymer secretions in ocean environments: their role(s) in food webs and marine processes. Oceanogr Mar Biol Annu Rev. 1990;28:73–153. [Google Scholar]
- 17.DeLong E F, Franks D G, Alldredge A L. Phylogenetic diversity of aggregate-attached vs. free-living marine bacterial assemblages. Limnol Oceanogr. 1993;38:924–934. [Google Scholar]
- 18.Farrelly V, Rainey F A, Stackebrandt E. Effect of genome size and rrn gene copy number on PCR amplification of 16S rRNA genes from a mixture of bacterial species. Appl Environ Microbiol. 1995;61:2798–2801. doi: 10.1128/aem.61.7.2798-2801.1995. [DOI] [PMC free article] [PubMed] [Google Scholar]
- 19.Felsenstein J. Evolutionary trees from DNA sequences: a maximum likelihood approach. J Mol Evol. 1981;17:368–376. doi: 10.1007/BF01734359. [DOI] [PubMed] [Google Scholar]
- 20.Felsenstein J. Confidence limits on phylogenies: an approach using the bootstrap. Evolution. 1985;39:783–791. doi: 10.1111/j.1558-5646.1985.tb00420.x. [DOI] [PubMed] [Google Scholar]
- 21.Felsenstein J. PHYLIP (Phylogeny Inference Package), version 3.5c. Seattle: Department of Genetics, University of Washington; 1993. [Google Scholar]
- 22.Flemming H C, Schaule G. Microbial deterioration of materials—biofilm and biofouling—biofouling. Werkst Korros. 1994;45:29–39. [Google Scholar]
- 23.Fletcher M. Bacterial attachment in aquatic environments: a diversity of surfaces and adhesion strategies. In: Fletcher M, editor. Bacterial adhesion: molecular and ecological diversity. New York, N.Y: Wiley-Liss; 1996. pp. 1–24. [Google Scholar]
- 24.Fuhrman J A, McCallum K, Davis A A. Phylogenetic diversity of subsurface marine microbial communities from Atlantic and Pacific oceans. Appl Environ Microbiol. 1993;59:1294–1302. doi: 10.1128/aem.59.5.1294-1302.1993. [DOI] [PMC free article] [PubMed] [Google Scholar]
- 25.Gauthier G, Gauthier M, Christen R. Phylogenetic analysis of the genera Alteromonas, Shewanella, and Moritella using genes coding for small-subunit rRNA sequences and division of the genus Alteromonas into two genera, Alteromonas (emended) and Pseudoalteromonas gen. nov., and proposal of twelve new species combinations. Int J Syst Bacteriol. 1995;45:755–761. doi: 10.1099/00207713-45-4-755. [DOI] [PubMed] [Google Scholar]
- 26.Giovannoni S J, Britschgi T B, Moyer C L, Field K G. Genetic diversity in Sargasso Sea bacterioplankton. Nature. 1990;345:60–63. doi: 10.1038/345060a0. [DOI] [PubMed] [Google Scholar]
- 27.Giuliano L, De Domenico M, De Domenico E, Höfle M G, Yakimov M M. Identification of culturable oligotrophic bacteria within naturally occurring bacterioplankton communities of the Ligurian Sea by 16S rRNA sequencing and probing. Microb Ecol. 1999;37:77–85. doi: 10.1007/s002489900132. [DOI] [PubMed] [Google Scholar]
- 28.González J M, Moran M A. Numerical dominance of a group of marine bacteria in the α-subclass of the class Proteobacteria in coastal seawater. Appl Environ Microbiol. 1997;63:4237–4242. doi: 10.1128/aem.63.11.4237-4242.1997. [DOI] [PMC free article] [PubMed] [Google Scholar]
- 29.González J M, Mayer F, Moran M A, Hodson R E, Whitman W B. Sagittula stellata gen. nov., sp. nov., a lignin-transforming bacterium from a coastal environment. Int J Syst Bacteriol. 1997;47:773–780. doi: 10.1099/00207713-47-3-773. [DOI] [PubMed] [Google Scholar]
- 30.González J M, Kiene R P, Moran M A. Transformation of sulfur compounds by an abundant lineage of marine bacteria in the α-subclass of the class Proteobacteria. Appl Environ Microbiol. 1999;65:3810–3819. doi: 10.1128/aem.65.9.3810-3819.1999. [DOI] [PMC free article] [PubMed] [Google Scholar]
- 31.Good I J. The population frequencies of species and the estimation of population parameters. Biometrica. 1953;40:237–264. [Google Scholar]
- 32.Gordon D A, Giovannoni S J. Detection of stratified microbial populations related to Chlorobium and Fibrobacter species in the Atlantic and Pacific oceans. Appl Environ Microbiol. 1996;62:1171–1177. doi: 10.1128/aem.62.4.1171-1177.1996. [DOI] [PMC free article] [PubMed] [Google Scholar]
- 33.Head I M, Saunders J R, Pickup R W. Microbial evolution, diversity, and ecology: a decade of ribosomal RNA analysis of uncultivated microorganisms. Microb Ecol. 1998;35:1–21. doi: 10.1007/s002489900056. [DOI] [PubMed] [Google Scholar]
- 34.Holmes D S, Quigley M. A rapid boiling method for the preparation of bacterial plasmids. Anal Biochem. 1981;114:193–197. doi: 10.1016/0003-2697(81)90473-5. [DOI] [PubMed] [Google Scholar]
- 35.Huelsenbeck J P, Hillis D M. Success of phylogenetic methods in the four-taxon case. Syst Biol. 1993;42:247–264. [Google Scholar]
- 36.Ista L K, Fan H Y, Baca O, Lopez G P. Attachment of bacteria to model solid surfaces: oligo(ethylene glycol) surfaces inhibit bacterial attachment. FEMS Microbiol Lett. 1996;142:59–63. doi: 10.1111/j.1574-6968.1996.tb08408.x. [DOI] [PubMed] [Google Scholar]
- 37.Johannes R, Wu K Y, Herndl G J, DeLong E F. High phylogenetic diversity in a marine-snow-associated bacterial assemblage. Aquat Microb Ecol. 1998;14:261–269. [Google Scholar]
- 38.Kim J. Improving the accuracy of phylogenetic estimation by combining different methods. Syst Biol. 1993;42:331–340. [Google Scholar]
- 39.Kimura M. A simple method for estimating evolutionary rate of base substitutions through comparative studies of nucleotide sequences. J Mol Evol. 1980;16:111–120. doi: 10.1007/BF01731581. [DOI] [PubMed] [Google Scholar]
- 40.Kopczynski E D, Bateson M M, Ward D M. Recognition of chimeric small-subunit ribosomal DNAs composed of genes from uncultivated microorganisms. Appl Environ Microbiol. 1994;60:746–748. doi: 10.1128/aem.60.2.746-748.1994. [DOI] [PMC free article] [PubMed] [Google Scholar]
- 41.Lafay B, Ruimy R, Rausch de Traubenberg C, Breittmayer V, Gauthier M J, Christen R. Roseobacter algicola sp. nov., a new marine bacterium isolated from the phycosphere of the toxin-producing dinoflagellate Prorocentrum lima. Int J Syst Bacteriol. 1995;45:290–296. doi: 10.1099/00207713-45-2-290. [DOI] [PubMed] [Google Scholar]
- 42.Lane D J. 16S/23S rRNA sequencing. In: Stackebrandt E, Goodfellow M, editors. Nucleic acid techniques in bacterial systematics. Chichester, United Kingdom: John Wiley & Sons; 1991. pp. 115–175. [Google Scholar]
- 43.Lappin-Scott H M, Costerton J M. Bacterial biofilms and surface fouling. Biofouling. 1989;1:323–342. [Google Scholar]
- 44.Liesack W, Stackebrandt E. Occurrence of novel groups of the domain Bacteria as revealed by analysis of genetic material isolated from an Australian terrestrial environment. J Bacteriol. 1992;174:5072–5078. doi: 10.1128/jb.174.15.5072-5078.1992. [DOI] [PMC free article] [PubMed] [Google Scholar]
- 45.Lovell C R, Piceno Y. Purification of DNA from estuarine sediments. J Microbiol Methods. 1994;20:161–174. [Google Scholar]
- 46.Maidak B L, Cole J R, Parker C T, Jr, Garrity G M, Larsen N, Li B, Lilburn T G, McCaughey M J, Olsen G J, Overbeek R, Pramanik S, Schmidt T M, Tiedje J M, Woese C R. A new version of the RDP (Ribosomal Database Project) Nucleic Acids Res. 1999;27:171–173. doi: 10.1093/nar/27.1.171. [DOI] [PMC free article] [PubMed] [Google Scholar]
- 47.Marchesi J R, Sato T, Weightman A J, Martin T A, Fry J C, Hiom S J, Dymock D, Wade W G. Design and evaluation of useful bacterium-specific PCR primers that amplify genes coding for bacterial 16S rRNA. Appl Environ Microbiol. 1998;64:795–799. doi: 10.1128/aem.64.2.795-799.1998. [DOI] [PMC free article] [PubMed] [Google Scholar]
- 48.Marshall K C. Mechanisms of bacterial adhesion at solid-water interfaces. In: Savage D C, Fletcher M, editors. Bacterial adhesion. New York, N.Y: Plenum Press; 1985. pp. 133–161. [Google Scholar]
- 49.Marshall K C. Biofilms: an overview of bacterial adhesion, activity, and control at surfaces. ASM News. 1992;58:202–207. [Google Scholar]
- 50.Massol-Deya A, Weller R, Rios-Hernandez L, Zhou J Z, Hickey R F, Tiedje J M. Succession and convergence of biofilm communities in fixed-film reactors treating aromatic hydrocarbons in groundwater. Appl Environ Microbiol. 1997;63:270–276. doi: 10.1128/aem.63.1.270-276.1997. [DOI] [PMC free article] [PubMed] [Google Scholar]
- 51.McArthur J V, Kovacic D A, Smith M H. Genetic diversity in natural populations of a soil bacterium across a landscape gradient. Proc Natl Acad Sci USA. 1988;85:9621–9624. doi: 10.1073/pnas.85.24.9621. [DOI] [PMC free article] [PubMed] [Google Scholar]
- 52.Meyer Reil L A. Microbial life in sedimentary biofilms—the challenge to microbial ecologists. Mar Ecol Prog Ser. 1994;112:303–311. [Google Scholar]
- 53.Moller S, Sternberg C, Andersen J B, Christensen B B, Ramos J L, Givskov M, Molin S. In situ gene expression in mixed-culture biofilms: evidence of metabolic interactions between community members. Appl Environ Microbiol. 1998;64:721–732. doi: 10.1128/aem.64.2.721-732.1998. [DOI] [PMC free article] [PubMed] [Google Scholar]
- 54.Moyer C L, Dobbs F C, Karl D M. Estimation of diversity and community structure through restriction fragment length polymorphism distribution analysis of bacterial 16S rRNA genes from a microbial mat at an active, hydrothermal vent system. Loihi Seamount, Hawaii. Appl Environ Microbiol. 1994;60:871–879. doi: 10.1128/aem.60.3.871-879.1994. [DOI] [PMC free article] [PubMed] [Google Scholar]
- 55.Mullins T D, Britschgi T B, Krest R L, Giovannoni S J. Genetic comparisons reveal the same unknown bacterial lineages in Atlantic and Pacific bacterioplankton communities. Limnol Oceanogr. 1995;40:148–158. [Google Scholar]
- 56.Neefs J-M, Van de Peer Y, Hendriks L, De Wachter R. Compilation of small ribosomal subunit RNA sequences. Nucleic Acids Res. 1990;18:2237–2317. doi: 10.1093/nar/18.suppl.2237. [DOI] [PMC free article] [PubMed] [Google Scholar]
- 57.Odum E P, de la Cruz A A. Particulate organic detritus in a Georgia salt marsh-estuarine ecosystem. In: Lauff G H, editor. Estuaries. AAAS Publication 83. Washington, D.C.: American Association for the Advancement of Science; 1967. pp. 383–388. [Google Scholar]
- 58.Olsen G J, Lane D J, Giovannoni S J, Pace N R. Microbial ecology and evolution: a ribosomal RNA approach. Annu Rev Microbiol. 1986;40:337–365. doi: 10.1146/annurev.mi.40.100186.002005. [DOI] [PubMed] [Google Scholar]
- 59.Olsen G J, Matsuda H, Hagstrom R, Overbeek R. FastDNAml: a tool for construction of phylogenetic trees of DNA sequences using maximum likelihood. Comput Appl Biosci. 1994;10:41–48. doi: 10.1093/bioinformatics/10.1.41. [DOI] [PubMed] [Google Scholar]
- 60.Pace N R. New perspective on the natural microbial world: molecular microbial ecology. ASM News. 1996;62:463–470. [Google Scholar]
- 61.Pace N R, Stahl D A, Lane D J, Olsen G J. The analysis of natural microbial communities by ribosomal RNA sequences. Microb Ecol. 1986;9:1–55. [Google Scholar]
- 62.Raguenes G, Pignet P, Gauthier G, Peres A, Christen R, Rougeaux H, Barbier G, Guezennec J. Description of a new polymer-secreting bacterium from a deep-sea hydrothermal vent, Alteromonas macleodii subsp. fijiensis, and preliminary characterization of the polymer. Appl Environ Microbiol. 1996;62:67–73. doi: 10.1128/aem.62.1.67-73.1996. [DOI] [PMC free article] [PubMed] [Google Scholar]
- 63.Reysenbach A, Giver J L, Wickham G S, Pace N R. Differential amplification of rRNA genes by polymerase chain reaction. Appl Environ Microbiol. 1992;58:3417–3418. doi: 10.1128/aem.58.10.3417-3418.1992. [DOI] [PMC free article] [PubMed] [Google Scholar]
- 64.Robison-Cox J F, Bateson M M, Ward D M. Evaluation of nearest-neighbor methods for detection of chimeric small-subunit rRNA sequences. Appl Environ Microbiol. 1995;61:1240–1245. doi: 10.1128/aem.61.4.1240-1245.1995. [DOI] [PMC free article] [PubMed] [Google Scholar]
- 65.Ruger H J, Hofle M G. Marine star-shaped-aggregate-forming bacteria: Agrobacterium atlanticum sp. nov.; Agrobacterium meteori sp. nov.; Agrobacterium ferrugineum sp. nov., nom. rev.; Agrobacterium gelatinovorum sp. nov., nom. rev.; and Agrobacterium stellulatum sp. nov., nom. rev. Int J Syst Bacteriol. 1992;42:133–143. doi: 10.1099/00207713-42-1-133. [DOI] [PubMed] [Google Scholar]
- 66.Saitou N, Nei M. The neighbor-joining method: a new method for reconstructing phylogenetic trees. Mol Biol Evol. 1987;4:406–425. doi: 10.1093/oxfordjournals.molbev.a040454. [DOI] [PubMed] [Google Scholar]
- 67.Sogin M L, Pechman K J, Zablen L, Lewis B J, Woese C R. Observations on the post-transcriptionally modified nucleotides in the 16S ribosomal ribonucleic acid. J Bacteriol. 1972;112:13–22. doi: 10.1128/jb.112.1.13-16.1972. [DOI] [PMC free article] [PubMed] [Google Scholar]
- 68.Suzuki M T, Giovannoni S J. Bias caused by template annealing in the amplification of mixtures of 16S rRNA genes by PCR. Appl Environ Microbiol. 1996;62:625–630. doi: 10.1128/aem.62.2.625-630.1996. [DOI] [PMC free article] [PubMed] [Google Scholar]
- 69.Teal J M. Energy flow in the salt marsh ecosystem of Georgia. Ecology. 1962;43:614–624. [Google Scholar]
- 70.Thompson J D, Higgins D G, Gibson T J. CLUSTAL W: improving the sensitivity of progressive multiple sequence alignment through sequence weighting, position-specific gap penalties and weight matrix choice. Nucleic Acids Res. 1994;22:4673–4680. doi: 10.1093/nar/22.22.4673. [DOI] [PMC free article] [PubMed] [Google Scholar]
- 71.Vaneechoutte M, Rossau R, De Vos P, Gillis M, Janssens D, Paepe N, De Rouck A, Fiers T, Claeys G, Kersters K. Rapid identification of bacteria of the Comamonadaceae with amplified ribosomal DNA-restriction analysis (ARDRA) FEMS Microbiol Lett. 1992;93:227–234. doi: 10.1111/j.1574-6968.1992.tb05102.x. [DOI] [PubMed] [Google Scholar]
- 72.Wang G C, Wang Y. Frequency of formation of chimeric molecules as a consequence of PCR coamplification of 16S rRNA genes from mixed bacterial genomes. Appl Environ Microbiol. 1997;63:4645–4650. doi: 10.1128/aem.63.12.4645-4650.1997. [DOI] [PMC free article] [PubMed] [Google Scholar]
- 73.Ward D M, Bateston M M, Weller R, Ruff-Roberts A L. Ribosomal RNA analysis of microorganisms as they occur in nature. Adv Microb Ecol. 1992;12:219–286. [Google Scholar]
- 74.Ward D M, Weller R, Bateson M M. 16S rRNA sequences reveal uncultured inhabitants of a well-studied thermal community. FEMS Microbiol Rev. 1990;75:105–116. doi: 10.1111/j.1574-6968.1990.tb04088.x. [DOI] [PubMed] [Google Scholar]
- 75.Weidner S, Arnold W, Puhler A. Diversity of uncultured microorganisms associated with the seagrass Halophila stipulacea estimated by restriction fragment length polymorphism analysis of PCR-amplified 16S rRNA genes. Appl Environ Microbiol. 1996;62:766–771. doi: 10.1128/aem.62.3.766-771.1996. [DOI] [PMC free article] [PubMed] [Google Scholar]
- 76.Wiencek K M, Fletcher M. Bacterial adhesion to hydroxyl- and methyl-terminated alkanethiol self-assembled monolayers. J Bacteriol. 1995;177:1959–1966. doi: 10.1128/jb.177.8.1959-1966.1995. [DOI] [PMC free article] [PubMed] [Google Scholar]
- 77.Wiencek K M, Fletcher M. Effects of substratum wettability and molecular topography on the initial adhesion of bacteria to chemically defined substrata. Biofouling. 1997;11:293–311. [Google Scholar]
- 78.Wimpenny J. Ecological determinants of biofilm formation. Biofouling. 1996;10:43–63. doi: 10.1080/08927019609386270. [DOI] [PubMed] [Google Scholar]
- 79.Woese C R. Bacterial evolution. Microbiol Rev. 1987;51:221–271. doi: 10.1128/mr.51.2.221-271.1987. [DOI] [PMC free article] [PubMed] [Google Scholar]
- 80.Wolfaardt G M, Lawrence J R, Robarts R D, Caldwell S J, Caldwell D E. Multicellular organization in a degradative biofilm community. Appl Environ Microbiol. 1994;60:434–446. doi: 10.1128/aem.60.2.434-446.1994. [DOI] [PMC free article] [PubMed] [Google Scholar]
- 81.Zhang T C, Fu Y C, Bishop P L. Competition in biofilms. Water Sci Technol. 1994;29:263–270. [Google Scholar]