Abstract
Objective: We developed a risk model based on pyroptosis-related long non-coding RNAs (lncRNAs) and assessed its prognostic value and clinical significance in breast cancer (BRCA). Methods: BRCA RNA sequencing data with corresponding clinical information were retrieved from The Cancer Genome Atlas (TCGA) database. Univariate Cox regression analysis was used to examine correlations between prognosis of BRCA patients and the expression levels of pyroptosis-related lncRNAs. A prognostic model was developed and validated by identifying the correlation of risk scores with tumor immune infiltration and immune cell function through immune response analysis. Functional analyses of focal dysfunction-related lncRNA were also carried out. Lastly, single sample gene set enrichment analysis (ssGSEA) was conducted to determine the differences in immune responses between the low- and high-risk groups. Results: We divided the TCGA-BRCA dataset into 3 clusters by consensus clustering, and identified 11 pyroptosis-related lncRNAs that are differentially expressed between tumors and normal tissues. In addition, we determined if PD-L1 expression is associated with clustering and gene expression. The list was further narrowed down to eight pyroptosis-related lncRNAs and their regression coefficients were obtained through LASSO regression analysis. The relative proportion of 22 different immune cells in the BRCA microenvironment was determined using the CIBERSORT algorithm to explore the indicative effects of risk score on the tumor microenvironment (TME). We found that the resting mast cells, M0, and M2 macrophages were positively correlated with the risk scores. Conclusion: The potential role of pyroptosis-related lncRNAs in BRCA prognosis may be exploited as a treatment target for patients with BRCA.
Keywords: BRCA, pyroptosis, lncRNA, tumor microenvironment, immune checkpoint
Introduction
Breast cancer has surpassed lung cancer as the most extensive and persistent tumor in women, with approximately 2.3 million new cases in 2020. It has become the fifth major contributor to cancer-related mortality worldwide, with approximately 685,000 casualties every year [1]. Although the diagnostic techniques and treatment for BRCA have significantly improved in recent years, the overall survival rate of BRCA patients remains dissatisfactory. Hence, optimizing techniques for the diagnosis, treatment, and prediction of BRCA prognosis are necessary.
Pyroptosis, a recently identified type of programmed cell death, is characterized by continuous cell membrane expansion which results in the rupture and eventual discharge of cell contents as well as the activation of inflammatory responses [2]. There are two pathways of pyroptosis, the classical and the non-classical ones [3]. Pyroptosis can be activated by either caspase-1-dependent or independent inflammasomes. In both mechanisms, the inflammasomes associates with disconnected gasdermins (GSDMs) using free N-terminal peptides and induce the cell membrane cleavage and subsequent release of cytoplasmic components. GSDM-mediated pyroptosis relies on the innate immune response to antagonize pathogen infection [4,5]. Existing literature shows that Granzyme B (GZMB), a cytotoxic granzyme, can directly cleave GSDME and activate cancer cell pyroptosis, subsequently activating the anti-tumor immune response and inhibiting tumor growth [6]. Furthermore, higher levels of GSDMB expression were correlated with higher metastasis and lower rates of survival in BRCA patients. Recent studies have confirmed that intracellular delivery of GSDMB inhibitors in BRCA effectively reduce GSDMB function in migration, metastasis, and drug resistance of cancer cells, providing a new targeted therapeutic strategy for HER2-positive BRCA patients [7].
Long non-coding RNAs (lncRNAs) belong to a class of RNAs which are over 200 nucleotides in length and are not translated into proteins. LncRNAs rely primarily on post-transcriptional modifications to participate in epigenetic regulation, particularly in cellular differentiation, and the regulation of tumor occurrence and progression [8]. lncRNAs might affect the sensitivity of BRCA cells to anthracycline and paclitaxel chemotherapeutic drugs [9,10]. Moreover, it has been shown that lncRNAs regulate the differentiation and functions of immune cells, including dendritic cells (DCs), T cells, and macrophages to cause the immune escape of tumor cells [11-13]. Additionally, lncRNAs also recruit a variety of immunosuppressive factors, affecting the tumor microenvironment, leading to immune escape [14-16].
In this study, we acquired the clinical and genetic data of 1,099 BRCA patients from the TCGA database. Subsequently, statistical methods were used to screen for 8 lncRNAs related to pyroptosis and to evaluate the correlations between the expression of lncRNAs and the prognosis and immune status of BRCA patients.
Materials and methods
Data acquisition
The mRNA sequencing and clinical data of 1,099 BRCA patients in a standardized FPKM format was obtained from the TCGA database (https://portal.gdccancer.gov/repository) with strict accordance to the data access regulations and release requirements of the database. From this dataset, we obtained a total of 27 pyroptosis-related genes (Table 1) using a molecular signature database (http://www.gsea-msigdb.org/gsea/).
Table 1.
Pyroptosis gene members
| Original Member | Gene Symbol | Gene Description |
|---|---|---|
| ENSG00000073282 | TP63 | Tumor protein p63 |
| ENSG00000083937 | CHMP2B | Charged multivesicular body protein |
| ENSG00000087088 | BAX | BCL2 associated X |
| ENSG00000100453 | GZMB | Granzyme B |
| ENSG00000101421 | CHMP4B | Charged multivesicular body protein |
| ENSG00000105928 | GSDME | Gasdermin E |
| ENSG00000115008 | IL1A | Interleukin 1 alpha |
| ENSG00000115561 | CHMP3 | Charged multivesicular body protein |
| ENSG00000125347 | IRF1 | Interferon regulatory factor 1 |
| ENSG00000125538 | IL1B | Interleukin 1 beta |
| ENSG00000130724 | CHMP2A | Charged multivesicular body protein |
| ENSG00000137752 | CASP1 | Caspase 1 |
| ENSG00000137757 | CASP5 | Caspase 5 |
| ENSG00000141510 | TP53 | Tumor protein p53 |
| ENSG00000147457 | CHMP7 | Charged multivesicular body protein |
| ENSG00000150782 | IL18 | Interleukin 18 |
| ENSG00000164305 | CASP3 | Caspase 3 |
| ENSG00000164695 | CHMP4C | Charged multivesicular body protein |
| ENSG00000168310 | IRF2 | Interferon regulatory factor 2 |
| ENSG00000172115 | CYCS | Cytochrome c, somatic |
| ENSG00000176108 | CHMP6 | Charged multivesicular body protein |
| ENSG00000189403 | HMGB1 | High mobility group box 1 |
| ENSG00000196954 | CASP4 | Caspase 4 |
| ENSG00000197561 | ELANE | Elastase, neutrophil expressed |
| ENSG00000254505 | CHMP4A | Charged multivesicular body protein |
| ENSG00000278718 | GSDMD | Gasdermin D |
| ENSG00000285302 | CHMP4A | Charged multivesicular body protein |
LncRNA screening and consensus clustering
To identify the target RNAs, we first screened 685 lncRNAs associated with 27 known pyroptosis-related genes (BAK1, BAX, CASP1, CASP3, CASP4, CASP5, CHMP2A, CHMP2B, CHMP3, CHMP4A, CHMP4B, CHMP4C, CHMP6, CHMP7, CCS, ELANE, GSDMD, GSDME, GZMB, HMGB1, IL18, IL1A, IL1B, IRF1, IRF2, TP53, and TP63). The univariate Cox model was used to screen for pyroptosis-related lncRNAs that may predict BRCA prognosis. From the analysis, we obtained 11 target lncRNAs that are differentially expressed between tumors and normal tissues. Next, we grouped the tumor tissues into three clusters via consensus clustering based on the previously obtained differentially expressed lncRNA. Lastly, we also analyzed whether PD-L1 expression was associated with clustering and expression.
ESTIMATE
The ESTIMATE calculation method was used to analyze the ESTIMATE, immune, and stromal scores [17]. Subsequently, we examined the association between the three clusters and the tumor-infiltrating immune cells (TICs).
Construction and verification of the BRCA prognostic model
To improve the fidelity and validity of our prognostic model, we categorized the patient data at random into a training cohort (N=728) and a test cohort (N=311). The LASSO Cox regression analysis was utilized to narrow the range of pyroptosis-related lncRNA to reduce the risk of overfitting [18,19]. A total of 8 pyroptosis-related lncRNA were filtered out through multivariate Cox regression analysis and were used to create a risk model that aims to predict patient survival rates. Patient risk scores were computed according to the normalized expression level of each gene and its corresponding regression coefficient using the following equation:
Risk score = OTUD6B-AS1×0.045+AL135818.1×-0.009+LINC01871×-0.152+AC105020.5×-0.648+AC069360.1×0.499+AC002398.1×-0.006+NIFK-AS1×-0.296+AC090912.3×-0.943.
Then, we conducted a t-distributed stochastic neighbor embedding (t-SNE) analysis and principal component analysis (PCA). The “Rtsne” and “ggplot2” packages in R were utilized to visualize the resulting two-dimensional data. Subsequently, the independent prognostic indicators were determined using the “survival” package. The risk score for predicting the prognosis of BRCA patients was estimated by multivariate and univariate Cox regression analysis. Lastly, the “survival” R package was again utilized to examine the survival probability of the low- and high-risk patient groups.
The screened target lncRNAs were employed as independent prognostic indicators to create a nomogram [20]. The diagram was then utilized to evaluate the prediction accuracy of the model at three time points: 1-, 2-, and 3-years following diagnosis. The consistency index (C index) and calibration chart were used in correcting the nomogram through the guidance technique of 1000 resampling.
Comparison of pyroptosis-related lncRNAs Signature with other breast cancer pyroptosis models
To determine whether our 8 pyroptosis-related lncRNAs are superior to other breast cancer pyroptosis models, we used the subject work curve (ROC) to compare 7 lncRNAs Signature [20] and 8 lncRNAs Signature [21]. The 1, 3, and 5-year ROC curves constructed for the all TCGA cohort were compared with 8 lncRNAs Signature associated with scorch death in this study to assess the advantages and disadvantages of each model. As well as we compare the C-index and RMS.
Functional enrichment analysis
Gene Ontology (GO) and Kyoto Encyclopedia of Genes and Genomes (KEGG) function enrichment analyses were conducted on the target lncRNAs to examine the differences between the low- and high-risk groups. The ssGSEA was usedto calculate the enrichment scores of distinct immune cell subgroups and to determine the associated activities and pathways in order to explore the correlations between immunological status and risk score [22].
Estimation of TICs
The CIBERSORT method [23] was employed to determine the distribution of 22 TICs in BRCA specimens. Wilcoxon rank-sum test was used to compare the proportion of immune cells in tumor tissues of patients as well as the associations between immune cell distribution and lncRNA expression in the high- and low-risk groups.
Cell culture
MCF-7 cells were cultured in RPMI-1640 medium and MCF-10A cells in DMEM medium, all media were mixed with 10% fetal bovine serum +1% double antibody. Cells were incubated in 5% CO2 in a 37°C thermostat.
Patient samples
From February 2022 to March 2022, breast cancer and para-cancerous tissues were collected from five patients in the Breast surgery department of the Affiliated Zhuzhou Hospital of Xiang Ya School of Medicine Central South University. After careful examination of these tissues by three pathologists, the diagnosis of breast cancer was made. The patients had not undergone any treatment prior to surgery. All patients signed an informed consent form. This study was approved by the Ethics Committee of the Affiliated Zhuzhou Hospital of Xiang Ya School of Medicine Central South University (No. 201905032). The study was in accordance with the Declaration of Helsinki.
Quantitative real-time PCR (qRT-PCR)
The total RNA from patient samples and cell were using Total RNA Extraction Kit (Solarbi, China). To quantify eight pyroptosis-related lncRNAs levels, reverse transcription of cDNA was performed using prime script rt kit (Takara). The eight pyroptosis-related lncRNAs expression levels were measured using SYBR Green qPCR Mix (Takara). The primers sequences were listed Table 3. The relative expression levels of the eight pyroptosis-related lncRNAs were determined using the 2-ΔΔCt method.
Table 3.
Primer sequences for qRT-PCR
| Primer | Sequence (5’-3’) |
|---|---|
| LINC01871-F | ACATCATAGTGACCCCCTATCTCTG |
| LINC01871-R | CCTTTCTCTTCAGTCTCCTGTGTAG |
| OTUD6B-AS1-F | CAGCCTTTCAGAGTAAGTGGAGTAG |
| OTUD6B-AS1-R | CATCTGTGGTACAGGTAGGAGATTG |
| AL135818.1-F | CAACTCCTACCATGTCTAGACACAG |
| AL135818.1-R | CTATAAGACTACTCCTTCCGGCCTA |
| AC105020.5-F | GGAGGGAAAGACACTACTCTACATC |
| AC105020.5-R | GATTCTCTACCTGACCACTTCTCTC |
| NIFK-AS1-F | GGTCTTCGAAAGTGCTGGGA |
| NIFK-AS1-R | GCCTTTGCACCATGGTGTTT |
| AC090912.3-F | GGAAAGTGCCAACCAGCTTG |
| AC090912.3-R | AATCTTCCCTGGCTGGCTTC |
| AC002398.1-F | AACAGGGACAAAAAGGGGCA |
| AC002398.1-R | AGGATGGGAATTGGCAAGGG |
| AC069360.1-F | CAGGCCCAAGACTTTTTGGC |
| AC069360.1-R | GGTTTTGCAAGAGCCACTGG |
Statistical analysis
We normalized all RNA-Seq data by the ComBat function in the sva software package. Wilcoxon rank sum test was performed to check the difference of gene expression between normal tissues and tumor tissues. The survival curve was drawn with the help of the Kaplan-Meier method, clustering classification was carried out by consensus clustering software package, and the ssGSEA algorithm helped in the evaluation of tumor-infiltrating immune cells. All statistics were completed using the R language software package (https://www.r-project). We considered P-value <0.05 as significant.
Ethical approval
As this work is a bioinformatics analysis, ethical approval is not required. All methods were performed in accordance with the relevant guidelines and regulations.
Results
Screening of pyroptosis-related lncRNAs in BRCA
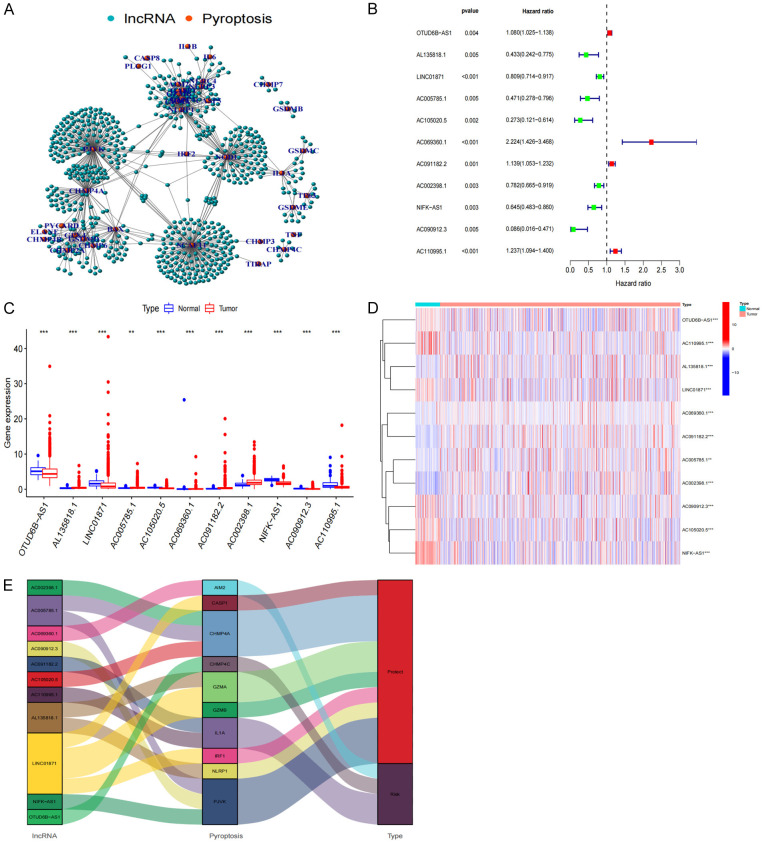
A total of 685 lncRNAs associated with the regulation of 27 pyroptosis-related genes were screened (Figure 1A). A shortlist of 11 prognostically related lncRNAs was obtained using univariate Cox analysis (Figure 1B). The corresponding expression of these lncRNAs are shown in the boxplot and heatmap (Figure 1C, 1D). Four of these genes (OTUD6B-AS1, AC091182.2, AC110995.1, AC069360.1) were highly expressed in cancerous tissues, while the remaining seven genes (AC090912.3, AC105020.5, AL135818.1, AC005785.1, NIFK-AS1, AC002398.1, LINC01871) had low expression levels in BRCA (Table 2). Our study mapped the Sankey diagram of lncRNAs-Pyroptosis (Figure 1E) to better illustrate the role of lncRNA-regulated pyroptosis-related genes in BRCA.
Figure 1.
Screening of pyroptosis-related lncRNA. A, B. Network and Forest plot of the prognostic ability of the 11 filtered pyroptosis-related lncRNA included in the prognostic signature. C, D. Heat map and the expression level of 11 pyroptosis-related prognostic genes in BRCA tumour tissues and normal tissues. E. Sankey diagram visualizing a co-expression network of 11 pyroptosis-related lncRNAs and pyroptosis with prognostic value in BRCA. *P<0.05; **P<0.01; and ***P<0.001.
Table 2.
Univariate analysis showing associations between Pyroptosis-Related lncRNA in BRCA. Unadjusted HRs are shown with 95 percent confifidence intervals
| gene | HR | HR.95L | HR.95H | p value |
|---|---|---|---|---|
| OTUD6B-AS1 | 1.080146747 | 1.025433392 | 1.137779405 | 0.00364986 |
| AL135818.1 | 0.432874017 | 0.241908381 | 0.774590421 | 0.004797959 |
| LINC01871 | 0.809043355 | 0.713549827 | 0.91731667 | 0.000944033 |
| AC005785.1 | 0.470592592 | 0.278072932 | 0.796400375 | 0.004984066 |
| AC105020.5 | 0.272876784 | 0.121296155 | 0.613883754 | 0.001692268 |
| AC069360.1 | 2.223886223 | 1.425930276 | 3.468381319 | 0.000423874 |
| AC091182.2 | 1.138830155 | 1.052585827 | 1.232140969 | 0.001214452 |
| AC002398.1 | 0.781585984 | 0.664982305 | 0.918635949 | 0.002794551 |
| NIFK-AS1 | 0.644699644 | 0.483078082 | 0.860394307 | 0.00287206 |
| AC090912.3 | 0.085843853 | 0.015630092 | 0.47147305 | 0.00472598 |
| AC110995.1 | 1.237266832 | 1.093806951 | 1.399542407 | 0.000709337 |
Clustering and expression analysis of pyroptosis-related lncRNA
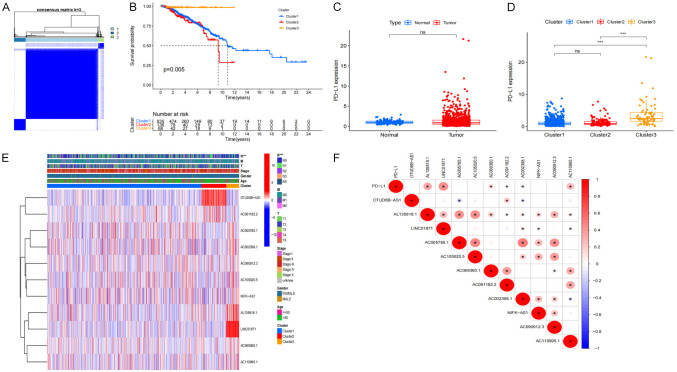
Using consensus clustering, we selected groups with high expression of focal pyroptosis-related prognostic lncRNA based on the largest CDF and AUC area. Three different subgroups were identified from the analysis (Figure 2A). Cluster 3 had the highest score among the 3 clusters, while cluster 2 scored the lowest. Analyses of the Kaplan-Meier survival curves show that BRCA patients in cluster 3 exhibited better overall survival (OS) compared to Clusters 1 and 2 (P=0.005) and that more than 50% of the patients in Clusters 1 and 3 had OS of more than ten years (Figure 2B). Furthermore, our results show that patients in cluster 3 had a significantly higher PD-L1 expression (Figure 2C), indicating that patients under this cluster may benefit from PD-L1 inhibitors (Figure 2D). We further analyzed the expression levels of the target genes, clusters, and clinical characteristics by creating a heat map showing the correlations between the scores and BRCA prognosis. We found that patients with elevated scores in Clusters 1 and 3 had less lymphatic metastasis (P<0.05). In contrast, tumors were more likely to progress in cluster 2 BRCA patients with high expression levels of pyroptosis-related lncRNA, especially OTUD6B-AS1 and AC091182.2 (Figure 2E). Additionally, PD-L1 and lncRNA correlation analysis showed that PD-L1 is significantly positively correlated with AL135818.1, LINC01871, AC110995.1, and AC069360.1 (Figure 2F).
Figure 2.
The classification and clinical characteristics associated with pyroptosis-related lncRNA. A. The consensus matrix of the optimal k-3. B. Kaplan-Meier overall survival (OS) curve for different clustered patients (P=0.005). C. PD-L1 express in BRCA and normal tissue. D. The expression level of PD-L1 in cluster 1/2/3 subtypes. E. Heat map of the correlation between the expression levels of 11 filtered pyroptosis-related lncRNA and clinical pathological characteristics in different clusters. F. The correlation of PD-L1 with pyroptosis-related lncRNA.
Immunological analysis of lncRNA clusters
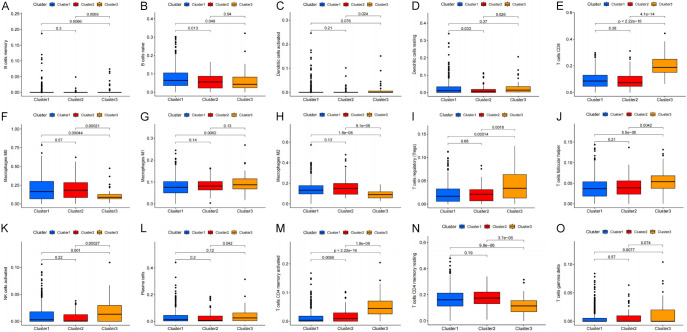
We determined the relationship between the clusters and the immune, stromal, and ESTIMATE scores using the ESTIMATE calculation method. Our analyses showed that the clusters were closely related to the immunization, stromal, and ESTIMATE scores, especially Cluster 3, which scored highest on both the immunization and ESTIMATE scores (Figure 3A-C). Next, we re-evaluated the correlation between the clusters and the 22 different types of immune cells (Figure 4A: B cells memory, Figure 4B: B cells naive, Figure 4C: Dendritic cells activated, Figure 4D: Dendritic cells resting, Figure 4E: T cells CD8, Figure 4F: Macrophages M0, Figure 4G: Macrophages M1, Figure 4H: Macrophages M2, Figure 4I: T cells regulatory (Tregs), Figure 4J: T cells follicular helper, Figure 4K: NK cells activated, Figure 4L: Plasma cells, Figure 4M: T cells CD4 memory activated, Figure 4N: T cells CD4 memory resting, Figure 4O: T cells gamma delta) in the TME. Among these cell types, naïve B cells, M0 macrophages, M2 macrophages, and resting CD4+ memory T cells were found to be inversely correlated with cluster 3. Based on these results, we propose that the expression of pyroptosis-related lncRNA may promote the polarization of M0 macrophages to M2 macrophages, therefore resisting tumor effects and promoting tumor progression.
Figure 3.

The relationship between the ESTIMATE associated with pyroptosis-related lncRNA cluster type. Immune scores (A), stromal scores (B), and ESTIMATE scores (C).
Figure 4.
The relationship between the tumor-infiltrating immune cells (TICs) associated with pyroptosis-related lncRNA cluster type. (A) B cells memory, (B) B cells naive, (C) Dendritic cells activated, (D) Dendritic cells resting, (E) CD8 T cells CD, (F) Macrophages M0, (G) Macrophages M1, (H) Macrophages M2, (I) T cells regulatory (Tregs), (J) T cells follicular helper, (K) NK cells activated, (L) Plasma cells, (M) T cells CD4 memory activated, (N) T cells CD4 memory resting, (O) T cells gamma delta.
Development and verification of the BRCA prognostic model
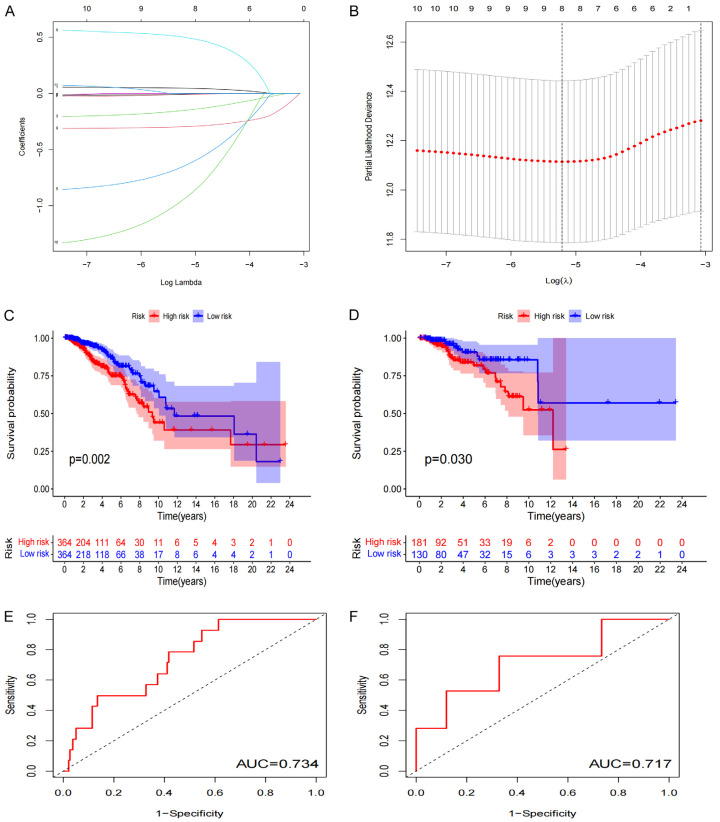
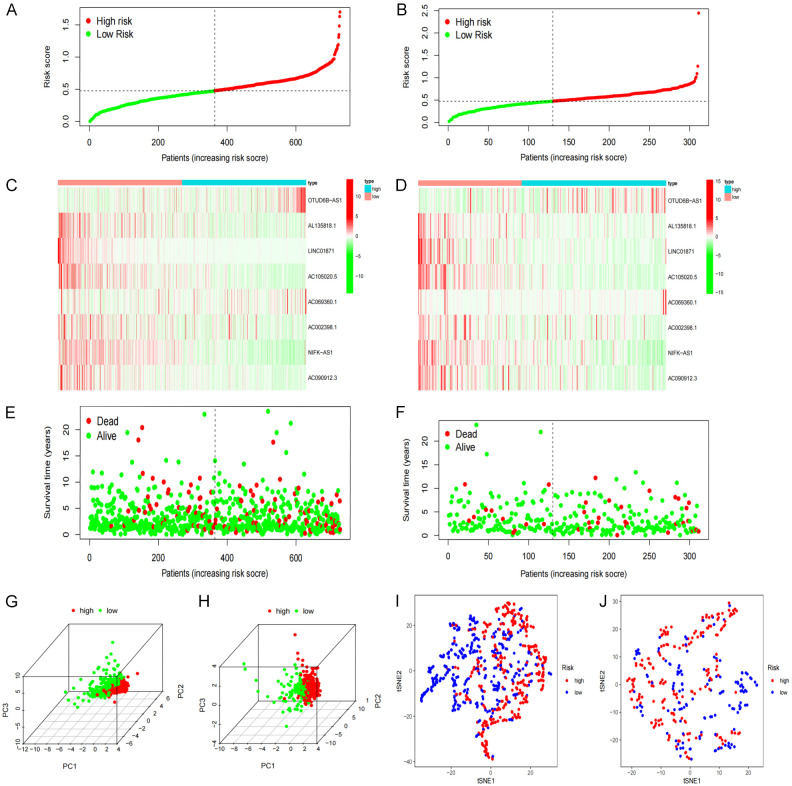
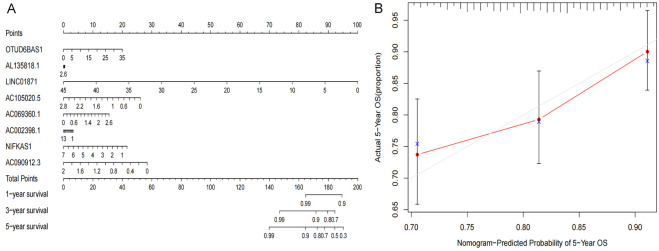
LASSO regression analysis was performed on the eight previously screened pyroptosis-related lncRNAs to obtain their coefficients (Figure 5A, 5B). The risk score of each BRCA patient was determined. Based on the median value of their risk scores, the patients were classified into low- and high-risk groups. Kaplan-Meier analyses showed that the OS of patients in the low-risk group was significantly elevated as opposed to that of patients in the high-risk group, for both the training and test sets (P<0.05) (Figure 5C, 5D). Furthermore, the one-year area under the ROC curve (AUC) for the training and test set was 73.4% and 71.7%, respectively (Figure 5E, 5F). We constructed the BRCA prognostic risk model, where the training median risk score was 0.49 (Figure 6A), and testing where the median risk score was 0.52 (Figure 6B). On the other hand, the high-risk group exhibited an obviously increased mortality rate in comparison with the low-risk group (Figure 6C, 6D). Likewise, elevated expression levels of OTUD6B-AS1 and AC069360.1 were observed in the high-risk group in contrast to the low-risk group (Figure 6E, 6F). The results of the PCA and the t-SNE analyses revealed that the distribution of patients in the high- and low-risk groups is inverse to each other (Figure 6G-J). Extract multifactor analysis was employed to create a nomogram to verify the validity of the eight independent prognostic indicators, identify the corresponding probability of each lncRNA expression on the nomogram, and determine the probability of a patient to survive for 1, 2, and 3 years (Figure 7A). The calibration chart successfully predicted a three-year probability of survival (Figure 7B).
Figure 5.
Prognosis of pyroptosis-related lncRNA genetic characteristic models. A, B. LASSO regression of 8 pyroptosis-related genes. C, D. Kaplan-Meier analysis survival rates for patients in high-risk and low-risk groups. E, F. AUC time-dependent ROC curve evaluates the prognosis model for OS.
Figure 6.
Re-verification of the prognostic model. (A, B) The distribution and median of the risk score. (C, D) The status of OS and the distribution of risk scores. (E, F) Expression spectrum of pyroptosis-related lncRNA genes in training (E) and testing cohort (F). (G, H) PCA diagram. (I, J) t-SNE analysis.
Figure 7.
Nomogram based on the prognosis characteristics of the 8 genes is in the TCGA cohort. Build a nomogram model of five genes and high and low risk to predict one, two, and three years of survival with TCGA Set (A). The calibration chart shows that the predicted survival rate is consistent with the actual survival rates for 3 years with TCGA Set (B). The x-axis represents the line method to predict survival, and the y-axis represents actual survival.
Statistical analysis of the BRCA prognostic model
To investigate if risk scores could be utilized as an independent prognosis indicator of OS, univariate and multivariate Cox analyses were conducted on clinical parameters. Univariate Cox analysis showed that the risk scores in training and testing cohorts were greatly associated with OS (training cohort: HR=9.387; 95% CI=4.074-21.631; P<0.001; testing cohort: HR=11.885; 95% CI=4.023-35.113; P<0.001; Figure 8A, 8B). Similar results were observed using multivariate Cox analysis (training cohort: HR=8.048; 95% CI=3.561-18.188; P<0.001; testing cohort: HR=5.706; 95% CI=1.888-17.244; P=0.002) (Figure 8C, 8D). Thus, we inferred that the risk score has a better prediction accuracy for BRCA prognosis.
Figure 8.
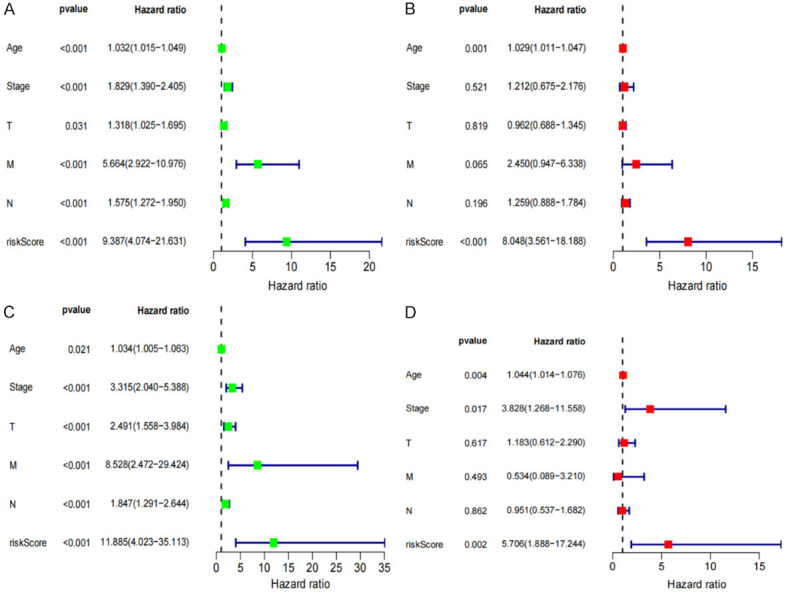
Independent risk factor analysis and validation. Univariate and Multivariate analyses shows that the risk score (based on the pyroptosis-related lncRNA) is an independent prognostic predictor in the training Set (A, B) and Verification Set (C, D).
Comparison of genetic features associated with other models of prognosis of pyroptosis in BRCA
To determine whether our 8 pyroptosis-related lncRNAs model were superior to other breast cancer pyroptosis models, by comparing them with the 7 lncRNAs model and the 8 lncRNAs model, our pyroptosis model AUC values at 1, 3, and 5 years that were statistically significant (Supplementary Figure 1A), The ROC results of the risk model we constructed suggested that the AUC values were higher than 7 lncRNAs model and the 8 lncRNAs model, and the C-index and RMS were similar to the results of Gao and LV, indicating that the prediction accuracy of our study would be higher overall (Supplementary Figure 1).
Subgroup analysis of the BRCA prognostic model
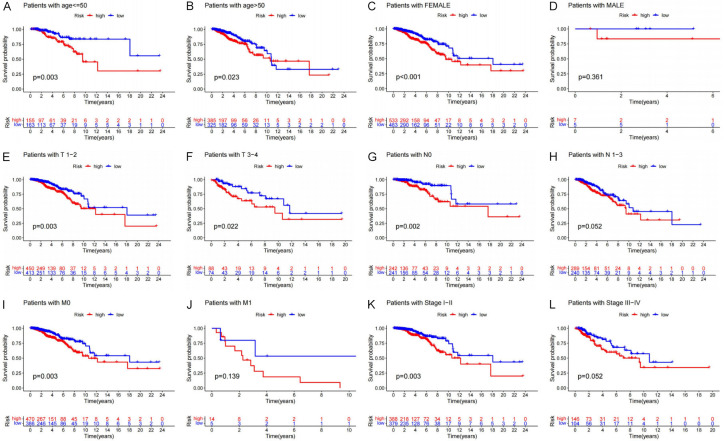
We also classified metastasis, lymph node status, tumor size, sex, age, and clinical staging in patients to probe into the ability of the prognostic model to predict their clinicopathological characteristics. BRCA patients aged ≤55 years and those in subgroups aged >55 years and belonging to the high-risk group exhibited lower OS relative to the low-risk group (P=0.003 and P=0.023, Figure 9A, 9B). The female patients exhibited a better OS in the low-risk group (P<0.001, Figure 9C), but no difference in OS for male patients (Figure 9D). Compared with similar high-risk group patients, those with T1-2 and T3-4 tumors (P=0.003 and P=0.022, Figure 9E, 9F) and those without lymph node metastasis (No subgroup P=0.002, Figure 9G, 9H) had better prognosis in the low-risk group. Moreover, the M0 group of low-risk patients exhibited better OS relative to similar high-risk group patients (P=0.003, Figure 9I), but no difference in M1 group for male patients (Figure 9J). In patients with Stage I-II BRCA, the low-risk group still exhibited better OS as opposed to the high-risk group (Figure 9K), in the Stage III-IV BRCA no difference (Figure 9L). Overall, subgroup analysis revealed that there were significant differences between the low- and high-risk groups. This provides further evidence that our prognostic model effectively predicts the clinical prognosis of BRCA patients.
Figure 9.
Relationship between prognostic model and clinical pathological characteristics. (A, B) Age, (C, D) Gender, (E, F) Tumor size, (G, H) Lymph node metastasis, (I-L) Metastasize, (K, L) Stage.
Functional enrichment analysis
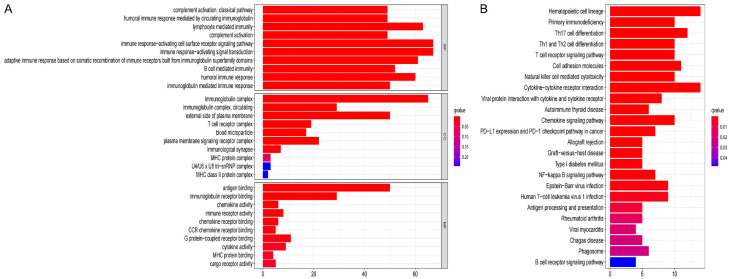
The R software was utilized to conduct the GO function and KEGG pathway enrichment analysis between the low- and high-risk groups. GO functional enrichment analysis shows that high and low risk is strongly associated with immunity and immune response (Figure 10A). As demonstrated by the findings of the KEGG enrichment analysis, the primary pathways involved were “Chemokine signaling pathway”, “T cell receptor signaling pathway”, “PD-1 checkpoint pathway”, “B cell receptor signaling pathway”, “PD-L1 expression”, and “NF-kappa B signaling pathway” in cancer (Figure 10B).
Figure 10.
Functional enrichment analysis is based on DEGs between high and low risk groups in the TCGA cohort. A. GO, Gene Ontology. B. KEGG, Kyoto Encyclopedia of Genes and Genomes.
Analysis of the association between risk scores and clinical features in BRCA patients
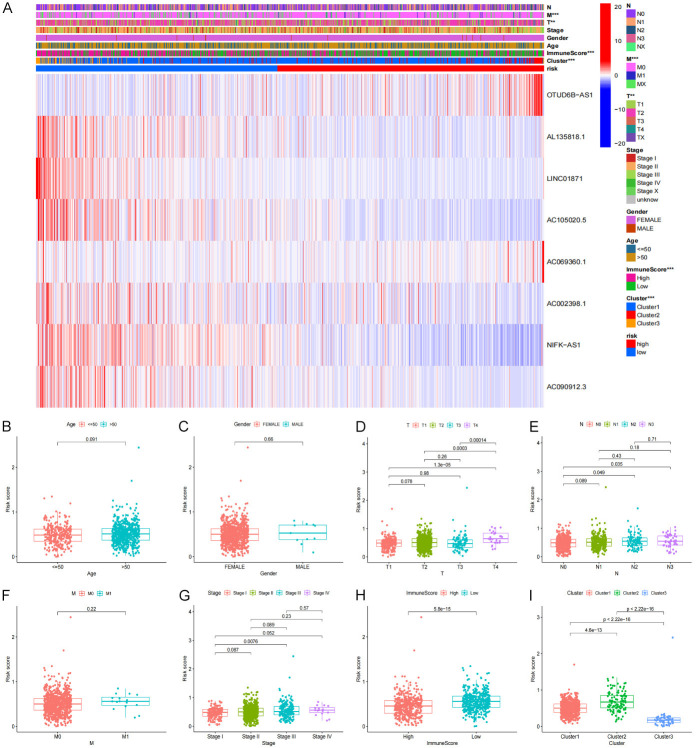
To examine the correlation between the prognostic model and the resulting clinical features, we conducted a specific analysis to identify if the risk score is relevant to clinical pathology information (Figure 11A). We compared age, gender, tumor size (T), distant metastases and lymph node metastases (N), and clinical stage in the high and low-risk groups. (Figure 11B-I). Prominent differences in the risk score between the T, N, and clinical stage subgroups were observed, such as lower immune scores correlate to higher T and clinical stage. Further-more, we found that lymph node metastasis indicates higher risk scores, resulting in a poor prognosis.
Figure 11.
The relationship between risk score and clinical features. (A) Pyroptosis-related lncRNA expression levels associated with cluster and clinical pathological characteristics showing in Heatmap. (B) Age, (C) Gender, (D) Tumor size, (E) Lymph node metastasis, (F) Metastasize, (G) Stage. (H) ImmuneScore, (I) Cluster.
Analysis of TME and the immune status of BRCA patients
To explore the indicative effects of the risk score on the TME, we used a cell classification algorithm to detect the proportion of 22 immune cells in the BRCA microenvironment (Figure 12). Wilcoxon and Mann-Whitney test results showed that the distribution of activated CD4+ memory T cells, follicular helper T cells (Tfh), memory B cells, plasma cells γδT cells, regulatory T (Treg) cells, naïve B cells, CD8+ T cells, activated NK (natural killer) cells, and M1 macrophages were relatively higher in the high-risk group than in the low-risk group. Similarly, the number of resting mast cells, M0 macrophages, and M2 macrophages, and was relatively elevated in the high-risk group than the low-risk group.
Figure 12.
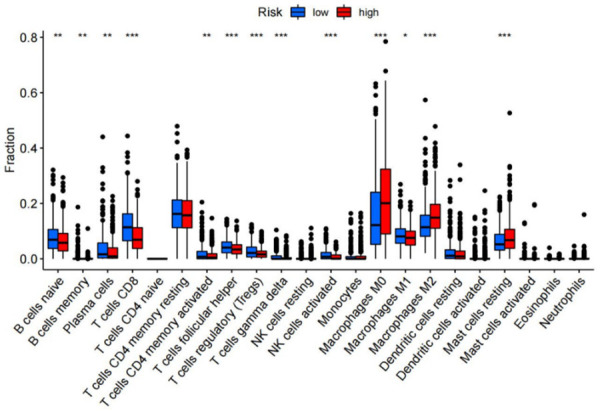
Immunological analysis between riskscore group. The infiltration levels of 22 immune cell types in high-risk and low-risk group.
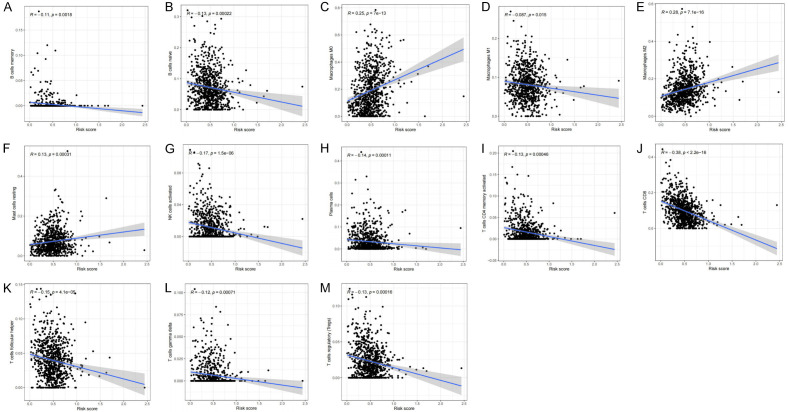
Pearson’s analysis was utilized to demonstrate a common expression pattern between different immune cells. Similarly, we further examined the association between the risk scores and the proportion of immune cells (Figure 13A-M). In this study, we found that the number of resting mast cells, M0 macrophage, and M2 macrophage had a positive association with the risk score. In contrast, the number of activated NK cells, γδT cells, follicular helper T cells, memory B cells, CD8+ T cells, plasma cells, activated CD4+ memory T cells, naive B cells, Treg cells, and M1 macrophages had a negative association with the risk score. These findings further confirm that the risk score predicts the immune activity in the BRCA TME.
Figure 13.
Relationships between the risk score and infiltration abundances of 13 immune cell types. (A) B cells memory (P=0.0018), (B) B cells naive (P=0.00022), (C) Macrophages M0 (P=7e-13), (D) Macrophages M1 (P=0.015), (E) Macrophages M2 (P=7e-16), (F) Mast cells resting (P=0.00031), (G) NK cells activated (P=1.5e-06), (H) Plasma cells (P=0.00011), (I) T cells CD4 memory activated (P=0.00046), (J) T cells CD8 (P<2.2e-16), (K) T cells follicular helper (P=4.1e-05), (L) T cells gamma delta (P=0.0071), (M) T cells regulatory (Tregs) (P=0.00016).
Various immune cells and corresponding immunological pathways were subjected to ssGSEA analysis in order to investigate the differences in immune-related status between the low- and high-risk groups (Figure 14). With regard to antigen presentation, we discovered that the terms “Type II IFN Response”, “T cell co-stimulation”, “CCR”, “Parainflammation”, “Checkpoint”, “MHC-I class”, “Cytolytic activity”, “Inflammation-promoting”, “HLA”, “T cell co-inhibition”, and “APC co-inhibition”, score was higher in the low-risk group. Similarly, “Macrophages”, “B cells”, “aDCs”, “CD8+ T_cells”, “iDCs”, “NK_cells”, “DCs”, “pDCs”, “helper T cells”, “Tfh”, “Th1 cells”, “Th2 cells”, and “Tregs” score also higher in low-risk groups.
Figure 14.
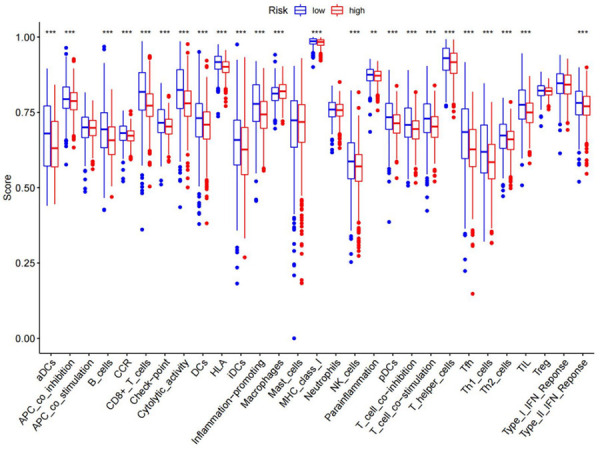
Relationship between immune status and risk score and tumor microenvironment in the high- and low-risk groups.
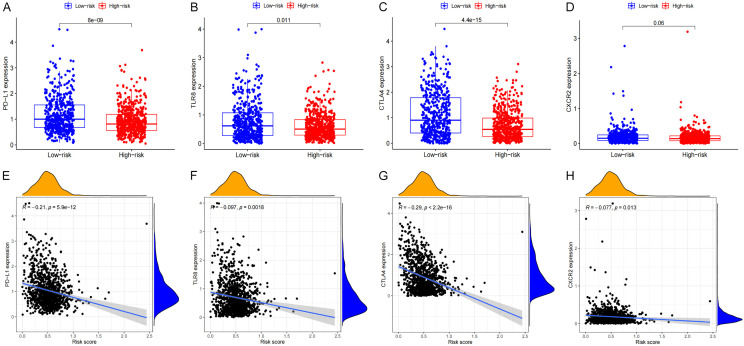
As evidenced by the expression levels of PD-L1 and CTLA4, those in the low-risk group had elevated checkpoint scores. PD-L1 and CTLA4 are typical immunological checkpoints that modulate the length and intensity of immune responses as well as the ability of tumors to evade the detection from the immune system under physiological settings. In this study, it was shown that the levels of PD-L1 and CTLA4 expression were greatly elevated in the lowrisk group as opposed to the high-risk group (Figure 15A, 15B). The expression levels of these genes were shown to be inversely associated with the risk scores. A similar pattern was seen with other immune checkpoints, including CXCR2 and TLT8 (Figure 15C, 15D). The levels of PD-L1, CTLA4, CXCR2 and TLT8 expression were shown to be inversely associated with the risk scores (Figure 15E, 15H).
Figure 15.
The correlation analysis between risk score and the expression levels of PD-L1, TLR8, CTLA4 and CXCR2. A, E. PD-L1. B, F. TLR8. C, G. CTLA4. D, H. CXCR2.
Validated these eight genes by breast cancer tissue samples and cell experiments
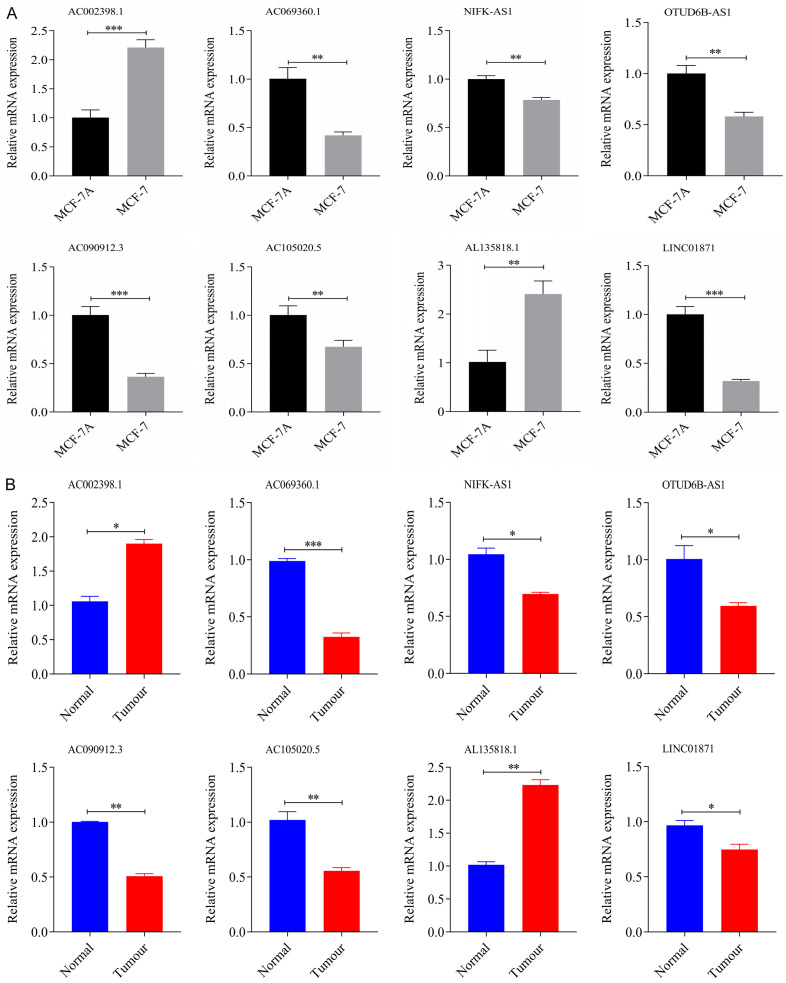
The qRT-PCR was performed on mammary epithelial cells MCF-10A and breast cancer cells MCF-7 cell, as well as 5 pairs of breast cancer tissues and para-cancerous tissues, to verify the mRNA expression levels of these eight characteristic genes. All results were in general agreement with the data in TCGA (Figure 16A, 16B). (*P<0.05; **P<0.01; ***P<0.001).
Figure 16.
The relative expression levels of the eight genes qRT-PCR. A. MCF-10A/MCF-7. B. Breast cancer tissue samples (*P<0.05; **P<0.01, ***P<0.001).
Discussion
In this study, we found 685 lncRNAs which correlated with 27 pyroptosis-related genes from 1,099 BRCA patients, 11 of which were associated with BRCA prognosis. Four of the prognostic lncRNAs exhibited high expression in BRCA tumor tissues, whereas the other seven were poorly expressed. One out of four highly expressed lncRNA and three out of seven poorly expressed lncRNA showed a positive correlation with patient OS and were found to be sensitive to PD-L1 inhibitors. In addition, we found that M2 macrophages are negatively correlated with pyroptosis-related genes. However, M2 macrophages could promote tumor growth, invasion, and metastasis [24]. We repeatedly confirmed the reliability of the proposed BRCA prognostic model through different analysis methods and demonstrated that it could predict the OS and clinical characteristics of BRCA patients. Moreover, we also explored the TME of BRCA and found that low lncRNA expression is associated with increased sensitivity to PD-L1 inhibitors. We, therefore, propose that the levels of PD-L1 and CTLA4 expression may be analyzed to forecast the prognosis of BRCA patients.
Among the eight pyroptosis-related lncRNA included in the constructed risk model, OTUD6B-AS1 was found to be involved in several cancers. Overexpression of this lncRNA was previously shown to suppress the proliferation, migration, and invasiveness of colorectal cancer [25]. In liver cancer, OTUD6B-AS1 stimulates the activation of the GSKIP/Wnt/β-catenin pathway by blocking miR-664b-3p, thereby promoting the progression of the disease [26] LINC01871, on the other hand, is involved in the construction of risk prediction models related to BRCA immunity [27] and autophagy [28]. NIFK-AS1, another pyroptosis-related lncRNA, participates in the progression of hepatocellular carcinoma (HCC). NIFK-AS1, another pyroptosis-related lncRNA, was shown to participate in the progression of hepatocellular carcinoma (HCC). An earlier study illustrated that NIFK-AS1 knockdown successfully inhibited the proliferation, migration, and invasion of HCC cells, possibly by modulating MMP-7 and MMP-9 expression through the NIFK-AS1/miR-637/AKT1 axis of the ceRNA network [29]. It was also found that NIFK-AS1 inhibits the effects of tumor-related M2 polarization and estrogen-induced proliferation, migration, and invasion in endometrial cancer. Other pyroptosis-related lncRNAs have not been reported in the literature [30].
Since BRCA is a common malignant tumor, optimizing treatments and improving judgment on its prognosis is important. Compared with normal tissues, a large number of lncRNAs were found to be differentially expressed in tumor tissues. Over the past few years, related studies have demonstrated that lncRNAs participates in tumor proliferation [31], regulation of cell immortalization [32], immune escape of tumor cells [33], regulation of tumor suppressor and growth arrest pathways [34], promotion of cell apoptosis [35], tumor angiogenesis [36], tumor invasion and metastasis [37], regulating tumor energy metabolism [38], suppressing the cancer-promoting inflammatory response [39] and enhancing the stability of the tumor genome [40]. Thus, we speculate that lncRNAs are widely involved in the occurrence and progression of tumors and that lncRNAs might be a promising therapeutic target for BRCA.
In conclusion, a novel lncRNA research based on pyroptosis can provide predictive indicators for the diagnosis, treatment, and prognosis of BRCA. Moreover, exploring the functions and mechanisms of PD-L1 and CTLA4 may reveal other potential immune checkpoint inhibitors. Additional research is needed to verify the effectiveness of the proposed risk model. Finally, inducing pyroptosis in BRCA may be an effective method to improve the efficacy of immunotherapy in BRCA patients.
Acknowledgements
I would like to thank all the authors for their contributions to this article. We also acknowledge the TCGA for providing data. This work was funded by the Youth Project of Hunan Natural Science Foundation (Grant number 2020JJ5997).
Disclosure of conflict of interest
None.
Abbreviations
- BRCA
Breast cancer
- TME
Tumor microenvironment
- TCGA
The Cancer Genome Atlas
- SsGSEA
Single sample gene set enrichment analysis
- GSDMs
Gasdermins
- GZMB
Granzyme B
- GSDME
Gasdermin E
- GSDMB
Gasdermin B
- DCs
Dendritic cells
- TICs
Tumor-infiltrating immune cells
- t-SNE
t-distributed random neighbor embedding
- PCA
Principal component analysis
- GO
Gene Ontology
- KEGG
Kyoto Encyclopedia of Genes and Genomes
- HCC
Hepatocellular carcinoma
- CTLA4
Cytotoxic T-lymphocyte-associated protein 4
- OS
Overall survival
- CXCR2
Chemokine (C-X-C motif) receptor 2
- Tfh cells
Follicular helper T cells
- Treg cells
Regulatory T cells
- NK cells
Natural killer cells
- ROC
Receiver Operating Characteristic Curve
Supporting Information
References
- 1.Sung H, Ferlay J, Siegel RL, Laversanne M, Soerjomataram I, Jemal A, Bray F. Global cancer statistics 2020: GLOBOCAN estimates of incidence and mortality worldwide for 36 cancers in 185 countries. CA Cancer J Clin. 2021;71:209–249. doi: 10.3322/caac.21660. [DOI] [PubMed] [Google Scholar]
- 2.Hussin F, Aroua MK, Szlachta M. Biochar derived from fruit by-products using pyrolysis process for the elimination of Pb(II) ion: an updated review. Chemosphere. 2022;287:132250. doi: 10.1016/j.chemosphere.2021.132250. [DOI] [PubMed] [Google Scholar]
- 3.Shi J, Gao W, Shao F. Pyroptosis: gasdermin-mediated programmed necrotic cell death. Trends Biochem Sci. 2017;42:245–254. doi: 10.1016/j.tibs.2016.10.004. [DOI] [PubMed] [Google Scholar]
- 4.Churchill MJ, Mitchell PS, Rauch I. Epithelial pyroptosis in host defense. J Mol Biol. 2021:167278. doi: 10.1016/j.jmb.2021.167278. [DOI] [PMC free article] [PubMed] [Google Scholar]
- 5.Du T, Gao J, Li P, Wang Y, Qi Q, Liu X, Li J, Wang C, Du L. Pyroptosis, metabolism, and tumor immune microenvironment. Clin Transl Med. 2021;11:e492. doi: 10.1002/ctm2.492. [DOI] [PMC free article] [PubMed] [Google Scholar]
- 6.Zhang Z, Zhang Y, Xia S, Kong Q, Li S, Liu X, Junqueira C, Meza-Sosa KF, Mok TMY, Ansara J, Sengupta S, Yao Y, Wu H, Lieberman J. Gasdermin E suppresses tumour growth by activating anti-tumour immunity. Nature. 2020;579:415–420. doi: 10.1038/s41586-020-2071-9. [DOI] [PMC free article] [PubMed] [Google Scholar]
- 7.Molina-Crespo Á, Cadete A, Sarrio D, Gámez-Chiachio M, Martinez L, Chao K, Olivera A, Gonella A, Díaz E, Palacios J, Dhal PK, Besev M, Rodríguez-Serrano M, García Bermejo ML, Triviño JC, Cano A, García-Fuentes M, Herzberg O, Torres D, Alonso MJ, Moreno-Bueno G. Intracellular delivery of an antibody targeting gasdermin-B reduces HER2 breast cancer aggressiveness. Clin Cancer Res. 2019;25:4846–4858. doi: 10.1158/1078-0432.CCR-18-2381. [DOI] [PubMed] [Google Scholar]
- 8.Yu WD, Wang H, He QF, Xu Y, Wang XC. Long noncoding RNAs in cancer-immunity cycle. J Cell Physiol. 2018;233:6518–6523. doi: 10.1002/jcp.26568. [DOI] [PubMed] [Google Scholar]
- 9.Zhu QN, Wang G, Guo Y, Peng Y, Zhang R, Deng JL, Li ZX, Zhu YS. LncRNA H19 is a major mediator of doxorubicin chemoresistance in breast cancer cells through a cullin4A-MDR1 pathway. Oncotarget. 2017;8:91990–92003. doi: 10.18632/oncotarget.21121. [DOI] [PMC free article] [PubMed] [Google Scholar]
- 10.Han J, Han B, Wu X, Hao J, Dong X, Shen Q, Pang H. Knockdown of lncRNA H19 restores chemo-sensitivity in paclitaxel-resistant triple-negative breast cancer through triggering apoptosis and regulating Akt signaling pathway. Toxicol Appl Pharmacol. 2018;359:55–61. doi: 10.1016/j.taap.2018.09.018. [DOI] [PubMed] [Google Scholar]
- 11.Yan K, Fu Y, Zhu N, Wang Z, Hong JL, Li Y, Li WJ, Zhang HB, Song JH. Repression of lncRNA NEAT1 enhances the antitumor activity of CD8(+)T cells against hepatocellular carcinoma via regulating miR-155/Tim-3. Int J Biochem Cell Biol. 2019;110:1–8. doi: 10.1016/j.biocel.2019.01.019. [DOI] [PubMed] [Google Scholar]
- 12.Wang P, Xue Y, Han Y, Lin L, Wu C, Xu S, Jiang Z, Xu J, Liu Q, Cao X. The STAT3-binding long noncoding RNA lnc-DC controls human dendritic cell differentiation. Science. 2014;344:310–313. doi: 10.1126/science.1251456. [DOI] [PubMed] [Google Scholar]
- 13.Cao J, Dong R, Jiang L, Gong Y, Yuan M, You J, Meng W, Chen Z, Zhang N, Weng Q, Zhu H, He Q, Ying M, Yang B. LncRNA-MM2P identified as a modulator of macrophage M2 polarization. Cancer Immunol Res. 2019;7:292–305. doi: 10.1158/2326-6066.CIR-18-0145. [DOI] [PubMed] [Google Scholar]
- 14.Jiang R, Tang J, Chen Y, Deng L, Ji J, Xie Y, Wang K, Jia W, Chu WM, Sun B. The long noncoding RNA lnc-EGFR stimulates T-regulatory cells differentiation thus promoting hepatocellular carcinoma immune evasion. Nat Commun. 2017;8:15129. doi: 10.1038/ncomms15129. [DOI] [PMC free article] [PubMed] [Google Scholar]
- 15.Ostuni R, Kratochvill F, Murray PJ, Natoli G. Macrophages and cancer: from mechanisms to therapeutic implications. Trends Immunol. 2015;36:229–239. doi: 10.1016/j.it.2015.02.004. [DOI] [PubMed] [Google Scholar]
- 16.Zhou Q, Tang X, Tian X, Tian J, Zhang Y, Ma J, Xu H, Wang S. LncRNA MALAT1 negatively regulates MDSCs in patients with lung cancer. J Cancer. 2018;9:2436–2442. doi: 10.7150/jca.24796. [DOI] [PMC free article] [PubMed] [Google Scholar]
- 17.Yoshihara K, Shahmoradgoli M, Martínez E, Vegesna R, Kim H, Torres-Garcia W, Treviño V, Shen H, Laird PW, Levine DA, Carter SL, Getz G, Stemke-Hale K, Mills GB, Verhaak RG. Inferring tumour purity and stromal and immune cell admixture from expression data. Nat Commun. 2013;4:2612. doi: 10.1038/ncomms3612. [DOI] [PMC free article] [PubMed] [Google Scholar]
- 18.Liu C, Wang X, Genchev GZ, Lu H. Multi-omics facilitated variable selection in Cox-regression model for cancer prognosis prediction. Methods. 2017;124:100–107. doi: 10.1016/j.ymeth.2017.06.010. [DOI] [PubMed] [Google Scholar]
- 19.Li C, Pak D, Todem D. Adaptive lasso for the Cox regression with interval censored and possibly left truncated data. Stat Methods Med Res. 2020;29:1243–1255. doi: 10.1177/0962280219856238. [DOI] [PMC free article] [PubMed] [Google Scholar]
- 20.Gao L, Li QJ. Identification of novel pyroptosis-related lncRNAs associated with the prognosis of breast cancer through interactive analysis. Cancer Manag Res. 2021;13:7175–7186. doi: 10.2147/CMAR.S325710. [DOI] [PMC free article] [PubMed] [Google Scholar]
- 21.Lv W, Tan Y, Zhao C, Wang Y, Wu M, Wu Y, Ren Y, Zhang Q. Identification of pyroptosis-related lncRNAs for constructing a prognostic model and their correlation with immune infiltration in breast cancer. J Cell Mol Med. 2021;25:10403–10417. doi: 10.1111/jcmm.16969. [DOI] [PMC free article] [PubMed] [Google Scholar]
- 22.Subramanian A, Tamayo P, Mootha VK, Mukherjee S, Ebert BL, Gillette MA, Paulovich A, Pomeroy SL, Golub TR, Lander ES, Mesirov JP. Gene set enrichment analysis: a knowledge-based approach for interpreting genome-wide expression profiles. Proc Natl Acad Sci U S A. 2005;102:15545–15550. doi: 10.1073/pnas.0506580102. [DOI] [PMC free article] [PubMed] [Google Scholar]
- 23.Newman AM, Liu CL, Green MR, Gentles AJ, Feng W, Xu Y, Hoang CD, Diehn M, Alizadeh AA. Robust enumeration of cell subsets from tissue expression profiles. Nat Methods. 2015;12:453–457. doi: 10.1038/nmeth.3337. [DOI] [PMC free article] [PubMed] [Google Scholar]
- 24.Li Z, Meng X, Wu P, Zha C, Han B, Li L, Sun N, Qi T, Qin J, Zhang Y, Tian K, Li S, Yang C, Ren L, Ming J, Wang P, Song Y, Jiang C, Cai J. Glioblastoma cell-derived lncRNA-containing exosomes induce microglia to produce complement C5, promoting chemotherapy resistance. Cancer Immunol Res. 2021;9:1383–1399. doi: 10.1158/2326-6066.CIR-21-0258. [DOI] [PubMed] [Google Scholar]
- 25.Wang W, Cheng X, Zhu J. Long non-coding RNA OTUD6B-AS1 overexpression inhibits the proliferation, invasion and migration of colorectal cancer cells via downregulation of microRNA-3171. Oncol Lett. 2021;21:193. doi: 10.3892/ol.2021.12454. [DOI] [PMC free article] [PubMed] [Google Scholar]
- 26.Kong S, Xue H, Li Y, Li P, Ma F, Liu M, Li W. The long noncoding RNA OTUD6B-AS1 enhances cell proliferation and the invasion of hepatocellular carcinoma cells through modulating GSKIP/Wnt/β-catenin signalling via the sequestration of miR-664b-3p. Exp Cell Res. 2020;395:112180. doi: 10.1016/j.yexcr.2020.112180. [DOI] [PubMed] [Google Scholar]
- 27.Ma W, Zhao F, Yu X, Guan S, Suo H, Tao Z, Qiu Y, Wu Y, Cao Y, Jin F. Immune-related lncRNAs as predictors of survival in breast cancer: a prognostic signature. J Transl Med. 2020;18:442. doi: 10.1186/s12967-020-02522-6. [DOI] [PMC free article] [PubMed] [Google Scholar]
- 28.Li X, Jin F, Li Y. A novel autophagy-related lncRNA prognostic risk model for breast cancer. J Cell Mol Med. 2021;25:4–14. doi: 10.1111/jcmm.15980. [DOI] [PMC free article] [PubMed] [Google Scholar]
- 29.Chen YT, Xiang D, Zhao XY, Chu XY. Upregulation of lncRNA NIFK-AS1 in hepatocellular carcinoma by m(6)A methylation promotes disease progression and sorafenib resistance. Hum Cell. 2021;34:1800–1811. doi: 10.1007/s13577-021-00587-z. [DOI] [PubMed] [Google Scholar]
- 30.Zhou YX, Zhao W, Mao LW, Wang YL, Xia LQ, Cao M, Shen J, Chen J. Long non-coding RNA NIFK-AS1 inhibits M2 polarization of macrophages in endometrial cancer through targeting miR-146a. Int J Biochem Cell Biol. 2018;104:25–33. doi: 10.1016/j.biocel.2018.08.017. [DOI] [PubMed] [Google Scholar]
- 31.Wang Y, Wang Z, Xu J, Li J, Li S, Zhang M, Yang D. Systematic identification of non-coding pharmacogenomic landscape in cancer. Nat Commun. 2018;9:3192. doi: 10.1038/s41467-018-05495-9. [DOI] [PMC free article] [PubMed] [Google Scholar]
- 32.Chu HP, Cifuentes-Rojas C, Kesner B, Aeby E, Lee HG, Wei C, Oh HJ, Boukhali M, Haas W, Lee JT. TERRA RNA antagonizes ATRX and protects telomeres. Cell. 2017;170:86–101. doi: 10.1016/j.cell.2017.06.017. [DOI] [PMC free article] [PubMed] [Google Scholar]
- 33.Hua Q, Wang D, Zhao L, Hong Z, Ni K, Shi Y, Liu Z, Mi B. AL355338 acts as an oncogenic lncRNA by interacting with protein ENO1 to regulate EGFR/AKT pathway in NSCLC. Cancer Cell Int. 2021;21:525. doi: 10.1186/s12935-021-02232-z. [DOI] [PMC free article] [PubMed] [Google Scholar]
- 34.Cheng X, Shihabudeen Haider Ali MS, Moran M, Viana MP, Schlichte SL, Zimmerman MC, Khalimonchuk O, Feinberg MW, Sun X. Long non-coding RNA Meg3 deficiency impairs glucose homeostasis and insulin signaling by inducing cellular senescence of hepatic endothelium in obesity. Redox Biol. 2021;40:101863. doi: 10.1016/j.redox.2021.101863. [DOI] [PMC free article] [PubMed] [Google Scholar]
- 35.Xu J, Liu L, Gan L, Hu Y, Xiang P, Xing Y, Zhu J, Ye S. Berberine acts on C/EBPβ/lncRNA Gas5/miR-18a-5p loop to decrease the mitochondrial ROS generation in HK-2 cells. Front Endocrinol (Lausanne) 2021;12:675834. doi: 10.3389/fendo.2021.675834. [DOI] [PMC free article] [PubMed] [Google Scholar]
- 36.Yuan SX, Yang F, Yang Y, Tao QF, Zhang J, Huang G, Yang Y, Wang RY, Yang S, Huo XS, Zhang L, Wang F, Sun SH, Zhou WP. Long noncoding RNA associated with microvascular invasion in hepatocellular carcinoma promotes angiogenesis and serves as a predictor for hepatocellular carcinoma patients’ poor recurrence-free survival after hepatectomy. Hepatology. 2012;56:2231–2241. doi: 10.1002/hep.25895. [DOI] [PubMed] [Google Scholar]
- 37.Xu Q, Cheng D, Liu Y, Pan H, Li G, Li P, Li Y, Sun W, Ma D, Ni C. LncRNA-ATB regulates epithelial-mesenchymal transition progression in pulmonary fibrosis via sponging miR-29b-2-5p and miR-34c-3p. J Cell Mol Med. 2021;25:7294–7306. doi: 10.1111/jcmm.16758. [DOI] [PMC free article] [PubMed] [Google Scholar]
- 38.Hung CL, Wang LY, Yu YL, Chen HW, Srivastava S, Petrovics G, Kung HJ. A long noncoding RNA connects c-Myc to tumor metabolism. Proc Natl Acad Sci U S A. 2014;111:18697–18702. doi: 10.1073/pnas.1415669112. [DOI] [PMC free article] [PubMed] [Google Scholar]
- 39.Honarmand Tamizkar K, Badrlou E, Aslani T, Brand S, Arsang-Jang S, Ghafouri-Fard S, Taheri M. Dysregulation of NF-κB-associated LncRNAs in autism spectrum disorder. Front Mol Neurosci. 2021;14:747785. doi: 10.3389/fnmol.2021.747785. [DOI] [PMC free article] [PubMed] [Google Scholar]
- 40.Elguindy MM, Mendell JT. NORAD-induced Pumilio phase separation is required for genome stability. Nature. 2021;595:303–308. doi: 10.1038/s41586-021-03633-w. [DOI] [PMC free article] [PubMed] [Google Scholar]
Associated Data
This section collects any data citations, data availability statements, or supplementary materials included in this article.


