

Abstract
Background: LncRNA LINC00665 partakes in controlling the malignant phenotype of cancer cells, but its role in glioma and the related regulatory mechanism remain uncertain. Methods: RT-PCR was exploited to examine LINC00665 expression. The relationships among the LINC00665 expression, the clinicopathologic values and magnetic resonance imaging (MRI) characteristics of glioma were analyzed. The multiplication, movement, and aggressiveness of glioma cell lines were evaluated by CCK-8, EdU, and Transwell experiments after constructing LINC00665 overexpression and LINC00665 knockdown cell models. A dual-luciferase reporter gene experiment and RIP experiment were executed to validate the interactions between LINC00665 and miR-129-5p, and between miR-129-5p and HMGB1. Western blot and RT-PCR were conducted to find the impact of LINC00665 and miR-129-5p on HMGB1 expression. Nude mouse model was also constructed to examine the impact of LINC00665 on multiplication and aggressiveness of glioma cells in vivo. Results: LINC00665 expression was markedly increased in glioma. High LINC00665 expression in glioma was closely linked to larger tumor diameter, higher pathologic grade, heterogeneous MRI signal of the tumor, increased peritumoral edema, and stronger MRI enhancement characteristics. LINC00665 overexpression facilitated the malignant behavior of glioma cells, while LINC00665 knockdown played the reverse role. Mechanistically, LINC00665 could decoy miR-129-5p, and indirectly increased HMGB1 expression. Conclusion: LINC00665 functions as an oncogenic lncRNA in glioma, to accelerate glioma progression by modulating miR-129-5p and increasing HMGB1 expression.
Keywords: LINC00665, glioma, miR-129-5p, HMGB, MRI, progression
Introduction
Glioma is the most prevalent primary tumor in the brain, originating from glial cells. It is one of the chief causes of carcinoma-associated death [1,2]. The morbidity of brain tumors is 21/100,000, accounting for about 2% of human cancers, and glioma cases account for about 60% of brain tumors [3]. Despite the rapid development of treatment strategies, the prognosis and survival rate of glioma remain low, especially for glioblastoma [4,5]. Therefore, understanding the molecular basis of glioma is critical to improve diagnosis and therapy.
Long non-coding (Lnc)RNAs are highly conserved transcripts having over 200 nucleotides that cannot encode proteins [6,7]. They were previously considered to be a class of non-functional by-products of transcription [6,7]. However, in the last decade, lncRNAs were found to participate in the modulation of diverse biologic activities, promoting or inhibiting cell proliferation, apoptosis, differentiation, migration, and aggressiveness [8,9]. For example, lncRNA HULC enhances the multiplication of lung squamous cell cancer cells by down-modulating PTPRO expression and activating the NF-κB pathway [10]. AFAP1-AS1 facilitates osteosarcoma tumorigenesis by regulating the RhoC/ROCK1/p38MAPK/Twist1 signaling pathway [11]. LINC00665 has been confirmed to exert an oncogenic effect on several human malignancies, such as liver cancer, non-small cell lung cancer, and gastric carcinoma [12-14]. Nevertheless, the biologic function of LINC00665 in glioma and the related regulatory mechanisms are uncertain.
Micro RNAs (miRNAs) are endogenous single-chain non-coding (nc) RNAs having around 18-25 nucleotides [15]. Multiple miRNAs, as the regulators of gene expression, participate in controlling of cell phenotype by specifically binding to the 3’-UTR of target genes [16]. Abnormal miRNA expression is strongly correlated with tumorigenesis [17]. MiR-129-5p impedes pancreatic carcinoma cell multiplication, and motility and induces apoptosis by targeting PBX3 [18]. Up-modulation of miR-129-5p expression impedes carcinoma cell metastasis and angiogenesis by impeding ZIC2 expression and suppressing the Hedgehog signaling pathway in cervical carcinoma [19]. Furthermore, miR-129-5p represses glioma progression by negatively regulating DNMT3A. Moreover, miR-129-5p expression is negatively linked to the WHO grade of glioma [20]. Nonetheless, the upstream mechanism responsible for miR-129-5p low expression in glioma is uncertain.
HMGB1 is affiliated with the HMG protein family; it regulates gene expression, and participates in the pathogenesis of inflammatory diseases and malignancies [20,21]. Dysregulated HMGB1 expression is linked to diverse human cancers, including liver carcinoma, prostate cancer, and glioma [21-23]. Interestingly, HMGB1 released in the glioma microenvironment increases vascular permeability and peritumoral edema, and indicates poor prognosis [24-26]. However, the mechanism of dysregulation of HMGB1 expression in glioma needs to be further explored.
The current work confirms that LINC00665 is up-modulated in glioma. Also, LINC00665 high expression is linked to adverse clinicopathologic measures and adverse magnetic resonance imaging (MRI) signs in the patients. It was shown that LINC00665 enhances glioma growth by modulating the miR-129-5p/HMGB1 axis. In conclusion, research suggests that the LINC00665/miR-129-5p/HMGB1 axis is a novel pathway of glioma development, so this study may aid glioma diagnosis and therapy.
Materials and methods
Clinical specimens
The research was executed following the ethical standards in the Declaration of Helsinki. All subjects implicated in the research signed a written consent form. This work was endorsed by the Ethics Committee of Hainan General Hospital. All tissues (including 5 cases of adjacent brain tissues and 25 cases of glioma tissues) were acquired during operation and maintained in liquid nitrogen immediately after resection. The pathologic analysis of these tissues was confirmed by two experienced pathologists. The clinical information and magnetic resonance imaging (MRI) images were obtained from the Department of Radiology, Hainan General Hospital.
Cell culture
U118, H4, U343, U87, A172 cells and immortalized human astrocyte (NHA) cell lines were procured from the IBCB of the CAS (Shanghai, China). All of the cells were grown in RPMI-1640 medium (Gibco, Carlsbad, CA, USA) comprising 10% FBS (Invitrogen, Carlsbad, CA, USA), 100 U/mL penicillin and 0.1 mg/mL streptomycin (Hyclone, Logan, UT, USA) at 37 degrees Celsius (CO2 volume fraction of 5% and humidity of 95%). The medium was refreshed at an interval of 2 to 3 days. The logarithmic growth phase cells were chosen for follow-up tests.
Oligonucleotides, plasmid construction, and cell transfection
U118 and A172 cells were seeded in a 60 mm plate at 1 × 10⁶/mL, developed at 37 degrees Celsius, 5 percent CO2 for 24 h, and then transfection was conducted. The full length of LINC00665 was cloned into a pcDNA3.1 (+) to construct the overexpressed LINC00665 plasmid (pcDNA3.1-LINC00665). A blank vector served as a negative control (Vector). pcDNA3.1-LINC00665, LINC00665 siRNA (5’-UCCUCAGUCUUGGGCUAUUTT-3’), si-NC (5’-UUCUCCGAACGUGUCACGUTT-3’), miR-129-5p mimics (5’-CUUUUUGCGGUCUGGGCUUGC-3’), miR-129-5p inhibitors (5’-GCAAGCCCAGACCGCAAAAAG-3’) and their negative controls (5’-UCACAACCUCCUAGAAAGAGUAGA-3’) were procured from Guangzhou RiboBio Co., Ltd. (Guangzhou, China). Using the LipofectamineTM 2000, the oligonucleotides were transfected into CRC cells at a final dose of 50 nM (Invitrogen). The cell density was adjusted to 30% according to the ratio of 1:3 or 1:2, and the cultivation was sustained for 24 h after 12 h of transfection. After that, the transfection efficacy was detected by RT-PCR.
RNA extraction and RT-PCR
The entire RNA was isolated from tissues or cultivated cells using TRIzol kit (Invitrogen, Shanghai, China). Afterward, RNA was reverse transcribed into complementary DNA (cDNA) using the Reverse Transcription Solution (Takara, Dalian, China). RT-PCR was executed using a Power SYBR Green reagent (Takara). LINC00665, miR-129-5p and HMGB1 relative expressions were calculated by the 2-ΔΔCt means using GAPDH and U6 as the internal references. The primer sequences can be found in Table 1.
Table 1.
Sequences used for qRT-PCR
| LINC00665 | F: AGCACCCCTAGTGTCAGTCA |
| R: TGGTCTCTAGGGAGGCAGAA | |
| miR-129-5p | F: GGGGGCTTTTTGCGGTCTGG |
| R: AGTGCGTGTCGTGGAGTC | |
| U6 | F: CGCTTCGGCAGCACATATAC |
| R: TTCACGAATTTGCGTGTCAT | |
| HMGB1 | F: AATACGAAAAGGATATTGCGT |
| R: GCGCTAAACCAACTTAT | |
| GAPDH | F: TGTCCGTCGTGGATCTGA |
| R: TTGCTGTTGAAGTCGCAGGAG |
Abbreviation: F stands for forward; R stands for reverse; RT stands for reverse transcription.
Cell counting kit-8 (CCK-8 experiment)
First, each set of cells in the exponential growth phase was processed into a single cell suspension and planted on a 96-well plate at 1000 cells per well. After that, each group was divided into six duplicate wells. On the second day, 10 μL of CCK-8 (Dojindo Molecular Technologies, Japan) was supplemented to each well after the cells were attached, and a blank control well comprising only the medium and CCK-8 solution was set up. After 2 h of incubation, the absorbance values of each well were determined and recorded using a microplate reader (Bio-Rad, Hercules, CA, USA) with a wavelength of 450 nm. Finally, the plate was measured every 24 h for 4 days. Time was utilized as the abscissa and OD 450 nm was utilized as the ordinate to plot the cell multiplication curve.
EdU assay
U118 and A172 cells were planted in 24-well plates, respectively. Subsequently, 200 μL of 5 μmol/L EdU solution was supplemented to each well, and the cells were cultivated for 2 h, and washed with PBS. The cells were fixed with paraformaldehyde and incubated for 10 min. After 200 μL of 2 mg/mL glycine was supplemented and the cells were developed for 5 min. 100 μL of 0.5 percent TritonX-100 was supplemented to each well, after that, the cells were cultivated for 10 min on a shaker, and washed twice with PBS for 5 min each time. Following that, the cells were stained using Apollo protected from light for 30 min, and then dyed with 1×Hoechst 33342 DNA staining reagent to incubate for 20 min. Ultimately, the cells were cleaned with PBS and photographed under a fluorescence microscope.
Transwell experiment
Transwell movement and aggressiveness experiments were done to examine cell movement and aggressiveness. 8 μM pore size Transwell chambers (Costar, Cambridge, MA, USA) with Matrigel (Corning, Beijing, China) were applied for the aggressiveness assay, and Matrigel was not applied in the movement experiment. 5 × 10⁴ transfected cells suspended in 150 μL of serum-free medium were positioned in the top compartment. 400 μL of medium including 10% FBS was replenished to the bottom compartment. After incubation at 37 degrees Celsius for 24 h, the cells that did not invade or move were erased from the higher surface of the membrane. After that, the membrane was fixed with 4% paraformaldehyde for 10 min and stained with 0.5% crystal violet solution. After washing with tap water, the cells were counted under a reversed microscope (Olympus, Tokyo, Japan).
Western blot
RIPA lysis solution (Pierce, Rockford, IL, USA) was adopted to lyse the cells, and the supernatant was then harvested after high-speed centrifugation. Afterward, the BCA kit (Pierce, Rockford, IL, USA) was used to quantify the concentration of the protein samples, and the supernatant was heated at 100 degrees Celsius for 10 min to denature the protein. Then the protein specimens were denatured by sodium dodecyl sulfate-polyacrylamide gel electrophoresis (SDS-PAGE). The protein was then electrically transferred to a PVDF membrane. The membrane was washed 3 times with tris buffered saline + tween (TBST) for 10 min each time after being blocked with 5% skim milk for 1 h. Subsequently, the membrane was incubated with primary antibodies anti-HMGB1 (Abcam, ab79823, 1:1000) and anti-GAPDH (Abcam, ab181602, 1:1000). The membrane was developed with HRP conjugated secondary antibody (1:2000, Santa Cruz Biotechnology) for 1 h after being rinsed. Ultimately, the electrochemiluminescence (ECL) kit (Millipore, Bedford, MA, USA) was placed onto the membrane, and the membrane was positioned on an automatic imaging developing device (ChemiDocXRS imaging system) to visualize the protein bands (raw images of the protein bands are in Supplementary Figure 1).
Luciferase reporter experiment
A luciferase reporter gene experiment was executed using the dual-luciferase reporter assay system (Promega, Madison, WI, USA). Fragments of wild type LINC00665 and mutant LINC00665 were established and integrated into pGL3 vector (Promega, Madison, WI, USA) to set up pGL3-LINC00665 wild type (LINC00665-WT) and pGL3-LINC00665-mutant (LINC00665-MUT) reporter vectors. The cells were co-transfected with LINC00665-WT (or LINC00665-MUT) and miR-129-5p mimics (or the negative control). 48 h later, the luciferase activity of the cells in each group was examined according to the directions.
RNA immunoprecipitation
The RIP experiment was implemented using the EZ-Magna RIP kit (Millipore, MA, USA) following the directions. The human anti-Ago2 antibody was obtained from Millipore and the IgG was used as the control. 1 × 10⁷ glioma cells were lysed in 100 μL of RIP lysis solution which contained protease inhibitor cocktail and RNase inhibitors. Next, the antibody coated with magnetic beads was added to incubate with 200 μL of cell lysate at 4°C overnight. Subsequently, after the mixtures were cultivated with proteinase K to remove the protein in the immunoprecipitate, the RNA was extracted, and RNA concentration was determined using a NanoDrop spectrophotometer and LINC00665 expression in the refined RNA was measured by RT-PCR.
In vivo test
For tumorigenesis tests, four-week-old male BALB/c athymic nude mice were utilized. A172 cells transfected with control siRNA or LINC00665 siRNA were inoculated in T75 flasks, and cultured for 48 h. The cells were centrifuged after trypsinization, and A172 cells were rinsed three times with PBS and resuspended in PBS. 100 μL of cell suspension (cell density: 5 × 10⁷ cells/mL) was inoculated into the back of each mouse. Every week, a caliper was utilized to measure the tumor’s longest and shortest diameters. Subsequently, the formula was applied to measure the tumor volume, volume = (length × width2 × 0.5). On the 21st day after the injection, the tumor was carefully peeled off, and the weight of each subcutaneously grown tumor was measured. In the assay to evaluate the aggressiveness of glioma cells, 1 × 10⁷ cells in each group were inoculated into the caudal vein of 10 mice respectively. The mice were sacrificed two weeks later, and lung colonization was measured by pathologic analysis.
Statistical analysis
Statistical analysis was implemented using SPSS statistical software (Chicago, IL, USA). The data were expressed as mean ± standard deviation (SD). The F-test to test was adopted for equal variance, and the unpaired two-tailed t-test with equal variance was utilized to make statistical comparisons. The One-Sample Kolmogorov-Smirnov test was applied to determine whether the data were normally distributed. If they were normally distributed, the paired-sample t test or independent sample t test was exploited to compare measurement statistics between two groups. Comparisons among multiple groups were executed using One-way ANOVA. The Student’s Newman-Keuls analysis was employed to examine the difference between the two groups if the findings indicated significant differences. When the data had a skewed distribution, non-parametric tests were adopted to make comparisons. The paired sample Wilcoxon signed-rank test or the non-parametric Mann-Whitney test was applied to compare the data between two groups. The chi-square test was employed to examine the correlation between LINC00665 expression and the clinicopathological index/MRI signs of the patients. P < 0.05 denoted significance.
Results
LINC00665 was overexpressed in glioma and was closely associated with adverse clinicopathological values and MRI adverse signs
To probe LINC00665 expression characteristics in glioma, RT-PCR was done to examine its expression in 5 normal brain tissues (NBTs) and 25 glioma tissues. The statistics revealed that the LINC00665 expression was up-modulated in glioma tissues relative to NTBs (Figure 1A). Second, by comparing the LINC00665 expression in the NHA cell line and U118, H4, U343, U87, A172 cells, the findings implied that compared to the NHA cell line, LINC00665 expression was also notably up-regulated in the above five glioma cell lines (Figure 1B). Also, by analyzing the relationship among the LINC00665 expression, the clinicopathologic values, and MRI signs of glioma patients, LINC00665 overexpression in glioma was found to be correlated with an increased tumor diameter, increased pathological grade, uneven MRI signal of the tumor, an increase in peritumoral edema, and the tumor enhancement (Figure 2A and 2B; Tables 2 and 3). These data imply that LINC00665 exerted an oncogenic effect in glioma.
Figure 1.
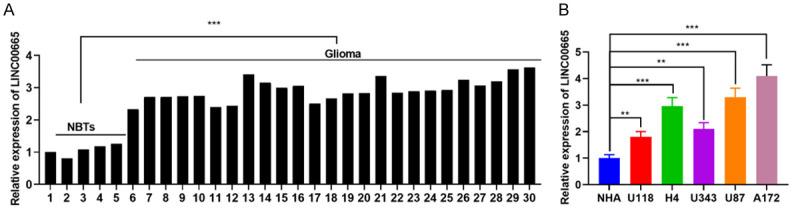
LINC00665 is highly expressed in glioma tissues and cell lines. A. qRT-PCR was used to detect the expression of LINC00665 in glioma tissues and non-cancerous brain tissues. GAPDH was used as the internal control for LINC00665 expression. B. The expression levels of LINC00665 in NHA cells and 5 glioma cell lines were compared. NBTs, normal brain tissues; NHA, normal human astrocytes. **P < 0.01, ***P < 0.001.
Figure 2.
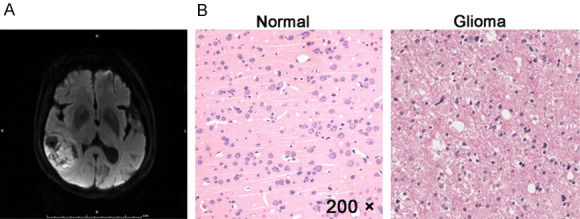
MRI image and H&E representative images of glioma patients. A. A representative MRI image of 77-year-old woman with glioma. B. H&E staining of normal brain tissue and tumor tissues of this patient. MRI, magnetic resonance imaging; H&E, hematoxylin-eosin. Magnification of H&E is 200 ×.
Table 2.
Correlations between LINC00665 expression and clinical characteristics in glioma patients
| Pathologic finding | Number of patients | LINC00665 expression | Chi-square value | P value | |
|---|---|---|---|---|---|
|
| |||||
| High | Low | ||||
| All cases | 25 | 14 | 11 | ||
| Age (years) | |||||
| < 30 | 6 | 5 | 1 | 2.394 | 0.122 |
| ≥ 30 | 19 | 9 | 10 | ||
| Gender | |||||
| Male | 14 | 10 | 4 | 3.074 | 0.079 |
| Female | 11 | 4 | 7 | ||
| Tumor diameter | |||||
| < 3 cm | 8 | 2 | 6 | 4.588 | 0.032 |
| > 3 cm | 17 | 12 | 5 | ||
| Pathologic type | |||||
| Astrocytoma | 12 | 7 | 5 | 0.311 | 0.856 |
| Oligodendroglioma | 10 | 5 | 5 | ||
| Others | 3 | 2 | 1 | ||
| Pathologic grade | |||||
| I-II | 6 | 1 | 5 | 6.860 | 0.045 |
| III | 8 | 4 | 4 | ||
| IV | 11 | 9 | 2 | ||
Table 3.
Correlations between LINC00665 expression and MRI features in glioma patients
| Item | Number of patients | LINC00665 expression | Chi-square value | P value | |
|---|---|---|---|---|---|
|
| |||||
| High | Low | ||||
| All cases | 25 | 14 | 11 | ||
| Tumor signal | |||||
| Uniform | 10 | 3 | 7 | 4.5725 | 0.032 |
| Non-uniform | 15 | 11 | 4 | ||
| Peritumoral edema | |||||
| Mild | 11 | 3 | 8 | 6.5789 | 0.010 |
| Moderate to severe | 14 | 11 | 3 | ||
| Enhancement | |||||
| Mild | 12 | 4 | 8 | 4.8119 | 0.028 |
| Moderate to severe | 13 | 10 | 3 | ||
LINC00665 expression enhanced glioma cell multiplication, movement, and aggressiveness
Since LINC00665 was up-modulated in glioma tissues and cell lines, and was related to adverse clinicopathologic values and adverse MRI signs, we made a hypothesis that it could participate in the progression of glioma. The overexpressing LINC00665 plasmid and LINC00665 siRNA were transfected into U118 and A712 cells, respectively. The efficiency of transfection was subsequently verified by qRT-PCR (Figure 3A). Since siRNA#2 knockdown efficiency was more significant, it was used for further research. CCK-8 and EdU experiments were adopted to examine cell multiplication. The statistics implied that LINC00665 overexpression enhanced U118 cell proliferation (Figure 3B-D). Subsequently, the results of Transwell experiment validated that LINC00665 overexpression notably enhanced cell movement and aggressiveness (Figure 3E, 3F). Contrariwise, knockdown of LINC00665 markedly impeded A172 cell multiplication, movement, and aggressiveness relative to the control group (Figure 3B-F).
Figure 3.

LINC00665 promotes the proliferation, migration, and invasion of glioma cells. A. The overexpressing LINC00665 plasmid and LINC00665 siRNA were transfected into U118 and A712 cells, respectively. Transfection efficiency was detected by qRT-PCR. B-D. CCK-8 assay and EdU assay were used to detect glioma cell proliferation. E, F. Transwell assay was used to detect glioma cell migration and invasion. siRNA, short interfering RNA; qRT-PCR, quantitative real-time polymerase chain reaction; CCK-8: Cell Counting Kit-8; EdU: 5-ethynyl-2’-deoxyuridine. **P < 0.01, ***P < 0.001.
LINC00665 repressed miR-129-5p by sponging it
As a ceRNA, lncRNA has recently been a prominent topic in cancer studies. We supposed that LINC00665 may also affect glioma development by working as a ceRNA. To validate our hypothesis, the StarBase V3.0 online website was explored, and miR-129-5p was demonstrated to be one of the functional target miRNAs of LINC00665 (Figure 4A). Subsequently, miR-129-5p expression in NTBs and glioma tissues was examined by RT-PCR, suggesting that miR-129-5p expression was very diminished in glioma tissues relative to NTBs (Figure 4B). To validate the result of bioinformatics analysis, a dual-luciferase reporter experiment was exploited to explore the interaction of LINC00665 and miR-129-5p. The findings revealed that the miR-129-5p mimics inhibited the luciferase activity of the luciferase reporter-containing LINC00665-wide type (WT), but did not notably affect the luciferase activity of the LINC00665-mutant type (MUT) (Figure 4C). Additionally, the RIP experiment validated that LINC00665 and miR-129-5p were enriched in Ago2-containing microribonucleoproteins (Figure 4D). MiR-129-5p expression was down-modulated following LINC00665 overexpression, and miR-129-5p expression was up-modulated after knockdown of LINC00665 (Figure 4E). Moreover, miR-129-5p expression was notably reduced in the four glioma cell lines relative to NHA (Figure 4F). Finally, a negative association between LINC00665 expression and miR-129-5p expression in glioma tissues was revealed (Figure 4G). In conclusion, LINC00665 adsorbed miR-129-5p and negatively regulated its expression.
Figure 4.

miR-129-5p is a target for LINC00665 in glioma. A. StarBase 3.0 (http://starbase.sysu.edu.cn/index.php) was adopted to predict binding sites between LINC00665 and miR-129-5p. B. qRT-PCR was used to detect the expression of miR-129-5p in glioma tissues and normal brain tissues. C. Luciferase activity was measured after wild-type LINC00665 (or mutant LINC00665), miR-129-5p (or miR-NC) were co-transfected into glioma cells. D. RIP assay was employed to determine the interaction between LINC00665 and miR-129-5p. E. The expression of miR-129-5p was detected by qRT-PCR after up-regulating or down-regulating LINC00665 in glioma cells. F. The expression level of miR-129-5p in NHA cells and glioma cells was detected by qRT-PCR. G. The correlation between LINC00665 and miR-129-5p in glioma tissues of 25 patients was analyzed. qRT-PCR, quantitative real-time polymerase chain reaction; RIP, RNA binding protein immunoprecipitation; NHA, normal human astrocytes. **P < 0.01, ***P < 0.001.
LINC00665 participated in the modulation of malignant characteristics of glioma cell by adsorbing miR-129-5p
Next, U118 cells were co-transfected with LINC00665 overexpression plasmids and miR-129-5p mimics. CCK-8, EdU, and Transwell experiments confirmed that up-regulation of miR-129-5p attenuated the promoting role of LINC00665 overexpression on multiplication and aggressiveness of U118 cells (Figure 5A-C). Conversely, knockdown of LINC00665 caused inhibition of multiplication and aggressiveness of A172 cells, which was partly reversed by miR-129-5p inhibitors (Figure 5A-C). The findings implied that LINC00665 partakes in the modulation of the malignant characteristics of glioma cells by sponging miR-129-5p.
Figure 5.

LINC00665/miR-129-5p axis regulates the malignant phenotype of glioma cells. A, B. CCK-8, EdU assays were used to detect cell proliferation of glioma. C. Transwell assay was employed to detect the invasion and migration of glioma cells. **P < 0.01, ***P < 0.001, Vector vs LINC00665 or si-vector vs si-LINC00665. #P < 0.05, ##P < 0.01, LINC00665 vs LINC00665 + miR-129-5p mimics or si-LINC00665 vs si-LINC00665 + miR-129-5p inhibitors. CCK-8, cell counting kit-8; EdU, 5-ethynyl-2’-deoxyuridine.
miR-129-5p directly targets HMGB1
To find the downstream molecular mechanism of miR-129-5p, the candidate targets of miR-129-5p were analyzed by the TargetScan database, and HMGB1 was among the candidate targets of miR-129-5p, and the binding sites between them are displayed in Figure 6A. Moreover, targeted binding between miR-129-5p and HMGB1 was found using the dual-luciferase gene reporter method. The transfection of miR-129-5p mimics reduced the luciferase activity of wild-type 3’UTR sequence of HMGB1. Nonetheless, it had no notable influence on the luciferase activity of the mutated 3’UTR sequence of HMGB1 (Figure 6B). Additionally, miR-129-5p overexpression down-modulated HMGB1 expression, and miR-129-5p inhibition up-regulated HMGB1 expression at the mRNA and protein levels (Figure 6C, 6D; Supplementary Figure 1). Also, HMGB1 expression was up-regulated after LINC00665 overexpression, whereas HMGB1 expression was down-regulated after knockdown of LINC00665 (Figure 6E, 6F; Supplementary Figure 1). Based on the above findings, we concluded that a LINC00665/miR-129-5p/HMGB1 axis was involved in glioma development.
Figure 6.
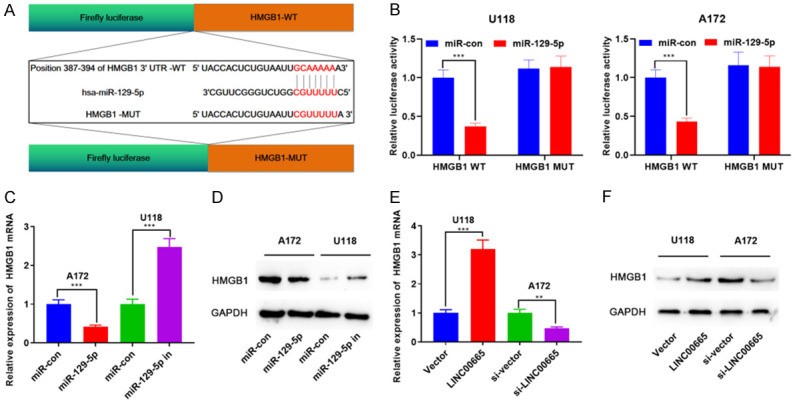
LINC00665/miR-129-5p axis regulates the expression of HMGB1 in glioma. A. The binding sites between miR-129-5p and HMGB1 were analyzed using the TargetScan database (http://www.targetscan.org/vert_72/). B. The interaction between miR-129-5p and HMGB1 was verified using the luciferase reporter gene assay. C-F. After up-regulation or down-regulation of miR-129-5p and LINC00665, the expressions of HMGB1 mRNA and protein were detected by RT-PCR and western, respectively. RT-PCR, real-time quantitative reverse transcription; HMGB1: high mobility group protein 1.
Knockdown of LINC00665 suppressed glioma proliferation and metastasis in vivo
Next, we explored LINC00665’s role in vivo. The tumor size and body weight of each mouse were measured after A172 cells with LINC00665 knockdown and control cells were injected on the back of each mouse. As shown, the tumor size was notably decreased after knocking down LINC00665 relative to the control group (Figure 7A; Supplementary Figure 2). Furthermore, the average tumor weight in the si-LINC00665 group was remarkably lower than in the control group (Figure 7B). RT-PCR showed that LINC00665 expression and HMGB1 mRNA expression were notably down-modulated in the tumors of the mice, and the miR-129-5p expression was significantly increased (Figure 7C-E). Western blot showed that HMGB1 expression was diminished at the protein level after knockdown of LINC00665 (Figure 7F). Furthermore, we constructed a lung metastasis model to test glioma cells’ aggressiveness in vivo. The findings suggested that LINC00665 knockdown impeded lung metastasis of glioma cells (Figure 7G and 7H). These results further proved the oncogenic properties of LINC00665 in glioma.
Figure 7.
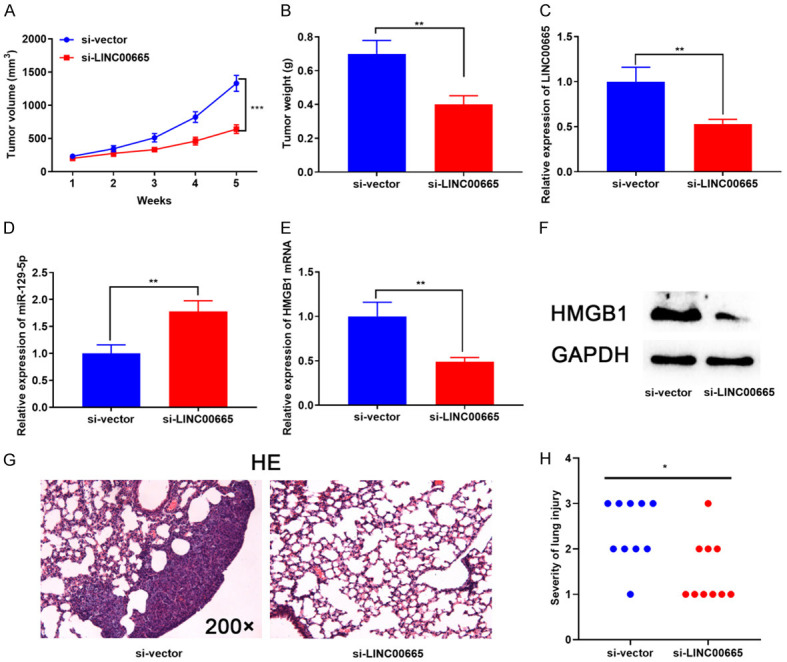
Knockdown of LINC00665 inhibited tumor proliferation and aggressiveness of glioma cells in vivo. (A, B) A172 cells with LINC00665 knockdown and the control cells were subcutaneously injected into nude mice. The tumor volume (A) and weight (B) were measured. (C-E) RT-PCR was used to detect the expression of LINC00665 (C), miR-129-5p (D) and HMGB1 mRNA (E) in mice tissues. (F) The expression of HMGB1 in tumor tissues of mice was detected by western blot. (G, H) H&E staining was used to detect the degree of lung metastasis of glioma cells with LINC00665 knockdown in mice. H&E, hematoxylin-eosin; RT-PCR, real-time quantitative reverse transcription; HMGB1: high mobility group protein 1. Magnification of H&E is 200 ×. **P < 0.01, ***P < 0.001.
Discussion
Reportedly, multiple lncRNAs are aberrantly expressed in different malignancies like glioma [27,28]. The expression level of some lncRNAs in the progression of tumors is up-regulated or down-regulated, and thus they show promise as biomarkers for disease diagnosis and prognosis [29]. In glioma, lncRNA SNHG16 accelerates tumor progression by up-regulating EGFR expression and activating PI3K/AKT pathway [30]; LINC00319 directly binds with TATA-box binding protein associated factor 1 to promote glioma cell proliferation and aggressiveness, and its overexpression is srongly associated with the unfavorable prognosis of patients [31]. By creating a negative feedback loop with AXL, LINC00526 impedes glioma growth [32]. In the current study, LINC00665 was shown to be remarkably up-modulated in glioma tissues and cell lines. Furthermore, LINC00665 overexpression in glioma was closely linked to larger tumor diameter, the increased pathologic grade, heterogeneous MRI signal of the tumor, increased peritumoral edema, and the signal enhancement of MRI image. Up-regulation of LINC00665 significantly promoted glioma cell multiplication, movement, and aggressiveness, and knocking down LINC00665 markedly suppressed the malignant biologic characteristics of glioma cells. Consistently, in vivo research validated that LINC00665 knockdown suppressed the progression of glioma. For the first time, our study suggested that LINC00665 was an oncogenic lncRNA in glioma.
Recent studies have shown that miRNAs are key regulators of tumorigenesis [33]. Investigating the relationship between miRNAs and glioma biologic behavior provides a theoretical foundation for understanding the mechanism of this deadly disease [34]. According to the reports of the previous studies, miR-129-5p shows tumor-suppressive properties in glioma. For example, miR-129-5p represses cell viability, multiplication, movement, and aggressiveness of glioma cells, by binding to the 3’UTR of FNDC3B mRNA [35]. Furthermore, miR-129-5p negatively regulates Wnt5a and blocks PKC/ERK/NF-κB and JNK pathways in glioma, thus suppressing glioma progression [36]. Furthermore, lncRNA can act as a ceRNA to decoy miRNAs and thus participate in the modulation of gene expression. e.g., lncRNA-ZFAS1 enhances glioma progression by adsorbing miR-150-5p and up-regulating PLP2 [37]; LINC00909 acts as a molecular sponge of miR-194 to enhance the aggressiveness of glioma cells [38]. In this study, it was revealed that LINC00665 participated in the modulation of malignant biologic properties of glioma cells as a tumor-promoting factor, whereas miR-129-5p showed tumor-suppressive properties. Interestingly, the binding site of LINC00665 and miR-129-5p was confirmed through bioinformatics, luciferase reporter gene experiments, and RIP experiments. Moreover, LINC00665 up-modulation caused a decrease in the expression of miR-129-5p in glioma cells. Furthermore, we found that the influence of LINC00665 overexpression on glioma cells was partially attenuated by the miR-129-5p mimics. Conversely, the miR-129-5p inhibitor reversed the suppressing impact of knockdown of LINC00665 on glioma cell multiplication and aggressiveness. Therefore, we concluded that LINC00665 was implicated in controlling glioma cells’ multiplication, movement, and aggressiveness by adsorbing miR-129-5p.
HMGB1 is a highly conserved DNA-binding protein that may transfer from the cytoplasm to the nucleus and interacts with transcription elements, nucleosomes, and histones [39]. It is transcribed from chromosome 13q12 and is overexpressed in different malignancies, including prostate carcinoma, NSCLC, and glioma [21,40,41]. In glioma, HMGB1 is associated with aberrant activation of the JAK/STAT pathway and NF-κB pathway [42]. HMGB1 also leads to increased IL-6 expression, and IL-6 further triggers the activation STAT3 via JAK signaling [43]. HMGB1 induces NF-κB activation via RAGE, which in turn activates MMP-2 activation and ultimately leads to colon cancer metastasis [44]. Additionally, some previous studies have shown that HMGB1 is controlled by multiple miRNAs, like miR-142, miR-129-2 and miR-129-5p [45-48]. In this work, luciferase reporter gene experiment revealed that miR-129-5p targeted HMGB1 3’UTR. We also demonstrated that miR-129-5p overexpression induced down-regulation of HMGB1 expression in glioma cells. Conversely, miR-129-5p inhibitor caused up-regulation of HMGB1 expression level. These data are consistent with previous studies on the correlation between miR-129-5p and HMGB1 [47,48]. Furthermore, it was observed that overexpression of LINC00665 promoted the HMGB1 expression in glioma cells; thereby we proposed a novel mechanism during glioma progression, namely a LINC00665/miR-129-5p/HMGB1 axis. Increased HMGB1 is associated with inflammation and edema in the tumor microenvironment of glioma [24,25,49]. Peritumoral edema is more common in high-grade glioma, and it indicates a worse prognosis [50,51]. Interestingly, herein, we determined that LINC00665 overexpression was linked to unfavorable MRI features including severer peritumoral edema, and the regulatory function of LINC00665 on HMGB1 may contribute to this phenomenon.
Conclusion
In summary, we observed high expression of LINC00665 in glioma, and it was associated with malignant clinical characteristics and adverse MRI signs of patients with glioma. In terms of mechanism, functioning as a ceRNA, LINC00665 sponges miR-129-5p to enhance HMGB1 expression. Our research signifies that LINC00665 is a latent therapy target and diagnostic biomarker for glioma.
Acknowledgements
This study was funded by Hainan Key Research and Development Project (ZDYF2020115, ZDYF2022SHFZ022) and the National Natural Science Foundation of China (81960311), and by Hainan Province Clinical Medical Center.
All presentations of case reports have consent for publication.
Disclosure of conflict of interest
None.
Abbreviations
- LncRNAs
Long non-coding RNAs
- RT-PCR
Real-time polymerase chain reaction
- MRI
Magnetic resonance imaging
- CCK-8
Cell Counting Kit-8
- EdU
5-ethynyl-2’-deoxyuridine
- RIP
RNA binding protein immunoprecipitation
- HMGB1
High mobility group protein 1
- miRNAs
microRNAs
- FBS
Fetal bovine serum
- PBS
Phosphate buffer saline
- PVDF
Polyvinylidene fluoride
- HRP
Horseradish peroxidase
- NBTs
Normal brain tissues
- NHA
Normal human astrocyte
- ceRNA
competitive endogenous RNA
- WT
Wide type
- MUT
Mutant type
- GAPDH
Glyceraldehyde 3-phosphate dehydrogenase
- IBCB
Institute of Biochemistry and Cell Biology
- CAS
Chinese Academy of Sciences
Supporting Information
References
- 1.Xie Z, Li X, Chen H, Zeng A, Shi Y, Tang Y. The lncRNA-DLEU2/miR-186-5p/PDK3 axis promotes the progress of glioma cells. Am J Transl Res. 2019;11:4922–4934. [PMC free article] [PubMed] [Google Scholar]
- 2.Molinaro AM, Taylor JW, Wiencke JK, Wrensch MR. Genetic and molecular epidemiology of adult diffuse glioma. Nat Rev Neurol. 2019;15:405–417. doi: 10.1038/s41582-019-0220-2. [DOI] [PMC free article] [PubMed] [Google Scholar]
- 3.Ahammed Muneer KV, Rajendran VR, K PJ. Glioma tumor grade identification using artificial intelligent techniques. J Med Syst. 2019;43:113. doi: 10.1007/s10916-019-1228-2. [DOI] [PubMed] [Google Scholar]
- 4.Petrescu GED, Sabo AA, Torsin LI, Calin GA, Dragomir MP. MicroRNA based theranostics for brain cancer: basic principles. J Exp Clin Cancer Res. 2019;38:231. doi: 10.1186/s13046-019-1180-5. [DOI] [PMC free article] [PubMed] [Google Scholar]
- 5.Sheng J, Wang L, Han Y, Chen W, Liu H, Zhang M, Deng L, Liu YN. Dual roles of protein as a template and a sulfur provider: a general approach to metal sulfides for efficient photothermal therapy of cancer. Small. 2018;14 doi: 10.1002/smll.201702529. [DOI] [PubMed] [Google Scholar]
- 6.Jiang MC, Ni JJ, Cui WY, Wang BY, Zhuo W. Emerging roles of lncRNA in cancer and therapeutic opportunities. Am J Cancer Res. 2019;9:1354–1366. [PMC free article] [PubMed] [Google Scholar]
- 7.Rynkeviciene R, Simiene J, Strainiene E, Stankevicius V, Usinskiene J, Miseikyte Kaubriene E, Meskinyte I, Cicenas J, Suziedelis K. Non-coding RNAs in glioma. Cancers (Basel) 2018;11:17. doi: 10.3390/cancers11010017. [DOI] [PMC free article] [PubMed] [Google Scholar]
- 8.Lu CW, Zhou DD, Xie T, Hao JL, Pant OP, Lu CB, Liu XF. HOXA11 antisense long noncoding RNA (HOXA11-AS): a promising lncRNA in human cancers. Cancer Med. 2018;7:3792–3799. doi: 10.1002/cam4.1571. [DOI] [PMC free article] [PubMed] [Google Scholar]
- 9.Peng Z, Liu C, Wu M. New insights into long noncoding RNAs and their roles in glioma. Mol Cancer. 2018;17:61. doi: 10.1186/s12943-018-0812-2. [DOI] [PMC free article] [PubMed] [Google Scholar]
- 10.Xu Y, Li J, Wang P, Zhang Z, Wang X. LncRNA HULC promotes lung squamous cell carcinoma by regulating PTPRO via NF-κB. J Cell Biochem. 2019;120:19415–19421. doi: 10.1002/jcb.29119. [DOI] [PubMed] [Google Scholar]
- 11.Shi D, Wu F, Mu S, Hu B, Zhong B, Gao F, Qing X, Liu J, Zhang Z, Shao Z. LncRNA AFAP1-AS1 promotes tumorigenesis and epithelial-mesenchymal transition of osteosarcoma through RhoC/ROCK1/p38MAPK/Twist1 signaling pathway. J Exp Clin Cancer Res. 2019;38:375. doi: 10.1186/s13046-019-1363-0. [DOI] [PMC free article] [PubMed] [Google Scholar]
- 12.Liu X, Lu X, Zhen F, Jin S, Yu T, Zhu Q, Wang W, Xu K, Yao J, Guo R. LINC00665 induces acquired resistance to gefitinib through recruiting EZH2 and activating PI3K/AKT pathway in NSCLC. Mol Ther Nucleic Acids. 2019;16:155–161. doi: 10.1016/j.omtn.2019.02.010. [DOI] [PMC free article] [PubMed] [Google Scholar]
- 13.Wen DY, Lin P, Pang YY, Chen G, He Y, Dang YW, Yang H. Expression of the long intergenic non-protein coding RNA 665 (LINC00665) gene and the cell cycle in hepatocellular carcinoma using the cancer genome atlas, the gene expression omnibus, and quantitative real-time polymerase chain reaction. Med Sci Monit. 2018;24:2786–2808. doi: 10.12659/MSM.907389. [DOI] [PMC free article] [PubMed] [Google Scholar]
- 14.Qi H, Xiao Z, Wang Y. Long non-coding RNA LINC00665 gastric cancer tumorigenesis by regulation miR-149-3p/RNF2 axis. Onco Targets Ther. 2019;12:6981–6990. doi: 10.2147/OTT.S214588. [DOI] [PMC free article] [PubMed] [Google Scholar]
- 15.Ye J, Xu M, Tian X, Cai S, Zeng S. Research advances in the detection of miRNA. J Pharm Anal. 2019;9:217–226. doi: 10.1016/j.jpha.2019.05.004. [DOI] [PMC free article] [PubMed] [Google Scholar]
- 16.Orso F, Quirico L, Dettori D, Coppo R, Virga F, Ferreira LC, Paoletti C, Baruffaldi D, Penna E, Taverna D. Role of miRNAs in tumor and endothelial cell interactions during tumor progression. Semin Cancer Biol. 2020;60:214–224. doi: 10.1016/j.semcancer.2019.07.024. [DOI] [PubMed] [Google Scholar]
- 17.Saul MJ, Emmerich AC, Steinhilber D, Suess B. Regulation of eicosanoid pathways by microRNAs. Front Pharmacol. 2019;10:824. doi: 10.3389/fphar.2019.00824. [DOI] [PMC free article] [PubMed] [Google Scholar]
- 18.Qiu Z, Wang X, Shi Y, Da M. miR-129-5p suppresses proliferation, migration, and induces apoptosis in pancreatic cancer cells by targeting PBX3. Acta Biochim Biophys Sin (Shanghai) 2019;51:997–1007. doi: 10.1093/abbs/gmz096. [DOI] [PubMed] [Google Scholar]
- 19.Wang YF, Yang HY, Shi XQ, Wang Y. Upregulation of microRNA-129-5p inhibits cell invasion, migration and tumor angiogenesis by inhibiting ZIC2 via downregulation of the hedgehog signaling pathway in cervical cancer. Cancer Biol Ther. 2018;19:1162–1173. doi: 10.1080/15384047.2018.1491497. [DOI] [PMC free article] [PubMed] [Google Scholar]
- 20.Gu X, Gong H, Shen L, Gu Q. MicroRNA-129-5p inhibits human glioma cell proliferation and induces cell cycle arrest by directly targeting DNMT3A. Am J Transl Res. 2018;10:2834–2847. [PMC free article] [PubMed] [Google Scholar]
- 21.Lv DJ, Song XL, Huang B, Yu YZ, Shu FP, Wang C, Chen H, Zhang HB, Zhao SC. HMGB1 promotes prostate cancer development and metastasis by interacting with brahma-related gene 1 and activating the akt signaling pathway. Theranostics. 2019;9:5166–5182. doi: 10.7150/thno.33972. [DOI] [PMC free article] [PubMed] [Google Scholar]
- 22.Satoh M, Taira K, Hara T, Siba J, Takeuchi M. High mobility group box 1 can be used to monitor perioperative course in patients with liver cancer. Surg Oncol. 2020;33:216–221. doi: 10.1016/j.suronc.2019.08.001. [DOI] [PubMed] [Google Scholar]
- 23.Gu J, Xu R, Li Y, Zhang J, Wang S. MicroRNA-218 modulates activities of glioma cells by targeting HMGB1. Am J Transl Res. 2016;8:3780–3790. [PMC free article] [PubMed] [Google Scholar]
- 24.Hong B, Muili K, Bolyard C, Russell L, Lee TJ, Banasavadi-Siddegowda Y, Yoo JY, Yan Y, Ballester LY, Bockhorst KH, Kaur B. Suppression of HMGB1 released in the glioblastoma tumor microenvironment reduces tumoral edema. Mol Ther Oncolytics. 2019;12:93–102. doi: 10.1016/j.omto.2018.11.005. [DOI] [PMC free article] [PubMed] [Google Scholar]
- 25.Cheng P, Ma Y, Gao Z, Duan L. High mobility group box 1 (HMGB1) predicts invasion and poor prognosis of glioblastoma multiforme via activating AKT signaling in an autocrine pathway. Med Sci Monit. 2018;24:8916–8924. doi: 10.12659/MSM.912104. [DOI] [PMC free article] [PubMed] [Google Scholar]
- 26.Zhou YL, Li Y, Luo DM, Ding Y, Hodgson P. Microstructures, mechanical and corrosion properties and biocompatibility of as extruded Mg-Mn-Zn-Nd alloys for biomedical applications. Mater Sci Eng C Mater Biol Appl. 2015;49:93–100. doi: 10.1016/j.msec.2014.12.057. [DOI] [PubMed] [Google Scholar]
- 27.Chi Y, Wang D, Wang J, Yu W, Yang J. Long Non-coding RNA in the pathogenesis of cancers. Cells. 2019;8:1015. doi: 10.3390/cells8091015. [DOI] [PMC free article] [PubMed] [Google Scholar]
- 28.Xin S, Huang K, Zhu XG. Non-coding RNAs: regulators of glioma cell epithelial-mesenchymal transformation. Pathol Res Pract. 2019;215:152539. doi: 10.1016/j.prp.2019.152539. [DOI] [PubMed] [Google Scholar]
- 29.Zhong Y, Wu X, Li Q, Ge X, Wang F, Wu P, Deng X, Miao L. Long noncoding RNAs as potential biomarkers and therapeutic targets in gallbladder cancer: a systematic review and meta-analysis. Cancer Cell Int. 2019;19:169. doi: 10.1186/s12935-019-0891-1. [DOI] [PMC free article] [PubMed] [Google Scholar]
- 30.Zhou XY, Liu H, Ding ZB, Xi HP, Wang GW. lncRNA SNHG16 promotes glioma tumorigenicity through miR-373/EGFR axis by activating PI3K/AKT pathway. Genomics. 2020;112:1021–1029. doi: 10.1016/j.ygeno.2019.06.017. [DOI] [PubMed] [Google Scholar]
- 31.Li Q, Wu Q, Li Z, Hu Y, Zhou F, Zhai Z, Yue S, Tian H. LncRNA LINC00319 is associated with tumorigenesis and poor prognosis in glioma. Eur J Pharmacol. 2019;861:172556. doi: 10.1016/j.ejphar.2019.172556. [DOI] [PubMed] [Google Scholar]
- 32.Yan J, Xu C, Li Y, Tang B, Xie S, Hong T, Zeng E. Long non-coding RNA LINC00526 represses glioma progression via forming a double negative feedback loop with AXL. J Cell Mol Med. 2019;23:5518–5531. doi: 10.1111/jcmm.14435. [DOI] [PMC free article] [PubMed] [Google Scholar]
- 33.Cui M, Wang H, Yao X, Zhang D, Xie Y, Cui R, Zhang X. Circulating microRNAs in cancer: potential and challenge. Front Genet. 2019;10:626. doi: 10.3389/fgene.2019.00626. [DOI] [PMC free article] [PubMed] [Google Scholar]
- 34.Nappi L, Nichols C. MicroRNAs as biomarkers for germ cell tumors. Urol Clin North Am. 2019;46:449–457. doi: 10.1016/j.ucl.2019.04.011. [DOI] [PubMed] [Google Scholar]
- 35.Xu H, Hu Y, Qiu W. Potential mechanisms of microRNA-129-5p in inhibiting cell processes including viability, proliferation, migration and invasiveness of glioblastoma cells U87 through targeting FNDC3B. Biomed Pharmacother. 2017;87:405–411. doi: 10.1016/j.biopha.2016.12.100. [DOI] [PubMed] [Google Scholar]
- 36.Zeng A, Yin J, Li Y, Li R, Wang Z, Zhou X, Jin X, Shen F, Yan W, You Y. miR-129-5p targets Wnt5a to block PKC/ERK/NF-κB and JNK pathways in glioblastoma. Cell Death Dis. 2018;9:394. doi: 10.1038/s41419-018-0343-1. [DOI] [PMC free article] [PubMed] [Google Scholar]
- 37.Li X, Luo Y, Liu L, Cui S, Chen W, Zeng A, Shi Y, Luo L. The long noncoding RNA ZFAS1 promotes the progression of glioma by regulating the miR-150-5p/PLP2 axis. J Cell Physiol. 2020;235:2937–2946. doi: 10.1002/jcp.29199. [DOI] [PubMed] [Google Scholar]
- 38.Liu Z, Lu C, Hu H, Cai Z, Liang Q, Sun W, Jiang L, Hu G. LINC00909 promotes tumor progression in human glioma through regulation of miR-194/MUC1-C axis. Biomed Pharmacother. 2019;116:108965. doi: 10.1016/j.biopha.2019.108965. [DOI] [PubMed] [Google Scholar]
- 39.Bianchi ME, Agresti A. HMG proteins: dynamic players in gene regulation and differentiation. Curr Opin Genet Dev. 2005;15:496–506. doi: 10.1016/j.gde.2005.08.007. [DOI] [PubMed] [Google Scholar]
- 40.Tu L, Long X, Song W, Lv Z, Zeng H, Wang T, Liu X, Dong J, Xu P. MiR-34c acts as a tumor suppressor in non-small cell lung cancer by inducing endoplasmic reticulum stress through targeting HMGB1. Onco Targets Ther. 2019;12:5729–5739. doi: 10.2147/OTT.S206932. [DOI] [PMC free article] [PubMed] [Google Scholar]
- 41.Li H, Li J, Zhang G, Da Q, Chen L, Yu S, Zhou Q, Weng Z, Xin Z, Shi L, Ma L, Huang A, Qi S, Lu Y. HMGB1-induced p62 overexpression promotes snail-mediated epithelial-mesenchymal transition in glioblastoma cells via the degradation of GSK-3β. Theranostics. 2019;9:1909–1922. doi: 10.7150/thno.30578. [DOI] [PMC free article] [PubMed] [Google Scholar]
- 42.Angelopoulou E, Piperi C, Adamopoulos C, Papavassiliou AG. Pivotal role of high-mobility group box 1 (HMGB1) signaling pathways in glioma development and progression. J Mol Med (Berl) 2016;94:867–874. doi: 10.1007/s00109-016-1435-y. [DOI] [PubMed] [Google Scholar]
- 43.Chen M, Liu Y, Varley P, Chang Y, He XX, Huang H, Tang D, Lotze MT, Lin J, Tsung A. High-mobility group box 1 promotes hepatocellular carcinoma progression through miR-21-mediated matrix metalloproteinase activity. Cancer Res. 2015;75:1645–1656. doi: 10.1158/0008-5472.CAN-14-2147. [DOI] [PMC free article] [PubMed] [Google Scholar]
- 44.Zhu L, Li X, Chen Y, Fang J, Ge Z. High-mobility group box 1: a novel inducer of the epithelial-mesenchymal transition in colorectal carcinoma. Cancer Lett. 2015;357:527–534. doi: 10.1016/j.canlet.2014.12.012. [DOI] [PubMed] [Google Scholar]
- 45.Zhang R, Jin H, Lou F. The long non-coding RNA TP73-AS1 interacted with miR-142 to modulate brain glioma growth through HMGB1/RAGE pathway. J Cell Biochem. 2018;119:3007–3016. doi: 10.1002/jcb.26021. [DOI] [PubMed] [Google Scholar]
- 46.Yang Y, Huang JQ, Zhang X, Shen LF. MiR-129-2 functions as a tumor suppressor in glioma cells by targeting HMGB1 and is down-regulated by DNA methylation. Mol Cell Biochem. 2015;404:229–239. doi: 10.1007/s11010-015-2382-6. [DOI] [PMC free article] [PubMed] [Google Scholar]
- 47.Wang S, Chen Y, Yu X, Lu Y, Wang H, Wu F, Teng L. miR-129-5p attenuates cell proliferation and epithelial mesenchymal transition via HMGB1 in gastric cancer. Pathol Res Pract. 2019;215:676–682. doi: 10.1016/j.prp.2018.12.024. [DOI] [PubMed] [Google Scholar]
- 48.Ma XL, Li SY, Shang F. Effect of microRNA-129-5p targeting HMGB1-RAGE signaling pathway on revascularization in a collagenase-induced intracerebral hemorrhage rat model. Biomed Pharmacother. 2017;93:238–244. doi: 10.1016/j.biopha.2017.06.012. [DOI] [PubMed] [Google Scholar]
- 49.Gupta P, Ghosh S, Nagarajan A, Mehta VS, Sen E. β-defensin-3 negatively regulates TLR4-HMGB1 axis mediated HLA-G expression in IL-1β treated glioma cells. Cell Signal. 2013;25:682–689. doi: 10.1016/j.cellsig.2012.12.001. [DOI] [PubMed] [Google Scholar]
- 50.Jeong KH, Song YJ, Han JY, Kim KU. Relationship between cytogenetic complexity and peritumoral edema in high-grade astrocytoma. Ann Lab Med. 2016;36:583–589. doi: 10.3343/alm.2016.36.6.583. [DOI] [PMC free article] [PubMed] [Google Scholar]
- 51.Wu CX, Lin GS, Lin ZX, Zhang JD, Chen L, Liu SY, Tang WL, Qiu XX, Zhou CF. Peritumoral edema on magnetic resonance imaging predicts a poor clinical outcome in malignant glioma. Oncol Lett. 2015;10:2769–2776. doi: 10.3892/ol.2015.3639. [DOI] [PMC free article] [PubMed] [Google Scholar]
Associated Data
This section collects any data citations, data availability statements, or supplementary materials included in this article.