

Abstract
Cervical cancer (CC) is one of the most common gynecological malignancies that endangers women's health. A negative effect of glycolysis is that it contributes to abnormal tumor growth. MicroRNA (miR)-99a expression has been found to be decreased in CC. The present study aimed to investigate the role of miR-99a-5p in glycolysis in CC. For this purpose, the association between miR-99a and the prognosis of patients with CC from The Cancer Genome Atlas database was analyzed using Kaplan-Meier analysis. miR-99a-5p expression and Ras-related GTP binding D (RRAGD) expression were assessed using reverse transcription-quantitative PCR and western blot analysis. Cell proliferation and apoptosis were examined using an MTT assay and flow cytometry, respectively. Glucose uptake, lactate concentration and extracellular acidification rate were measured using a glucose uptake colorimetric assay, a lactate colorimetric assay and a Seahorse XFe96 extracellular flux analyzer, respectively. The association between miR-99a-5p and RRAGD was predicted using TargetScan 7.1, and was confirmed using dual luciferase reporter assay. The results revealed that miR-99a-5p expression was decreased and that of RRAGD was increased in CC tissues and cell lines. RRAGD was negatively regulated by miR-99a-5p. The overexpression of miR-99a-5p induced apoptosis and inhibited glycolysis in CC cells by targeting RRAGD. On the whole, the present study revealed a novel mechanism through which miR-99a-5p regulates cell apoptosis and glycolysis in CC, thus providing a potential therapeutic target for CC.
Keywords: microRNA-99a-5p, cervical cancer, cell apoptosis, glycolysis, Ras-related GTP binding D
Introduction
Cervical cancer (CC) is a malignant tumor that occurs in the cervical region and it severely endangers a woman's health. CC was the fourth most common gynecological malignancy in developing countries in 2019 (1,2). Carbohydrates provide energy for essential biochemical processes, and glycolysis is the main process through which organisms, including cancer cells, obtain energy (3). Even though cellular oxygen is adequate, tumor cells rely on aerobic glycolysis, and not on mitochondrial oxidative phosphorylation to generate energy (4). Glycolysis and adenosine triphosphate (ATP) generation are crucial to the development of cancers, including growth, metastasis and chemoresistance (5,6). A negative effect of the glycolysis pathway is that it leads to the abnormal growth and proliferation of cancer cells (7). Tumor glycolysis has also been reported to be a target for cancer therapy (6). Therefore, it is of utmost importance to determine the specific molecules regulating glycolysis in CC.
Studies have demonstrated that a number of crucial intracellular mechanisms are related to the proliferation and apoptosis of cancer cells (8,9). MicroRNAs (miRNAs/miRs) are a type of non-coding RNA, which can bind to target mRNAs to inhibit their translation (10,11). miRNAs are widely involved in various physiological and pathological processes of tumor cells by regulating the expression of oncogenes and tumor suppressors (12,13). It has been demonstrated that miRNA expression levels are dysregulated in CC tissues and cell lines, and this dysregulated expression plays crucial roles in the pathological process of CC (14,15). In 2018, a bioinformatics study indicated that the downregulation of miR-99a was closely related to the 5-year survival rate of patients with CC (16). In 2019, miR-99a was reported to be decreased in cervical intraepithelial neoplasia (CIN) vs. normal tissue, and in cervical squamous cell carcinoma (CSCC) vs. CIN, suggesting that miR-99a may be involved in the pathogenesis of CIN and in the progression of CIN to CSCC (17). However, the distinct roles of miR-99a-5p in glycolysis in CC have not yet been fully elucidated. Thus, the present study aimed to explore the potential functions of this miRNA in glycolysis in CC.
Materials and methods
Antibodies and reagents
The primary and secondary antibodies used in the present study were as follows: Ras-related GTP-binding protein D (RRAGD; cat. no. A304-301A-T; Thermo Fisher Scientific, Inc.), GAPDH (cat. no. A300-642A-T; Thermo Fisher Scientific, Inc.), goat anti-rabbit (cat. no. 7074; Cell Signaling Technology, Inc.) and horse anti-mouse (cat. no. 7076; Cell Signaling Technology, Inc.).
The reagents used were as follows: FBS, DMEM, penicillin-streptomycin, Lipofectamine 2000®, TRIzol® reagent (all from Thermo Fisher Scientific, Inc.); the PrimeScript qRT Reagent kit (Takara Bio, Inc.), SYBR-Green Mix (Roche Diagnostics), the Dual Luciferase Assay System (Promega Corporation), protease inhibitor cocktail (Sigma-Aldrich; Merck KGaA), RIPA buffer (Roche Diagnostics), chemical HRP substrate (MilliporeSigma), the Annexin-V/Dead Cell Apoptosis kit, glucose uptake colorimetric assay kit (BioVision, Inc.), 2-(N-(7-nitrobenz-2-oxa-1,3-diazol-4-yl)amino)-2-deoxyglucose (2-NBDG; Sigma-Aldrich; Merck KGaA), Krebs-ringer-phosphate-HEPES (KRPH; Thermo Fisher Scientific, Inc.), the lactate colorimetric assay kit (BioVision, Inc.) and the XF Glycolysis Stress Test kit (Seahorse Bioscience).
Specimens
In total, 21 pairs of CC tissues and matched normal tissues were obtained from patients (47±6 years; range, 41–59 years) with CC at the Wuhan Third Hospital (Tongren Hospital of Wuhan University, Wuhan, China) between February 2018 and March 2019. Patients who received chemotherapy or radiotherapy were excluded. Written informed consent was provided by all participants prior to the initiation of the study. The present study was approved by the Ethics Committee of Wuhan Third Hospital (approval no. WHTH-2018-07). Tissues were collected for use in subsequent experiments or stored in −80°C if not used immediately.
Cell culture and transfection
The Ect1 (cat. no. CRL-2614), HeLa (cat. no. CRM-CCL-2), C33A (cat. no. HTB-31) and SiHa (cat. no. HTB-35) cells were obtained from the American Type Culture Collection (ATCC) and cultured in DMEM containing 10% FBS, incubated with 5% CO2 and 37°C. miR-99a-5p mimic and miR-NC mimic were purchased from Shanghai GenePharma Co., Ltd. Transfection of pcDNA3.1-RRAGD plasmid (30 µg), pcDNA3.1 plasmid (30 µg), miR-99a-5p mimic (100 nM; 5′-AACCCGUAGAUCCGAUCUUGUG-3′) and miR-NC mimic (100 nM; 5′-UUGUACUACACAAAAGUACUG-3′) was performed at 37°C for 48 h using Lipofectamine 2000 (Thermo Fisher Scientific, Inc.). At 48 h after transfection, cells were collected for the subsequent experimentation.
Reverse transcription-quantitative PCR (RT-qPCR)
Total RNA was extracted from CC tissues or Ect1, HeLa, C33A and SiHa cell lines using TRIzol® reagent and reverse transcribed into cDNA using the PrimeScript™ qRT reagent kit with the following thermocycling conditions: A total of three cycles at 37°C for 15 min, termination at 85°C for 5 sec, and maintenance at 4°C. qPCR was performed using SYBR-Green mix on an ABI Prism 7500 system (Thermo Fisher Scientific, Inc.) with the following thermocycling conditions: 95°C for 5 min (initial denaturation), followed by 40 cycles at 95°C for 30 sec, 55°C for 30 sec, 72°C for 45 sec, with a final extension at 72°C for 10 min. GAPDH and U6 served as an internal control for RRAGD and miR-99a-5p, respectively. The sequences of all primers used are listed in Table I. The relative expression levels were analyzed using the 2−∆∆Cq method (18).
Table I.
Primer sequences.
| Gene name | Primer sequences (5′-3′) |
|---|---|
| miR-99a-5p | F: AACCCGTAGATCCGATCTTGTG |
| R: CACAAGATCGGATCTACGGGTT | |
| U6 | F: CTCGCTTCGGCAGCACATA |
| R: AACGATTCACGAATTTGCGT | |
| RRAGD | F: CTAGCGGACTACGGAGACG |
| R: ATGAGCAGGATTCTCGGCTTC | |
| GAPDH | F: GAAGGTGAAGGTCGGAGTC |
| R: GAAGATGGTGATGGGATTTC |
F, forward; R, reverse; miR, microRNA; RRAGD, Ras-related GTP binding D.
Western blot analysis
The Ect1 and SiHa cells were washed in PBS, and harvested before being lysed using RIPA buffer (Beyotime Institute of Biotechnology) containing protease inhibitor cocktail. Protein concentration was evaluated using a Pierce BCA protein assay kit (Thermo Fisher Scientific, Inc.). The protein samples (15 µg) were then mixed with SDS loading buffer, before separating by 8% SDS-PAGE, and electro-transferring onto a PVDF filter. The filter was then blocked with 5% BSA (Thermo Fisher Scientific, Inc.) in TBST (0.2% Tween-20) at room temperature for 2 h and incubated overnight at 4°C with anti-RRAGD (1:2,000) or anti-GAPDH (1:2,000) antibodies in TBST. This was followed by washing and incubation with appropriate HRP-labeled secondary antibodies (1:1,000) for 1 h at room temperature. After washing thoroughly, the HRP signals were detected using an ECL Prime detection reagent (Thermo Fisher Scientific, Inc.). Band intensity was quantified using ImageJ software (version 1.8.0; National Institutes of Health).
MTT assay
Following culture for 24, 48 and 72 h, each well of SiHa cells (3×10⁴ cells/well) was incubated at 37°C for 3 h with 20 µl (5 mg/ml) MTT solution. Following incubation for 3 h, 100 µl dimethyl sulfoxide (DMSO) was added to each well for dye extraction. After shaking for 15 min, the absorbance of the cells was recorded at 570 nm using a microplate reader.
Flow cytometric analysis of apoptosis
Each group of cultured SiHa cells was washed and harvested with PBS. The cells (1×10⁶) were then suspended in 100 µl PBS and mixed with Annexin V-FITC and propidium iodide (PI), and then incubated for 10–15 min in a dark at room temperature. After washing with PBS, the cells were then analyzed using a BD FACSCalibur™ flow cytometer (BD Biosciences), and Annexin V-FITC positive cells were considered apoptotic (early + late apoptosis was assessed). Data were analyzed using FlowJo (version 7.6.3; FlowJo LLC).
Glucose uptake and lactate production measurement
For the measurement of glucose uptake, SiHa cells were measured using a glucose uptake colorimetric assay kit. A total of 2×10³ cells were placed in a 96-well plate and starved with serum-free DMEM for 12 h. The SiHa cells were then incubated at room temperature with KRPH with 2% BSA. After 30 min, 10 µl 2-NBDG were added to each well and incubated for 20 min at room temperature. Nicotinamide adenine dinucleotide phosphate generation was determined using an enzymatic recycling amplification reaction. The absorbance at 412 nm was recorded using a GloMax®Discover Microplate Reader (Promega Corporation).
For the measurement of lactate production, the SiHa cells were harvested and suspended in fresh DMEM without pyruvic acid and seeded in a 96-well plate at a density of 2×10³ cells/well. After 6 h, 100 µl culture medium was collected and diluted with 0.5 ml KRPH buffer. The lactate concentration was determined using a lactate colorimetric assay kit according to the manufacturer's protocol. The absorbance at 450 nm was also recorded using a GloMax®Discover Microplate Reader and normalized to the protein concentration.
Extracellular acidification rate (ECAR) assay
The SiHa cells were placed in an XFe96 plate at a density of 1×10⁴ cells/well and incubated for 12 h at 37°C. At 1 h before measurement, the medium was replaced with XF medium. The XF Glycolysis Stress Test kit was used to detect the glycolytic capacity according to the manufacturer's protocol. After 20, 50 and 80 min, glucose (10 mM), oligomycin (1 mM) and 2-deoxy glucose (2-DG; 50 mM) were diluted into XF medium and the ECAR assay was performed using a Seahorse XFe96 extracellular flux analyzer (Seahorse Bioscience).
Dual luciferase reporter assay
To explore the targets of miR-99a-5p in regulating CC cell apoptosis, the TargetScan 7.1 website (TargetScanHuman 7.1) was searched. Wild-type (WT) or mutant type (Mut) RRAGD 3′ untranslated region (3′-UTR) sequences were constructed into the pGL3-luciferase reporter plasmid (Promega Corporation), and co-transfected with miR-99a-5p/NC mimics (100 nM) into SiHa cells (1×10⁵/well) using Lipofectamine 2000 (Thermo Fisher Scientific, Inc.). At 48 h post-transfection, the cells were transferred to a 24-well culture dish. The Dual Luciferase Assay System (Promega Corporation) was used to measure the luciferase activities. Renilla luciferase activity was used as the reference control.
Statistical analysis
All data were analyzed using GraphPad Prism 6.0 (GraphPad Software, Inc.) and are presented as the mean ± SD. Kaplan-Meier analysis and log-rank testing were used to analyze the association between miR-99a and the prognosis of patients with CC from the Cancer Genome Atlas database. Differences between two groups were compared using a paired (tissues) and unpaired (cell lines) Student's t-test, and differences among three groups were compared using one-way ANOVA followed by a Tukey's post hoc test. Pearson's correlation analysis was used to analyze the correlation between miR-99a-5p and RRAGD expression in CC tissues. A value of P<0.05 was considered to indicate a statistically significant difference. Each experiment was replicated at least three times.
Results
miR-99a-5p expression is decreased in CC tissues and cell lines
Firstly, the present study aimed to determine whether the expression level of miR-99a was related to the survival rate of patients with CC; thus, Kaplan-Meier analysis was performed. The results revealed that the patients with a high expression of miR-99a had a higher survival rate than those in the low expression group (Fig. 1A). In order to further confirm the association between the miR-99a-5p expression level and CC, its expression was examined using RT-qPCR in CC tissues and various cell lines. The results demonstrated that the expression level of miR-99a-5p was significantly decreased in CC tissues (Fig. 1B) and cell lines, including HeLa, C33A and SiHa cells (Fig. 1C). Among the three different cell lines, the SiHa cells exhibited the lowest expression of miR-99a-5p, and were thus used in the following experiments.
Figure 1.

miR-99a-5p is decreased in CC tissues and cell lines. (A) Kaplan-Meier analysis showed the association between miR-99a expression and the prognosis of patients with CC from the Cancer Genome Atlas database. (B) RT-qPCR revealed the difference in miR-99a-5p expression between normal tissues and CC tissues collected from the patients in the present study. (C) RT-qPCR revealed the difference in miR-99a-5p expression between normal and CC cell lines. **P<0.01 vs. Ect1 cells and ***P<0.001 vs. normal tissues and Ect1 cells. miR, microRNA; CC, cervical cancer; RT-qPCR, reverse transcription-quantitative PCR; hsa, homo sapiens.
Moreover, in the collected tumor tissues from patients with CC, the miR-99a-5p level was found to be associated with the FIGO stage, but not with age or tumor size (Table II).
Table II.
Association between miR-99a-5p expression levels and clinicopathological characteristics of patients with cervical cancer.
| Expression level of miR-99a-5p | |||
|---|---|---|---|
|
|
|||
| Clinicopathological characteristics | Low (n=10) | High (n=11) | P-value |
| Age, years | 0.659 | ||
| <45 | 3 | 5 | |
| ≥45 | 7 | 6 | |
| Tumor size, cm | 0.395 | ||
| <4 | 6 | 4 | |
| ≥4 | 4 | 7 | |
| FIGO stages | 0.031 | ||
| I–II | 2 | 8 | |
| III–IV | 8 | 3 | |
miR, microRNA.
miR-99a-5p promotes the apoptosis and reduces the glycolysis of CC cells
In order to examine whether miR-99a-5p affects the survival of SiHa cells, miR-99a-5p was overexpressed in SiHa cells using a miRNA mimic (Fig. 2A). It was found that transfection with miR-99a-5p mimic significantly reduced the number of SiHa cells (Fig. 2B). To determine whether miR-99a-5p affects the apoptosis of SiHa cells, flow cytometry was performed. As shown in Fig. 2C and D, transfection with miR-99a-5p mimic significantly induced SiHa cell apoptosis when compared with the cells transfected with miR-NC mimic.
Figure 2.

miR-99a-5p mimic induces cell apoptosis of SiHa. (A) Reverse transcription-quantitative PCR revealed the difference in miR-99a-5p expression between miR-NC mimic and miR-99a-5p mimic. (B) MTT analysis revealed the differences in the OD values of miR-NC mimic and miR-99a-5p mimic. (C and D) Flow cytometric experiments showed the difference in the apoptotic rate between miR-NC mimic and miR-99a-5p mimic. *P<0.05, **P<0.01 and ***P<0.001 vs. miR-NC mimic. miR, microRNA; NC, negative control.
In order to examine the mechanisms underlying the promotion of cell apoptosis by miR-99a-5p, the glucose consumption of SiHa cells was detected. The results revealed that following the overexpression of miR-99a-5p, the glucose consumption of SiHa cells significantly decreased (Fig. 3A), and the production of glycolytic product lactate also significantly decreased compared with the miR-NC mimic group (Fig. 3B). Subsequently, the ECAR was examined and the results revealed that the ECAR value of the miR-99a-5p mimic group was significantly lower than that of the miR-NC mimic group, particularly following treatment with the ATP synthesis inhibitor, oligomycin (Fig. 3C).
Figure 3.

miR-99a-5p mimic reduces glycolysis of SiHa cells. (A) The difference in the glucose consumption between miR-NC mimic and miR-99a-5p mimic is presented. (B) The difference in the lactate production between miR-NC mimic and miR-99a-5p mimic is shown. (C) The difference in the ECAR between miR-NC mimic and miR-99a-5p mimic is revealed. **P<0.01 vs. miR-NC mimic. miR, microRNA; NC, negative control; ECAR, extracellular acidification rate.
RRAGD is targeted by miR-99a-5p, and its expression is decreased in CC tissues and cells
To explore the targets of miR-99a-5p in regulating CC cell apoptosis, the TargetScan 7.1 website was searched. It was found that the 3′-UTR of RRAGD was potentially targeted by miR-99a-5p (Fig. 4A). RRAGD is a monomeric GTP/GDP binding protein and plays critical roles in the mTOR signaling pathway (19). In the present study, to confirm this hypothesis, a dual luciferase reporter assay was performed. The results demonstrated that in the WT RRAGD 3′-UTR-transfected cells, the luciferase activity was significantly lower in the miR-99a-5p mimic group in comparison with the miR-NC mimic group; however, no significant difference was observed between the miR-NC mimic group and miR-99a-5p mimic group in the MUT RRAGD 3′-UTR-transfected cells (Fig. 4B). These results indicated that RRAGD was targeted by miR-99a-5p.
Figure 4.
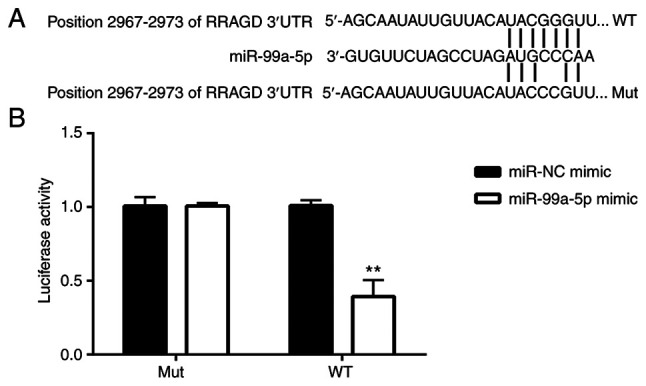
miR-99a-5p targets RRAGD. (A) WT and Mut sequences of miR-99a-5p-targeted 3′-UTR of RRAGD are shown. (B) The difference in the the luciferase activity is presented. **P<0.01 vs. miR-NC mimic. miR, microRNA; RRAGD, Ras-related GTP binding D; WT, wild-type; Mut, mutant; NC, negative control.
Subsequently, the expression of RRAGD was examined in CC tissues, and it was found that the mRNA level of RRAGD was significantly higher in CC tissues compared with normal tissues (Fig. 5A). In addition, RRAGD expression was negatively correlated with the expression of miR-99a-5p in CC tissues (Fig. 5B). The expression of RRAGD was also detected in CC cell lines. As demonstrated in Fig. 5C-E, both the mRNA and protein levels of RRAGD were higher in the SiHa cells than in the Ect1 control cells.
Figure 5.

RRAGD is increased in CC tissues and the SiHa cell line. (A) RT-qPCR analysis revealed the difference in the expression of RRAGD between normal and CC tissues collected from the patients in the present study. (B) Pearson correlation analysis showed the relationship between miR-99a-5p and RRAGD in CC tissues collected from the patients in the present study. (C) RT-qPCR analysis demonstrated the difference in the RRAGD mRNA expression between Ect1 and SiHa cells. (D and E) Western blot analysis showed the difference in the RRAGD protein expression between Ect1 and SiHa cells. ***P<0.01 vs. normal tissues and **P<0.001 vs. Ect1 cells. RRAGD, Ras-related GTP binding D; CC, cervical cancer; RT-qPCR, reverse transcription-quantitative PCR; miR, microRNA.
miR-99a-5p regulates CC cell apoptosis and glycolysis by targeting RRAGD
The present study then determined whether miR-99a-5p plays a role in the regulation of cell apoptosis and glycolysis in CC by targeting RRAGD. To explore whether the overexpression of RRAGD could reverse the effects of overexpression of miR-99a-5p, a pcDNA3.1-RRAGD plasmid was constructed, which could increase the RRAGD mRNA and protein level effectively (Fig. 6A-C). The effects of RRAGD on the miR-99a-5p-induced alteration of cell survival and apoptosis were then examined. As shown in Fig. 6D, the overexpression of RRAGD in SiHa cells effectively reversed the decrease in cell number induced by miR-99a-5p mimic. In addition, flow cytometry also revealed that the overexpression of RRAGD effectively reduced cell apoptosis induced by miR-99a-5p mimic (Fig. 6E and F).
Figure 6.

Ectopic expression of RRAGD reverses the effects of the miR-99a-5p mimic on cell apoptosis of SiHa cells. (A) Reverse transcription-quantitative PCR analysis revealed the difference in the RRAGD mRNA expression between pcDNA3.1 and pcDNA3.1-RRAGD. (B and C) Western blot analysis showed the difference in the RRAGD protein expression between pcDNA3.1 and pcDNA3.1-RRAGD. **P<0.01 and ***P<0.001 vs. pcDNA3.1. (D) MTT analysis revealed the differences in the OD values among miR-NC mimic + pcDNA3.1, miR-99a-5p mimic + pcDNA3.1 and miR-99a-5p mimic + pcDNA3.1-RRAGD. (E and F) Flow cytometric experiments revealed the differences in the apoptotic rates among miR-NC mimic + pcDNA3.1, miR-99a-5p mimic + pcDNA3.1 and miR-99a-5p mimic + pcDNA3.1-RRAGD. *P<0.05, **P<0.01 and ***P<0.001 vs. miR-NC mimic + pcDNA3.1; #P<0.05 and ##P<0.01 vs. miR-99a-5p mimic + pcDNA3.1. RRAGD, Ras-related GTP binding D; miR, microRNA.
In order to investigate whether RRAGD is involved in the effects of miR-99a-5p on glycolysis, glucose consumption, lactate production and ECAR were detected in RRAGD and miR-99a-5p-overexpressing SiHa cells. The results revealed that miR-99a-5p mimic induced a decrease of glucose consumption and lactate production, which was attenuated by the overexpression of RRAGD (Fig. 7A and B). In addition, ECAR detection assay also demonstrated that RRAGD overexpression attenuated the decrease in the ECAR value induced by miR-99a-5p mimic (Fig. 7C).
Figure 7.

Ectopic expression of RRAGD reverses the effects of miR-99a-5p mimic on glycolysis of SiHa cells. (A) The differences in glucose consumption among the miR-NC mimic + pcDNA3.1, miR-99a-5p mimic + pcDNA3.1, miR-99a-5p mimic + pcDNA3.1-RRAGD groups are presented. (B) The differences in lactate production among the miR-NC mimic + pcDNA3.1, miR-99a-5p mimic + pcDNA3.1 and miR-99a-5p mimic + pcDNA3.1-RRAGD groups are shown. (C) The differences in the ECAR among the miR-NC mimic + pcDNA3.1, miR-99a-5p mimic + pcDNA3.1, and miR-99a-5p mimic + pcDNA3.1-RRAGD groups are revealed. **P<0.01 miR-NC mimic + pcDNA3.1; #P<0.05 vs. miR-99a-5p mimic + pcDNA3.1. RRAGD, Ras-related GTP binding D; miR, microRNA; NC, negative control; ECAR, extracellular acidification rate.
Discussion
By analyzing the information from The Cancer Genome Atlas database, the present study found that patients with CC with a higher expression level of miR-99a had a higher survival rate; moreover, in the collected CC tissues and cell lines, miR-99a-5p expression was downregulated. These results indicated that miR-99a-5p is a potential tumor suppressor in CC.
Subsequently, it was revealed that the overexpression of miR-99a-5p reduced the proliferation of SiHa cells; this finding is in accordance with that of a previous study demonstrating that miR-99a-5p reduced the proliferation of HeLa cells (20); in addition, the present study found that the overexpression of miR-99a-5p promoted the apoptosis of SiHa cells. A negative effect of the glycolysis pathway is that it leads to the abnormal growth and proliferation of cancer cells (6). Furthermore, tumor cell apoptosis is closely related to glucose consumption (21). In further experiments, the present study explored the effects of miR-99a-5p mimic on glucose consumption, and it was found that the overexpression of miR-99a-5p impaired the glycolysis of CC cells by decreasing glucose consumption, lactate production and ECAR. It is considered that in patients with CC, miR-99a-5p may play a role in inhibiting the glycolysis process of tumor cells and promoting tumor cell apoptosis, so as to achieve an anticancer effect. In follow-up studies, the unknown mechanism was further explored.
Subsequently, it was found that RRAGD was a target of miR-99a-5p. However, to the best of our knowledge, there is no report available to date of the role of RRAGD or the miR-99a-5p/RRAGD axis in CC. In the present study, RRAGD expression was increased in CC tissues and cell lines, which was also negatively correlated with miR-99a-5p expression in CC tissues. It is thus suggested that RRAGD is a potential oncogene in CC. Furthermore, it was identified that RRAGD was an important substrate for miR-99a-5p to regulate apoptosis and glycolysis. Additionally, during the process of the present study, an article published in 2021 demonstrated that RRAGD expression was elevated in patients with hepatocellular carcinoma who had a poor prognosis, and RRAGD was an important cancer-promoting factor for cancer progression and aerobic glycolysis in HCC (22); this further confirmed the findings of the present study, suggesting that RRAGD is an important oncogenic factor for cancer progression of CC. It may also prove to be a potential therapeutic target for CC intervention.
However, the overexpression of RRAGD only partially reversed the effects of miR-99a-5p mimic on cell apoptosis and glycolysis, rather than completely blocking them. It is considered that this may be due to the following reasons: Firstly, previous studies have demonstrated that miR-99a-5p can target the mRNAs of other important kinases or proteins, such as mTOR (20,23); thus, the overexpression of RRAGD was not sufficient to eliminate all the effects of miR-99a; secondly, the overexpression of RRAGD mRNA was also under the regulation of miR-99a, and the overexpression of miR-99a-5p was sufficient to attenuate the effects of RRAGD.
In conclusion, the present study found that the expression of miR-99a-5p was decreased in CC tissues and cell lines. miR-99a-5p was found to play a role in inducing cell apoptosis and reducing cell glycolysis by targeting RRAGD in CC. These findings revealed a possible mechanism of miR-99a-5p in CC, and provided potential biomarkers and therapeutic targets for the diagnosis and treatment of CC. However, the effects of miR-99a-5p and RRAGD on tumor growth in nude mice were not verified in the present study. Therefore, such experiments will be performed in future studies.
Acknowledgements
Not applicable.
Funding Statement
Funding: No funding was received.
Availability of data and materials
The datasets used and/or analyzed during the current study are available from the corresponding author on reasonable request.
Authors' contributions
GW, YL, SD, FJ and MX performed the experiments and analyzed the data. XD conceived the project, supervised the study, and performed data interpretation and manuscript preparation. GW and XD confirm the authenticity of all the raw data. All authors read and approved the final manuscript.
Ethics approval and consent to participate
All patients provided written informed consent. The present study was approved by the Ethics Committee of Wuhan Third Hospital (Tongren Hospital of Wuhan University, Wuhan, China; approval no. WHTH-2018-07).
Patient consent for publication
Not applicable.
Competing interests
The authors declare that they have no competing interests.
References
- 1.Cohen PA, Jhingran A, Oaknin A, Denny L. Cervical cancer. Lancet. 2019;393:169–182. doi: 10.1016/S0140-6736(18)32470-X. [DOI] [PubMed] [Google Scholar]
- 2.Torre LA, Siegel RL, Ward EM, Jemal A. Global cancer incidence and mortality rates and trends-an update. Cancer Epidemiol Biomarkers Prev. 2016;25:16–27. doi: 10.1158/1055-9965.EPI-15-0578. [DOI] [PubMed] [Google Scholar]
- 3.Lunt SY, Vander Heiden MG. Aerobic glycolysis: Meeting the metabolic requirements of cell proliferation. Annu Rev Cell Dev Biol. 2011;27:441–464. doi: 10.1146/annurev-cellbio-092910-154237. [DOI] [PubMed] [Google Scholar]
- 4.Schwartz L, Supuran CT, Alfarouk KO. The Warburg effect and the Hallmarks of cancer. Anticancer Agents Med Chem. 2017;17:164–170. doi: 10.2174/1871520616666161031143301. [DOI] [PubMed] [Google Scholar]
- 5.Vander Heiden MG, Cantley LC, Thompson CB. Understanding the Warburg effect: The metabolic requirements of cell proliferation. Science. 2009;324:1029–1033. doi: 10.1126/science.1160809. [DOI] [PMC free article] [PubMed] [Google Scholar]
- 6.Ganapathy-Kanniappan S, Geschwind JF. Tumor glycolysis as a target for cancer therapy: Progress and prospects. Mol Cancer. 2013;12:152. doi: 10.1186/1476-4598-12-152. [DOI] [PMC free article] [PubMed] [Google Scholar]
- 7.Li Z, Peng Y, Li J, Chen Z, Chen F, Tu J, Lin S, Wang H. N6-methyladenosine regulates glycolysis of cancer cells through PDK4. Nat Commun. 2020;11:2578. doi: 10.1038/s41467-020-16306-5. [DOI] [PMC free article] [PubMed] [Google Scholar]
- 8.Kroemer G, Pouyssegur J. Tumor cell metabolism: Cancer's Achilles' heel. Cancer Cell. 2008;13:472–482. doi: 10.1016/j.ccr.2008.05.005. [DOI] [PubMed] [Google Scholar]
- 9.DeBerardinis RJ, Lum JJ, Hatzivassiliou G, Thompson CB. The biology of cancer: Metabolic reprogramming fuels cell growth and proliferation. Cell Metab. 2008;7:11–20. doi: 10.1016/j.cmet.2007.10.002. [DOI] [PubMed] [Google Scholar]
- 10.Krol J, Loedige I, Filipowicz W. The widespread regulation of microRNA biogenesis, function and decay. Nat Rev Genet. 2010;11:597–610. doi: 10.1038/nrg2843. [DOI] [PubMed] [Google Scholar]
- 11.Bushati N, Cohen SM. MicroRNA functions. Annu Rev Cell Dev Biol. 2007;23:175–205. doi: 10.1146/annurev.cellbio.23.090506.123406. [DOI] [PubMed] [Google Scholar]
- 12.Iorio MV, Croce CM. MicroRNA dysregulation in cancer: Diagnostics, monitoring and therapeutics. A comprehensive review. EMBO Mol Med. 2012;4:143–159. doi: 10.1002/emmm.201100209. [DOI] [PMC free article] [PubMed] [Google Scholar]
- 13.Rupaimoole R, Slack FJ. MicroRNA therapeutics: Towards a new era for the management of cancer and other diseases. Nat Rev Drug Discov. 2017;16:203–222. doi: 10.1038/nrd.2016.246. [DOI] [PubMed] [Google Scholar]
- 14.Sadri Nahand J, Moghoofei M, Salmaninejad A, Bahmanpour Z, Karimzadeh M, Nasiri M, Mirzaei HR, Pourhanifeh MH, Bokharaei-Salim F, Mirzaei H, Hamblin MR. Pathogenic role of exosomes and microRNAs in HPV-mediated inflammation and cervical cancer: A review. Int J Cancer. 2020;146:305–320. doi: 10.1002/ijc.32688. [DOI] [PMC free article] [PubMed] [Google Scholar]
- 15.Pardini B, De Maria D, Francavilla A, Di Gaetano C, Ronco G, Naccarati A. MicroRNAs as markers of progression in cervical cancer: A systematic review. BMC Cancer. 2018;18:696. doi: 10.1186/s12885-018-4590-4. [DOI] [PMC free article] [PubMed] [Google Scholar]
- 16.Gao C, Zhou C, Zhuang J, Liu L, Liu C, Li H, Liu G, Wei J, Sun C. MicroRNA expression in cervical cancer: Novel diagnostic and prognostic biomarkers. J Cell Biochem. 2018;119:7080–7090. doi: 10.1002/jcb.27029. [DOI] [PubMed] [Google Scholar]
- 17.Sun D, Han L, Cao R, Wang H, Jiang J, Deng Y, Yu X. Prediction of a miRNA-mRNA functional synergistic network for cervical squamous cell carcinoma. FEBS Open Bio. 2019;9:2080–2092. doi: 10.1002/2211-5463.12747. [DOI] [PMC free article] [PubMed] [Google Scholar]
- 18.Livak KJ, Schmittgen TD. Analysis of relative gene expression data using real-time quantitative PCR and the 2(−Delta Delta C(T)) method. Methods. 2001;25:402–408. doi: 10.1006/meth.2001.1262. [DOI] [PubMed] [Google Scholar]
- 19.Di Malta C, Siciliano D, Calcagni A, Monfregola J, Punzi S, Pastore N, Eastes AN, Davis O, De Cegli R, Zampelli A, et al. Transcriptional activation of RagD GTPase controls mTORC1 and promotes cancer growth. Science. 2017;356:1188–1192. doi: 10.1126/science.aag2553. [DOI] [PMC free article] [PubMed] [Google Scholar]
- 20.Wang L, Chang L, Li Z, Gao Q, Cai D, Tian Y, Zeng L, Li M. MiR-99a and −99b inhibit cervical cancer cell proliferation and invasion by targeting mTOR signaling pathway. Med Oncol. 2014;31:934. doi: 10.1007/s12032-014-0934-3. [DOI] [PubMed] [Google Scholar]
- 21.Ribas V, García-Ruiz C, Fernández-Checa JC. Mitochondria, cholesterol and cancer cell metabolism. Clin Transl Med. 2016;5:22. doi: 10.1186/s40169-016-0106-5. [DOI] [PMC free article] [PubMed] [Google Scholar]
- 22.Ding L, Liang X. Ras related GTP binding D promotes aerobic glycolysis of hepatocellular carcinoma. Ann Hepatol. 2021;23:100307. doi: 10.1016/j.aohep.2021.100307. [DOI] [PubMed] [Google Scholar]
- 23.Liu Y, Li B, Yang X, Zhang C. MiR-99a-5p inhibits bladder cancer cell proliferation by directly targeting mammalian target of rapamycin and predicts patient survival. J Cell Biochem. 2019;120:19330–19337. doi: 10.1002/jcb.27318. [DOI] [PubMed] [Google Scholar]
Associated Data
This section collects any data citations, data availability statements, or supplementary materials included in this article.
Data Availability Statement
The datasets used and/or analyzed during the current study are available from the corresponding author on reasonable request.