

Abstract
Gastric cancer (GC), the fifth most common malignancy worldwide, has an extremely poor prognosis at the advanced stage or the early stage if inadequately treated. Long noncoding RNAs (lncRNAs), microRNAs (miRNAs) and mRNAs all function as competing endogenous RNAs (ceRNAs) that target and regulate each other. Changes in their expression and their regulatory bioprocesses play important roles in GC. However, the roles of key RNAs and their regulatory networks remain unclear. In this study, RNA profiles were extracted from The Cancer Genome Atlas database, and R language was used to discover the differentially expressed (DE) lncRNAs, miRNAs and mRNAs in GC. Then, the DERNAs were paired by miRcode, miRDB, TargetScan and DIANA, and the ceRNA network was further constructed and visualized using Cytoscape. Moreover, a functional enrichment analysis was performed using Metascape. Afterward, the “survival” package was employed to identify candidate prognostic targets (DERNA-os) in the ceRNA network. Ultimately, the ceRNA network was analyzed to identify crucial lncRNA/miRNA/mRNA axes. Based on 374 gastric adenocarcinoma and gastric adenoma samples, 283 DEceRNAs (69 lncRNAs, 10 miRNAs, and 204 mRNAs) were identified. The 204 mRNAs were significantly enriched in some interesting functional clusters, such as the trans-synaptic signaling cluster and the protein digestion and absorption cluster. The ceRNA network consisted of 43 ceRNAs (13 lncRNAs, 2 miRNAs, and 28 mRNAs) that were related to prognosis. Among them, 2 lncRNAs (LNC00469 and AC010145.1) and 1 mRNA (PRRT4) were potential new biomarkers. In addition, according to the lncRNA/miRNA/mRNA regulatory relationships among the 43 ceRNAs, we identified four axes that might play important roles in the progression of GC and investigated the potential mechanism of the most promising axis (POU6F2-AS2/hsa-mir-137/OPCML) in promoting the proliferation and invasiveness of GC.
Keywords: Gastric cancer, miRNA, lncRNA, mRNA, ceRNA
Introduction
Gastric cancer (GC) is the fifth most common malignancy worldwide [1]. Approximately 1,089,103 people were diagnosed with GC in 2020 [1]. The age-standardized incidence rate of stomach cancer in men is 2-fold higher than that in women [1]. GC ranks fourth in cancer-related mortality worldwide, and approximately 768,793 people died of this disease in 2020 [1]. In China, the number of males and females who died from GC is approximately 256,512 and 117,277 people, accounting for 51.02% and 44.09% of the world’s male and female stomach cancer mortality, respectively [1,2]. The most commonly known causes include Helicobacter pylori infection, smoking, and genetic factors. After comprehensive treatment consisting of endoscopic mucosal exfoliation, chemotherapy, radiotherapy and surgery, the prognosis of patients with early-stage GC is favorable. However, for patients with advanced GC or improper treatment in the early stage, the effect of comprehensive treatment is quite poor, and the 5-year survival rate of patients with GC only reaches 21.35% [3]. Even with the current rapid development of medical techniques, the prognosis of patients with GC is still extremely poor, and further multilevel mechanistic research is urgently needed to improve the early diagnostic rate and investigate more effective treatments. In recent years, advances in tumor molecular pathogenesis studies based on bioinformatics analysis have opened up an important new avenue for tumor research.
Only 2% of RNAs in the human transcriptome encode proteins, and the remaining 98% are noncoding RNAs (ncRNAs) [4,5], including ribosomal RNAs (rRNAs), long noncoding RNAs (lncRNAs) and microRNAs (miRNAs). Recent advances in next-generation sequencing technologies have led to the identification of previously unidentified and uncharacterized RNA transcripts that have been linked to various growth and development processes, including diseases such as GC. For example, Zhang M et al. indicated that the lncRNA NEAT1 is abnormally overexpressed in patients with breast cancer, and the downregulation of NEAT1 expression prevents the expression of the β-catenin protein, thereby suppressing the hyperplasia and metastasis of breast tumor cells [6]. Su JJ et al. documented that miR-145 is expressed at low levels in patients with colon cancer [7]. Upregulating miR-145 expression silences the target gene IGF1R, thereby inhibiting tumor cell proliferation [7]. Furthermore, researchers also observed a mutual targeting regulatory relationship between different types of ncRNAs [8].
In 2011, Salmena L et al. proposed the concept of competing endogenous RNA (ceRNA), which is defined as a type of RNA that regulates the transcription of other RNAs by competing for shared miRNA binding sites [8]. As a type of ceRNA, lncRNAs regulate the expression levels of mRNAs by competitively sponging miRNAs, affecting the translation of the corresponding proteins and the related cellular activities [8,9]. Based on this definition, many scientists have hypothesized a “lncRNA/miRNA/mRNA” regulatory mechanism. Based on a large amount of data and experimental verification, many of these regulatory axes have been proposed in GC that are beneficial to clinical treatment research. In 2019, Lu RQ et al. experimentally discovered the HOTAIRM1/miR-17-5p/PTEN axis and proposed the highly expressed lncRNA HOTAIRM1 as a ceRNA that sponged miR-17-5p to mediate the upregulation of PTEN expression and block the PI3K/AKT pathway in GC, thereby suppressing the hyperplasia and metastasis of cancer cells [10]. In 2020, Zhang YM et al. experimentally identified the SNHG7/miR-34a/Snail axis and proposed that the highly expressed lncRNA SNHG7 functioned as the ceRNA of miR-34a to mediate the upregulation of Snail expression and subsequently promote the epithelial-mesenchymal transition (EMT), thereby enhancing the invasiveness and metastasis of GC cells [11]. These studies showed that in gastric cancer, differentially expressed (DE) ceRNAs are closely correlated with the tumorigenesis, progression and prognosis of patients with tumors. Identifying the key points and axes in the ceRNA network may facilitate the identification of new candidate biomarkers or therapeutic targets for the treatment of GC.
In this study, we extracted differentially expressed lncRNAs (DElncRNAs), miRNAs (DEmiRNAs) and mRNAs (DEmRNAs) detected in gastric adenocarcinoma and gastric adenoma samples stored in The Cancer Genome Atlas (TCGA) database. Afterward, using the online tools miRDB, TargetScan and DIANA TOOLS that paired the DERNAs, a ceRNA network was constructed to reveal their inter-targeting and regulatory relationships. Then, we employed the “survival” package of R language to perform a survival analysis of the ceRNA network and identified DERNA-os as related to the patients’ five-year survival rate. Finally, “lncRNA/miRNA/mRNA” axes were hypothesized based on the regulatory relationship of DERNA-os in the ceRNA network. On the one hand, the aforementioned DERNA-os and “lncRNA/miRNA/mRNA” axes discovered in this study provide candidate prognostic targets for patients with GC. On the other hand, they might help researchers better understand the role of ceRNAs in gastric tumors, provide new insights for elucidating the molecular mechanisms of GC, and provide a new direction of axial mechanisms for clinical treatment and research.
Materials and methods
Tumor data and differential expression analysis
Data collection from TCGA database
The transcriptome profiles and clinical data of gastric adenocarcinoma and gastric adenoma samples were downloaded from the Genomic Data Commons Data Portal (GDC, https://portal.gdc.cancer.gov/repository; date: May 2020) in TCGA database. These data contained the following three types of information: 1) RNA sequencing (RNA-seq) data, 2) miRNA sequencing (miRNA-seq) data, and 3) clinical survival time. The acquisition and processing of the data in this study followed the publication guidelines provided by TCGA database. The aforementioned data are freely available to the public; thus, no additional local ethics committee approval was needed.
Identification of DElncRNAs, DEmiRNAs, and DEmRNAs
After data collection and screening, we extracted the miRNA expression matrix from the miRNA-seq profiles, while the lncRNA and mRNA expression matrices were extracted from the RNA-seq profiles. We used the “edgeR” package (DOI: 10.18129/B9.bioc.edge) installed in R software (https://www.r-project.org/, version 3.6.3) using the following screening criteria to further identify the DElncRNAs, DEmiRNAs and DEmRNAs in GC samples: 1) log2 fold change in expression multiple (|log2FC|) > 2.0 and 2) false discovery rate (FDR) < 0.05. The “gplots” package was used to generate heatmaps and volcano plots, where the heatmap illustrated the dysregulation of DERNAs in samples, whereas volcano plots illustrated the top up- and downregulated candidates.
Establishment of the ceRNA network based on DElncRNAs, DEmiRNAs, and DEmRNAs
Prediction of DElncRNA-DEmiRNA and DEmiRNA-DEmRNA pairs
The ceRNA network, which is generated based on experimental data, reveals the relationships between heterogeneous RNAs and may be used to investigate the interactions of multiple RNAs. MiRcode (http://www.mircode.org/) [12] performs a multidirectional prediction of ncRNAs such as lncRNAs and miRNAs. To obtain the DElncRNA-miRNA pairs, we used miRcode to predict the regulatory relationships of DElncRNAs and miRNAs in GC samples. Then, we intersected the miRNAs in these pairs with the DEmiRNAs to identify the relevant DEmiRNAs and obtain the DElncRNA-DEmiRNA pairs in this study.
Likewise, three online analysis tools, miRDB (http://mirdb.org/) [13], TargetScan 7.2 (http://www.targetscan.org/vert_72/) [14], and microTCDS in DIANA (http://www.microrna.gr/microT-CDS) [15,16], were employed to predict the target mRNAs of DEmiRNAs in the DEmiRNA-mRNA pairs. Afterward, we screened the intersections of the mRNAs in the aforementioned pairs and the DEmRNAs and obtained the intersecting DEmRNAs and DEmiRNA-DEmRNA pairs in GC samples.
Construction of the ceRNA network
LncRNAs sponge miRNAs and further regulate the expression of the target mRNAs of these miRNAs. In the ceRNA network, miRNAs are the key points connecting lncRNAs and mRNAs. Therefore, we designated miRNA as the center of the ceRNA network and connected the DElncRNA-DEmiRNA pairs and the DEmiRNA-DEmRNA pairs to construct a lncRNA-miRNA-mRNA ceRNA network for GC. Afterward, the ceRNA network was visualized using Cytoscape 3.7.2 software [17]. Additionally, the regulatory relationship in the ceRNA network was further used for the construction of lncRNA/miRNA/mRNA regulatory axes.
Functional enrichment and pathway analysis
We extracted the mRNAs (the target genes) from the ceRNA network and enriched them using the GO and KEGG functional enrichment part in Metascape (http://metascape.org) to explore the cell signaling pathways and biological processes in which mRNAs in the ceRNA network were involved in GC [18]. The resulting GO and KEGG terms with a minimum number of 3 genes, P < 0.05, and an enrichment factor > 1.5 were collected. With kappa scores as the similarity metric, hierarchical clustering analysis was performed on the enriched terms, and terms with a similarity > 0.3 were grouped into a cluster that was represented by the most statistically significant term within it. This representative term also covered all genes in the cluster. The top 20 clusters were extracted and rendered as network plots, where terms within the same cluster are connected by edges and the thickness of the edge represents the value of the similarity score.
Identification of tumor prognostic markers and postulated lncRNA/miRNA/mRNA regulatory axes
Identification of tumor prognostic markers among lncRNAs, miRNAs, and mRNAs
We extracted the survival time of the patients who donated the GC samples and used the “survival” package and “qvalue” package (DOI: 10.18129/B9.bioc.qvalue) in R software to perform a univariate survival analysis of the acquired samples to identify independent prognostic biomarkers in the ceRNA network. In addition, the Kaplan-Meier curve [19] was applied to generate the five-year survival curve of patients with GC. Moreover, at a significance level of P < 0.05, prognosis-related tumor markers (DElncRNA-os, DEmiRNA-os and DEmRNA-os) were screened from DElncRNAs, DEmiRNAs and DEmRNAs in the ceRNA network.
Construction of lncRNA/miRNA/mRNA regulatory axes
We first identified the target DEmiRNAs of DElncRNA-os in the ceRNA network and took the intersection of the selected DEmiRNAs and DEmiRNA-os as the DElncRNA-os/DEmiRNA-os pairs to clarify the regulatory relationships between biomarkers in the ceRNA network. Subsequently, we obtained the target DEmRNAs of DEmiRNA-os in the DElncRNA-os/DEmiRNA-os pairs of the ceRNA network and intersected the selected DEmRNAs and DEmRNA-os to obtain the DEmiRNA-os/DEmRNA-os pairs. Afterward, the pairs mentioned above were connected to determine the DElncRNA-os/DEmiRNA-os/DEmRNA-os pairs. In the ceRNA regulatory network, lncRNAs sponge and downregulate miRNAs to subsequently inhibit the expression of their target miRNAs. Similarly, downregulated lncRNAs disinhibit sponged miRNAs, leading to the upregulation of target miRNAs. According to this pattern of regulation, we screened the DElncRNA-os/DEmiRNA-os/DEmRNA-os pairs and predicted the lncRNA/miRNA/mRNA axis in GC.
Data processing
This study adopted R (version 3.6.3) for statistical analysis. The edgeR package in R was employed to obtain the abnormally expressed RNAs. An unpaired two-tailed t test was used to compare the variations between the two groups. P < 0.05 was considered statistically significant.
Results
Flow chart of the data mining approach for screening ceRNAs and tumor biomarkers
Figure 1 shows the flow chart of the data mining approach used to screen ceRNAs and tumor biomarkers of GC in this study. R software and various online tools were employed for the analysis. First, we downloaded the expression profiles of lncRNAs, miRNAs and mRNAs in gastric adenocarcinoma and gastric adenoma from TCGA database and obtained DElncRNAs, DEmiRNAs and DEmRNAs after data analysis using R. Then, the miRcode database was used to determine the DElncRNA-DEmiRNA pairs, and miRDB, TargetScan 7.2 and DIANA microT-CDS tools were applied to identify the DEmiRNA-DEmRNA pairs. Thereafter, to visualize the relationship between the two types of pairs, we used Cytoscape to construct a ceRNA network diagram. Furthermore, we used Metascape to conduct an enrichment analysis of mRNAs in the ceRNA network to comprehend the potential functions of the ceRNA network in GC. In addition, through a survival analysis using R, we obtained DElncRNA-os, DEmiRNA-os and DEmRNA-os related to the five-year survival rate of patients. Ultimately, based on the targeting relationships in the ceRNA network, we identified DElncRNA-os/DEmiRNA-os/DEmRNA-os pairs and further predicted the lncRNA/miRNA/mRNA axis according to its regulatory mode. This process is a feasible method to identify potential tumor prognostic biomarkers and predict tumor regulatory axes.
Figure 1.

Analysis of prognostic biomarkers and key axes. The analysis includes specific bioinformatics methods, data processing tools, and partial research results.
Data extraction and differential expression analysis of lncRNAs, miRNAs and mRNAs
In this study, the data profiles of gastric adenocarcinoma and gastric adenoma were obtained from TCGA database. The profiles included 374 lncRNA samples (normal samples: 30, tumor samples: 344), 453 miRNA samples (normal samples: 42, tumor samples: 411), and 374 mRNA samples (normal samples: 30, tumor samples: 344).
Through a differential expression analysis, 2840 RNAs were identified to be abnormally expressed (|log2FC| > 2.0, P-FDR < 0.05) in GC samples (Figure 2Ai-Ci), consisting of 1052 DElncRNAs (upregulated: 853, downregulated: 199) (Figure 2Aii), 102 DEmiRNAs (upregulated: 85, downregulated: 17) (Figure 2Bii), and 1686 DEmRNAs (upregulated: 937, downregulated: 749) (Figure 2Cii). The red dots denote significantly upregulated RNAs, and the green dots denote significantly downregulated RNAs.
Figure 2.

Heatmap and volcano plots of RNAs. With |log2FC| > 2.0 and FDR < 0.05 as the standards, heatmaps and volcano plots were drawn to illustrate the outcome of the differential expression analysis. The red dots denote significantly upregulated RNAs, and the green dots denote significantly downregulated RNAs. Ai. Heatmap of lncRNAs; Bi. heatmap of miRNAs; Ci. heatmap of mRNAs. The abscissa represents the log2 transformation value of the fold change in differential expression between GC samples and normal samples. The larger the |log2FC| value, the greater the fold change. The ordinate represents the -log10 transformation of the FDR value. The larger the -log10 transformation value, the more significant the difference. Aii. Volcano plot of lncRNAs; Bii. volcano plot of miRNAs; Cii. volcano plot of mRNAs. The abscissa represents logFC, where the farther the point deviates from the center, the greater the fold change; the negative half represents downregulation, and the positive half represents upregulation. The ordinate represents -log (FDR), where the closer the point is to the top, the more significant the difference in expression between GC samples and normal samples.
The ceRNA regulatory network of GC
Based on predictions from the miRcode database, we obtained the DElncRNA-DEmiRNA pairs. According to the screening criteria, 69 DElncRNAs and 10 DEmiRNAs were included in the ceRNA network, and they constituted 154 DElncRNA-DEmiRNA pairs (Supplementary Table 1). Furthermore, three online tools (miRDB, TargetScan 7.2, and DIANA microT-CDS) were employed to predict the target genes of the 10 DEmiRNAs included in the ceRNA network. Thereafter, we intersected the predictions with DEmRNAs; 204 DEmRNAs were included in the ceRNA network, and 288 DEmiRNA-DEmRNA pairs were obtained (Supplementary Table 2).
Finally, based on the DElncRNA-DEmiRNA pairs and DEmiRNA-DEmRNA pairs obtained above, we used Cytoscape to construct the ceRNA network of GC (Figure 3). As shown in Figure 3, 69 DElncRNAs (upregulated: 51, downregulated: 18), 10 DEmiRNAs (upregulated: 6, downregulated: 4) and 204 DEmRNAs (upregulated: 103, downregulated: 101) were included in the ceRNA network.
Figure 3.
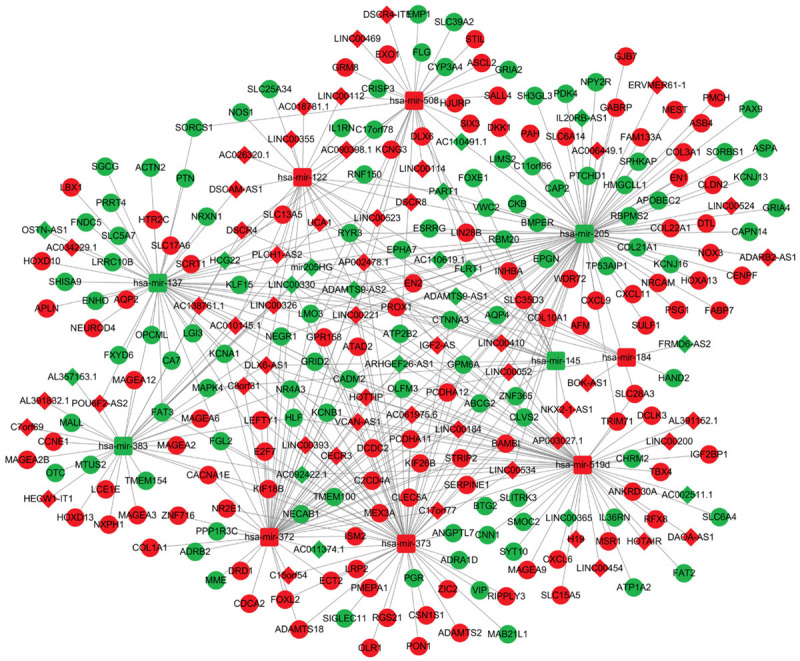
The ceRNA network diagram. Red indicates upregulated RNA expression, green indicates downregulated RNA expression, diamonds represent lncRNAs, squares represent miRNAs, and circles represent mRNAs. 69 DElncRNAs, 10 DEmiRNAs and 204 DEmRNAs were included in the network. They targeted each other and paired to form 154 DElncRNA-DEmiRNA pairs and 288 DEmiRNA-DEmRNA pairs.
GO and KEGG pathway enrichment analyses of 204 mRNAs in the ceRNA network
By performing a functional enrichment analysis of 204 mRNAs in the ceRNA network using the criterion of P < 0.05, we obtained the top 20 clusters of GO processes and KEGG pathways (Figure 4, Supplementary Table 3), which were represented by the most statistically significant term within them (Figure 4A). Figure 4B converted the size of the P value to the color shade of nodes, where terms containing more genes tended to have a more significant P value. Figure 4C distinguished different clusters with separate colors, where nodes that share the same cluster ID were typically close to each other. As illustrated in Figure 4A, the most significant GO function was the trans-synaptic signaling cluster. Among the top 20 clusters, 2 KEGG functional pathway clusters, the protein digestion and absorption cluster and neuroactive ligand-receptor interaction cluster, were identified, and the former was more statistically significant than the latter.
Figure 4.

Functional enrichment analysis of 204 mRNAs. A. Bar graph of enriched terms across input gene lists colored by P values. B. Network of enriched terms colored by P value, where terms containing more genes tend to have a more significant P value. C. Network of enriched terms colored by cluster ID, where nodes that share the same cluster ID are typically close to each other.
Prognostic tumor markers and regulatory axes of GC
13 DElncRNA-os, 2 DEmiRNA-os, and 28 DEmRNA-os prognostic tumor markers
According to the results of the survival analysis with P < 0.05 as the level of significance, we identified the following RNAs in the ceRNA network: 1) NKX2-1-AS1, VCAN-AS1 and 11 other DElncRNA-os prognostic tumor markers (Figure 5A-M); 2) hsa-mir-137 and hsa-mir-145 as the DEmiRNA-os prognostic tumor markers (Figure 5N, 5O); and 3) Homo sapiens serpin family E member 1 (SERPINE1), a disintegrin and metalloproteinase with thrombospondin motifs 18 (ADAMTS18) and 26 other DEmRNA-os prognostic tumor markers (Supplementary Figure 1). Table 1 presents changes in the expression of the 43 prognostic tumor markers listed above, among which 25 were upregulated and 18 were downregulated.
Figure 5.

Survival curves of lncRNAs and miRNAs in the ceRNA network. (A-M) show the survival curves of 13 lncRNAs, while (N and O) show the survival curves of 2 miRNAs. The x-axis represents overall survival time, and the y-axis represents the overall survival rate. P < 0.05 is considered statistically significant.
Table 1.
Prognostic lncRNA, miRNA, and mRNA biomarkers in the ceRNA network
| RNA | Change in Expression | Name | P-adj. |
|---|---|---|---|
| lncRNA | Upregulated | NKX2-1-AS1 | 6.08E-03 |
| VCAN-AS1 | 1.02E-02 | ||
| AC010145.1 | 1.38E-02 | ||
| LINC00469 | 1.68E-02 | ||
| C15orf54 | 1.97E-02 | ||
| IGF2-AS | 2.14E-02 | ||
| AC018781.1 | 2.88E-02 | ||
| LINC00052 | 2.94E-02 | ||
| AL391152.1 | 3.21E-02 | ||
| POU6F2-AS2 | 3.75E-02 | ||
| Downregulated | ADAMTS9-AS1 | 1.37E-02 | |
| ADAMTS9-AS2 | 1.97E-02 | ||
| FLRT1 | 2.43E-02 | ||
| miRNA | Downregulated | hsa-mir-137 | 1.38E-02 |
| hsa-mir-145 | 3.91E-02 | ||
| mRNA | Upregulated | SERPINE1 | 1.19E-03 |
| ADAMTS18 | 2.38E-03 | ||
| PCDHA11 | 8.61E-03 | ||
| INHBA | 1.54E-02 | ||
| DCLK3 | 1.95E-02 | ||
| PCDHA12 | 2.04E-02 | ||
| CXCL9 | 2.25E-02 | ||
| OLR1 | 3.60E-02 | ||
| HOXA13 | 3.70E-02 | ||
| COL3A1 | 4.02E-02 | ||
| STIL | 4.02E-02 | ||
| COL10A1 | 4.04E-02 | ||
| KIF18B | 4.42E-02 | ||
| ATAD2 | 4.46E-02 | ||
| DKK1 | 4.70E-02 | ||
| Downregulated | NECAB1 | 4.36E-03 | |
| FAT3 | 4.37E-03 | ||
| PDK4 | 5.05E-03 | ||
| ZNF365 | 8.78E-03 | ||
| LIMS2 | 1.02E-02 | ||
| ASPA | 1.51E-02 | ||
| PRRT4 | 2.09E-02 | ||
| COL21A1 | 3.10E-02 | ||
| FXYD6 | 3.96E-02 | ||
| OPCML | 4.14E-02 | ||
| ADRA1D | 4.37E-02 | ||
| RBPMS2 | 4.38E-02 | ||
| SLITRK3 | 4.92E-02 |
Among the 13 DElncRNA-os and 2 DEmiRNA-os prognostic biomarkers, the overexpression of five DElncRNA-os (NKX2-1-AS1, VCAN-AS1, IGF2-AS, LINC00052, and POU6F2-AS2), the downregulation of one DElncRNA-os (ADAMTS9-AS2) and two DEmiRNA-os (hsa-mir-137 and hsa-mir-145) were confirmed in previous experimental studies of GC (Tables 2, 3). In addition, the downregulation of DElncRNA-os ADAMTS9-AS1 was reported in earlier experimental prostate cancer studies (Table 2). The abnormal expression of the remaining six DElncRNA-os (upregulated: C15orf54; AC018781.1, AL391152.1, AC010145.1, and LNC00469, downregulated: FLRT1) has not been verified in any experimental studies of cancer before. However, the upregulation of three of them (C15orf54, AL391152.1 and AC018781.1) and the downregulation of the final one (FLRT1) were reported by previous data mining studies on GC (Tables 2, 3).
Table 2.
Comparison of the abnormal changes in the expression of 13 lncRNAs identified in this study and previous experimental studies on cancer

|
Table 3.
Comparison of the abnormal changes in miRNA expression identified in this study and previous experimental studies of cancers
| miRNA | Number | Feature | Study findings | Citation |
|---|---|---|---|---|
| miR-137 | 1 | ▼ | Wu LP et al. reported significantly reduced expression of miR-137 in GC cell lines. Overexpressed miR-137 reduced GC cell proliferation and metastasis by regulating AKT2-related signal pathways. | [50] |
| 2 | ▼ | Deng J et al. reported decreased expression of miR-137 in GC cells lines. The overexpression of miR-137 significantly suppressed the proliferation and invasion of GC cells. | [51] | |
| miR-145 | 3 | ▼ | Lei C et al. confirmed that the expression of miR-145 was downregulated in GC cells. Overexpressed miR-145 suppressed GC cell migration and metastasis by inhibiting the EMT. | [52] |
| 4 | ▼ | Zeng JF et al. indicated that miR-145 was downregulated in cancer tissues and cells. Upregulated miR-145 negatively regulated the migration and metastasis of GC cells. | [53] |
Notes: ▼ a miRNA experimentally downregulated in gastric cancer in accord with our calculated results.
Of the 28 DemRNA-os prognostic gene markers, the upregulation of 12 mRNAs (SERPINE1, ADAMTS18, INHBA, CXCL9, OLR1, HOXA13, COL3A1, STIL, COL10A1, KIF18B, ATAD2, and DKK1) and the downregulation of 4 mRNAs (FAT3, LIMS2, OPCML, and RBPMS2) were confirmed by previous experimental studies of GC. In addition, the upregulation of 1 mRNA (DCLK3) and the downregulation of 3 mRNAs (ASPA, COL21A1, and FXYD6) were confirmed in experimental studies on other cancers. However, the high expression level of 1 mRNA (PDK4) in GC cell lines and the low expression level of 3 mRNAs (NECAB1, ADRA1D, and SLITRK3) in other cancers were reported in previous studies, which differed from the results of our study. The abnormal expression of the remaining 4 mRNAs (upregulated: PCDHA11 and PCDHA12; downregulated: ZNF365 and PRRT4) has not been verified in any experimental studies of cancer before, while the methylation of ZNF365 was experimentally reported to be associated with GC, the mutation of PCDHA11 has been informed by a sequencing analysis of large granular lymphocyte leukemia and the downregulation of PCDHA12 was shown in a previous data mining study on squamous cell lung cancer (Table 4).
Table 4.
Comparison of changes in the expression of 28 mRNAs identified in this study and previous experimental studies on cancer

|
Four lncRNA/miRNA/mRNA regulatory axes based on the ceRNA network
As shown in Figure 6, according to the regulatory relationships of RNAs included in the ceRNA network, the 13 DElncRNA-os and 2 DEmiRNA-os described above formed 7 DElncRNA-os/DEmiRNA-os pairs (ADAMTS9-AS2/hsa-mir-137, FLRT1/hsa-mir-137, POU6F2-AS2/hsa-mir-137, ADAMTS9-AS1/hsa-mir-145, ADAMTS9-AS2/hsa-mir-145, LINC00052/hsa-mir-145, and NKX2-1-AS1/hsa-mir-145). Likewise, the 2 DEmiRNA-os and 28 DEmRNA-os listed above formed 4 DEmiRNA-os/DEmRNA-os pairs (hsa-mir-137/OPCML, hsa-mir-137/FXYD6, hsa-mir-137/FAT atypical cadherin 3 (FAT3), and hsa-mir-137/proline-rich transmembrane protein 4 (PRRT4)).
Figure 6.
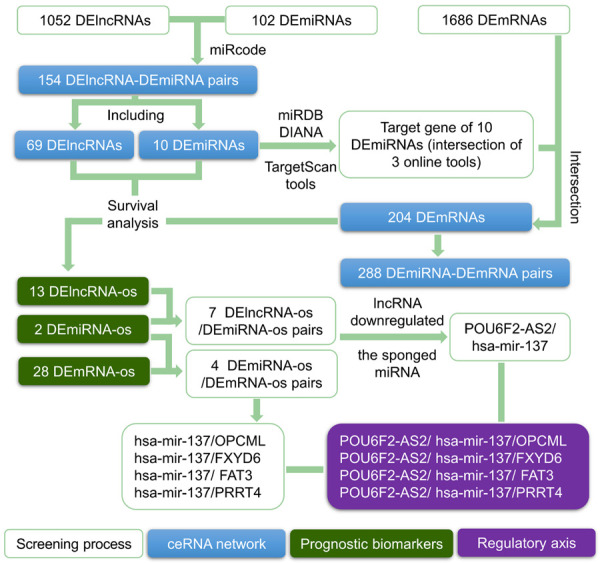
Establishment of 4 lncRNA/miRNA/mRNA axes. The blank rectangles represent the screening process, the blue rectangles represent the components of the ceRNA network, the green rectangles represent candidate prognostic targets, and the purple rectangles represent the regulatory axes.
Afterward, with DEmiRNA-os as the connection point, we combined the DElncRNA-os/DEmiRNA-os pairs and the DEmiRNA-os/DEmRNA-os pairs to obtain 12 DElncRNA-os/DEmiRNA-os/DEmRNA-os interactions. According to the criterion that lncRNAs should downregulate miRNA expression, eight DElncRNA-os/DEmiRNA-os/DEmRNA-os interactions were further discarded, and we finally obtained four lncRNA/miRNA/mRNA axes (POU6F2-AS2/hsa-mir-137/OPCML, POU6F2-AS2/hsa-mir-137/FXYD6, POU6F2-AS2/hsa-mir-137/FAT3, and POU6F2-AS2/hsa-mir-137/PRRT4) that might affect the prognosis and progression of GC (Figure 6). Some of the components and regulatory relationships in these axes were supported by earlier experiments on cancer (Table 5). In Figure 7A, we used the POU6F2-AS2/hsa-mir-137/OPCML axis as an example, in which overexpressed POU6F2-AS2 sponged and downregulated hsa-mir-137, further leading to the low expression of the target gene OPCML. The corresponding experimental evidence for each part of the axis is shown in the box in Figure 7B to help readers understand the potential mechanism. The derivation of this ceRNA axis is fully discussed in the Discussion section.
Table 5.
Supporting evidence for lncRNA/miRNA/mRNA regulatory axes
| Number | Components | Circumstantial Evidence | References |
|---|---|---|---|
| 1 | POU6F2-AS2 and YBX1 | Liu J et al. reported that in squamous cell esophageal cancer samples, POU6F2-AS2 targets and binds YBX1, which is indispensable for the binding of YBX1 to chromatin. In addition, YBX1 compensates for the function of POU6F2-AS2 in repairing DNA damage in response to ionizing radiation treatment, which leads to treatment failure and undesirable outcomes. POU6F2-AS2 knockout inhibits YBX1 locating at and binding to damaged DNA, which further increases the amount of DNA damage in cancer cells and improves the radiotherapy sensitivity of cancer tissues. | [31] |
| 2 | hsa-mir-137 and YBX1 | Chu PC et al. showed that high miR-137 expression in CRC inhibits YBX1 expression by targeting the 3’UTR of YBX1. Johnson TG et al. observed that transfection of miR-137 analogs inhibits the growth, metastasis and invasion of malignant pleural mesothelioma cells, and this process is related to the direct downregulation of YBX1 expression. | [32,33] |
| 3 | hsa-mir-137 and FXYD6 | Li ZM et al. reported that FXYD6 is directly targeted and downregulated by the upregulation of miR-137. When FXYD6 is upregulated, the tumor-suppressive effects of overexpressed miR-137 on osteosarcoma migration and proliferation are reversed. | [81] |
Figure 7.
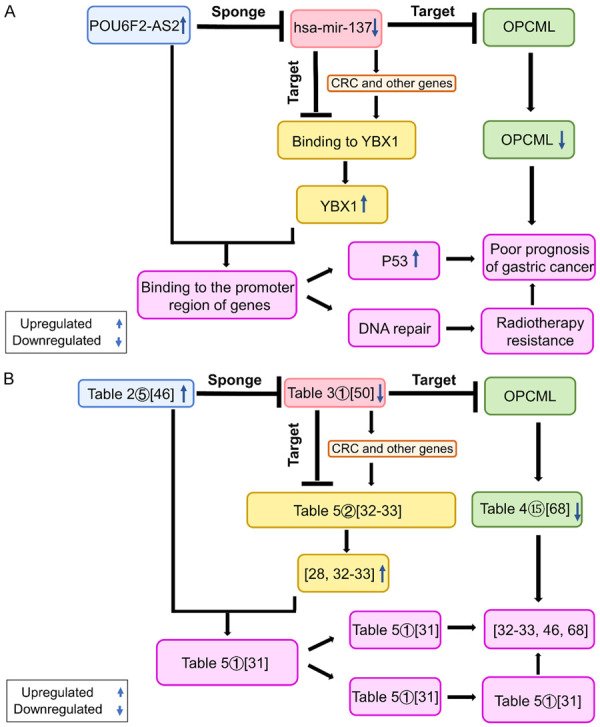
Mechanism plot (A) and evidence map (B) of the POU6F2-AS2/hsa-mir-137/OPCML axis and YBX1 in gastric cancer.
Discussion
GC is one of the most common malignancies in the world [1]. In China, stomach cancer ranked second in incidence and third in cancer-related mortality in 2021 [2]. The 5-year survival rate of patients with GC is less than 21.35% due to the lack of effective treatments in the advanced stage [3]. Therefore, the early detection of GC is essential for the treatment of patients and for a maximized therapeutic effect. With the progress in bioinformatics research in cancers, including gastric carcinoma, a variety of RNA biomarkers related to tumor proliferation, metastasis, invasion, and prognosis have been identified [20-22]. These RNAs contribute to guiding clinical treatment decisions, predicting patient prognosis and developing personalized treatment for patients.
Notably, ncRNA is commonly recognized as a type of RNA that does not encode protein. However, ncRNAs have been reported to possess biological functions such as transcriptional regulation, RNA splicing and modification, and chromosome stabilization [23]. NcRNAs can be divided into small ncRNAs (sncRNAs, including miRNAs), lncRNAs and circular RNAs (circRNAs) according to their size. Studies have shown that in addition to regulating the carcinogenesis and progression of many cancers, ncRNAs also target and regulate other ncRNAs [8,9]. This type of ncRNA is called a ceRNA, and the network formed through their regulatory relationships is called a ceRNA network [8,9]. The ceRNA network is based on the concept that mRNAs, pseudogene transcripts and lncRNAs use miRNA response elements (MREs) as binding targets to “talk” to each other and to target and regulate the expression of one another [8]. Among them, lncRNAs function as miRNA sponges to competitively inhibit sponged miRNAs [24,25]. MiRNAs inhibit the translation of target mRNAs or mediate the deadenylation and degradation of target mRNAs, thus reducing protein synthesis [26]. Emerging evidence shows that lncRNAs sponge miRNAs to further regulate the expression of target mRNAs and then participate in the carcinogenesis, progression and metastasis of cancer [24,25]. This process occurs through the lncRNA/miRNA/mRNA regulatory axis based on the ceRNA network. In this paper, we analyzed the regulatory mechanisms between the components of this axis and discussed the involved target signals and protein pathways to further study the mechanisms of GC carcinogenesis and progression.
Our study is based on 453 miRNA samples, 374 lncRNA samples and 374 mRNA samples from TCGA database related to gastric adenocarcinoma and gastric adenoma. By performing differential expression analyses, we first identified 1052 DElncRNAs (853 upregulated and 199 downregulated), 102 DEmiRNAs (85 upregulated and 17 downregulated), and 1686 DEmRNAs (937 upregulated and 749 downregulated). Then, we detected the DERNA interacting pairs (Supplementary Tables 1, 2) using miRcode, miRDB, TargetScan and DIANA TOOLS. Finally, based on these pairs, we constructed a ceRNA network consisting of 69 lncRNAs, 10 miRNAs and 204 mRNAs. Among them, 43 ncRNAs were related to survival (13 lncRNAs, 2 miRNAs, and 28 mRNAs).
After a thorough literature search and careful analysis of the 43 candidate prognostic RNAs, we found that 17 overexpressed RNAs (5 lncRNAs and 12 mRNAs) and 7 downregulated RNAs (1 lncRNA, 2 miRNAs, and 4 mRNAs) have been experimentally confirmed to promote the progression and invasion of tumor cells in previous GC studies, denoting that at least 55.81% (24 of 43) biomarkers were predicted successfully by our calculation (Tables 2, 3 and 4). In addition, the upregulation of 1 RNAs (1 mRNAs) and the downregulation of 4 RNAs (1 lncRNA and 3 mRNAs) have been documented to stimulate a significant process of tumor cells in previous experiments on other cancers, indicating that 11.63% (5 of 43) of biomarkers might also be predicted correctly (Tables 2 and 4). On the other hand, the abnormal expression of 4 mRNAs (1 downregulated and 3 upregulated) was predicted in the opposite direction from previous experimental reports; however, only one of these four mRNAs (PDK4) was indeed studied in GC (Table 4). Finally, 10 RNAs (6 lncRNAs and 4 mRNAs) have not been confirmed by any previous experiments. Among the 10 RNAs, the predictions of dysregulation of 3 RNAs (2 upregulated lncRNAs and 1 downregulated lncRNA) in this study were consistent with those from other data mining studies, while the prediction of the abnormal upexpression of 1 lncRNA (AC018781.1) and 1 mRNA (PCDHA12) here were opposite to those from other calculation studies. One mRNA was reported to be methylated in gastric cancer cells, 1 mRNA was identified as a mutation driver in large granular lymphocyte leukemia cells and 3 RNAs (2 lncRNAs: AC010145.1 and LNC00469; 1 mRNA: PRRT4) were novel potential prognostic biomarkers that had never been reported before, signifying that our study had an at least 6.98% prediction capability (Tables 2 and 4). Moreover, because these experimentally unconfirmed RNAs may have different functions in different cancers or even in different subtypes and stages of GC, 44.19% (19 of 43) of biomarkers may be aggressively regarded as prognostic. Therefore, we believe that this calculation work is valuable because of its showing both strong reliability and predictability.
Based on the ceRNA target-relationship network, we obtained four lncRNA/miRNA/mRNA regulatory axes (POU6F2-AS2/hsa-mir-137/OPCML, POU6F2-AS2/hsa-mir-137/FAT3, POU6F2-AS2/hsa-mir-137/FXYD6, and POU6F2-AS2/hsa-mir-137/PRRT4) from 43 DERNA-os that might affect the progression of GC. None of the four axes have been reported in previous studies, yet their components have appeared in different experimental reports on cancer. The high expression of POU6F2-AS2 and the low expression of hsa-mir-137, OPCML and FAT3 were previously experimentally confirmed in GC. Low expression of FXYD6 has not been reported to be related to GC, but its low expression was identified in colorectal cancers. PRRT4 has not been reported in any study yet. The information mentioned above adds credibility to the regulatory axes. The more information that is validated by experiments, the higher the reliability of the regulatory axis. In contrast, the higher the predictability of the axis, the greater the significance of further experimental confirmation. Therefore, the reliability of the OPCML axis, the FAT3 axis, the FXYD6 axis and the PRRT4 axis decreases in that order, and their predictability increases in that order.
In this study, we selected the POU6F2-AS2/hsa-mir-137/OPCML axis with the highest reliability as an example. Figure 7 shows a simplified diagram of the regulatory mechanism of this axis. The lncRNA POU6F2-AS2 in the axis was expressed at high levels, while hsa-mir-137 was expressed at low levels. Thus, the highly expressed lncRNA POU6F2-AS2, functioning as a ceRNA, sponged and downregulated the expression of hsa-mir-137, inhibited the expression of the target gene OPCML, and finally promoted the growth, proliferation, invasion, poor differentiation and poor prognosis of GC. We further predicted that the YBX1 protein might play an important role in this process. YBX1 (also called YB-1), a chromatin-binding protein, binds to single-stranded DNA (ssDNA) and pre-mRNA and mediates cell survival after DNA damage [27]. Numerous studies have shown that YBX1 mRNA and protein expression is significantly increased in GC and other cancers [28-30]. The increase in YBX1 protein levels is significantly associated with the migration process of GC [28]. The lncRNA POU6F2-AS2 targets and binds YBX1, and it is indispensable for the binding of YBX1 to chromatin [31]. In addition, YBX1 compensates for the repair function of POU6F2-AS2 in the DNA damage response to ionizing radiation (IR) treatment [31], which leads to treatment failure and undesirable outcomes. In 2016, Liu J et al. found that POU6F2-AS2, which is expressed at high levels in patients with squamous cell esophageal cancer, was significantly related to the high invasiveness of cancer tissues and resistance to radiotherapy [31]. POU6F2-AS2 knockout inhibited the locating and binding of YBX1 to damaged DNA, thereby increasing the amount of DNA damage in cancer cells and improving the radiotherapy sensitivity of cancer tissues [31]. Based on the evidence mentioned above, we speculated that the repair function of POU6F2-AS2 and YBX1 might explain why GC cells can proliferate in the presence of DNA damage from IR or immune elimination. Moreover, the miRNA hsa-mir-137 also directly or indirectly downregulates the expression of the YBX1 protein. In 2018, Chu PC et al. showed that highly expressed miR-137 inhibited YBX1 expression by targeting the 3’UTR of YBX1 [32]. In 2018, Johnson TG et al. performed cell-based experiments and observed that transfection of miR-137 analogs inhibited the growth, metastasis and invasion of cancer cells, and this process was related to the direct downregulation of YBX1 expression [33]. Based on the abovementioned results, we infer that the downregulation of miR-137 expression, in addition to downregulating the expression of OPCML to promote GC cell proliferation and treatment resistance, might weaken the inhibition of YBX1 expression and thus increase the level of the YBX1 protein. The increased YBX1 level, together with the highly expressed POU6F2-AS2, suppresses DNA repair and promotes the survival of DNA-damaged cells. Similar to the mechanism by which the members of the POU6F2-AS2/hsa-mir-137/OPCML axis regulate each other in GC and participate in the oncogenesis and development of cancer, we hypothesize that the other three axes predicted in this study also play important roles in the progression and malignant biological processes of GC.
We conducted functional enrichment and pathway analyses of 204 mRNAs in the ceRNA network to further explore the mechanisms of the 204 mRNAs in the ceRNA network in GC. As shown in Figure 4A, the trans-synaptic signaling cluster was the most significant GO function cluster identified, which included 7 terms (trans-synaptic signaling, synaptic signaling, chemical synaptic transmission, anterograde trans-synaptic signaling, modulation of chemical synaptic transmission, regulation of trans-synaptic signaling, and regulation of membrane potential) (Supplementary Table 3). Among the 7 terms, regulation of membrane potential processes (GO: 0042391) has been reported to have an important function in GC [34]. The most significant KEGG cluster was the protein digestion and absorption cluster, which included 12 terms (protein digestion and absorption [ko04974], protein digestion and absorption [hsa04974], extracellular matrix, external encapsulating structure, collagen-containing extracellular matrix, extracellular matrix organization, extracellular structure organization, external encapsulating structure organization, collagen trimer, extracellular matrix structural constituent conferring tensile strength, extracellular matrix structural constituent, and structural molecule activity) (Supplementary Table 3). Among these 12 terms, 6 terms (protein digestion and absorption [hsa04974], extracellular matrix, collagen-containing extracellular matrix, extracellular matrix organization, extracellular matrix structural constituent, and structural molecule activity) have been reported to play important roles in the function of mRNAs in GC [35-38], and 5 candidate prognostic biomarkers (SERPINE1, ADAMTS18, COL3A1, COL10A1, and COL21A1) were enriched in them. Notably, these five biomarkers were confirmed experimentally either in GC (the former four) or in head and neck cancer (the final one) (Table 4), indicating their potential function in the six signaling pathways and the reliability of our study. In addition, in the network of enriched terms (Figure 4B and 4C), the largest subnetwork included 5 clusters (trans-synaptic signaling, post synapse, regulation of system process, inorganic molecular entity transmembrane transporter activity and regulation of ion transport) that were in close proximity and intertwined in space, suggesting that they might be functionally relevant to each other and play an important role in the progression and invasion process of gastric tumor cells together. Among these 5 clusters, FXYD6, a potential prognostic target, was enriched in the post synapse cluster, regulation of system process cluster and regulation of ion transport cluster (Supplementary Table 3). Thus, we speculate that the prognostic FXYD6 and POU6F2-AS2/hsa-mir-137/FXYD6 regulatory axis might affect the pathogenesis of GC by acting on the above three clusters. However, the specific mechanisms still need to be clarified in further studies.
As of February 28, 2022, 63 GC studies related to the ceRNA network have been retrieved from PubMed. Among the 63 articles, five were review articles, 38 were experimental studies (the majority of them did not construct a whole lncRNA (circRNA)/miRNA/mRNA ceRNA axis) and 20 were theoretical studies (among them, only 3 also proposed a complete DElncRNA (DEcircRNA)/DEmiRNA/DEmRNA axis). In 2020, Chen J et al. analyzed DElncRNAs, DEmiRNAs and immune-related DEmRNAs in GC derived from patient samples stored in GEO databases to construct an immune microenvironment-related ceRNA network and proposed two ceRNA regulatory axes (AC104389.28/miR-17-5/SMAD5 axis and LINC01133/miR-17-5p/PBLD axis) [39]. In the same year, Li JX et al. obtained DElncRNA, DEmiRNA and DEmRNA data using the patient samples of gastric tumor in TCGA, GEO and GEPIA (http://gepia.cancer-pku.cn/) databases to construct a prognosis-related ceRNA network and predicted four prognostic ceRNA axes (H19/miR-29a-3p/COL4A1 or COL1A2 or COL5A2 or COL3A1 axes) [40]. In 2021, Li Y et al. derived DEcircRNAs, DEmiRNAs and DEmRNAs in gastric cancer from the patient samples also stored in the GEO and TCGA databases to construct a prognosis-unrelated ceRNA network and further proposed 3 potential regulatory axes (hsa_circ_0058097/hsa_miR_145-5p/SERPINE1 axis, hsa_circ_0058097/hsa_miR_133a-3p/COL1A1 axis, and hsa_circ_0058097/hsa_miR_1-3p/MET axis) [41]. However, deep speculation or discussion of the underlying mechanisms of these axes are lacking in these three studies.
In the present study, (1) we thoroughly compared the abnormal expression of 43 candidate prognostic RNA targets (13 IncRNAs, 2 miRNAs, and 28 mRNAs) in GC from our calculation with those reported in the existing related literature to confirm the reliability and predictability of our study. (2) Enrichment analyses of 204 mRNAs in the ceRNA network revealed the importance of the trans-synaptic signaling cluster as well as the protein digestion and absorption cluster during the aggressive process of GC. (3) In addition to predicting four theoretical lncRNA/miRNA/mRNA axes based on the regulatory relationship of a prognosis-related ceRNA network, we also evaluated the possibility and stability of these axes through the existing experimental literature and further specifically clarified the regulatory mechanism and functional processes of the POU6F2-AS2/hsa-mir-137/OPCML axis. Although the regulatory mechanisms at the transcriptional level and the reliability of these four axes still require verification in future studies, further investigation of these axes in GC would help us understand their key roles in more comprehensive and multilevel ways, and it would facilitate a more precise diagnosis that enables earlier intervention and provides a better prognosis for patients with GC.
Conclusions
In summary, our study used bioinformatics methods to construct a ceRNA network for GC and identified 43 candidate biomarkers (13 lncRNAs, 2 miRNAs, and 28 mRNAs) that were closely associated with the diagnosis and poor prognosis of patients with GC. Among them, two lncRNAs (LNC00469 and AC010145.1) and one mRNA (PRRT4) were novel biomarkers that were discovered for the first time in this study. In addition, based on the regulatory relationships in the ceRNA network, we established four lncRNA/miRNA/mRNA regulatory axes (POU6F2-AS/hsa-mir-137/OPCML, POU6F2-AS2/hsa-mir-137/FAT3, POU6F2-AS2/hsa-mir-137/FXYD6, and POU6F2-AS2/hsa-mir-137/PRRT4) from the 43 DERNA-os. The POU6F2-AS2/hsa-mir-137/OPCML axis containing YBX1 possessed the highest reliability. 204 mRNAs in the ceRNA network might affect the progression of GC through the trans-synaptic signaling cluster and the protein digestion and absorption cluster. In summary, we analyzed the changes in the expression of RNAs and their functions in GC from the perspective of the ceRNA network, including lncRNAs, miRNAs and mRNAs, and identified candidate biomarkers for clinical diagnosis, treatment, drug research, and prognosis. In addition, we identified four potential axes to help study the mechanisms underlying the carcinogenesis and progression of GC in the future.
Acknowledgements
This work was funded by the Key Discipline Construction Project of Guangdong Medical University [4SG21004G] and the Higher Education Reform Project of Guangdong Province [2019268]. We thank American Journal Experts (AJE) for their help in revising the English grammar.
Disclosure of conflict of interest
None.
Supplementary Tables 1 and 2, Supplementary Figure 1
Supplementary Table 3
References
- 1.Sung H, Ferlay J, Siegel RL, Laversanne M, Soerjomataram I, Jemal A, Bray F. Global Cancer statistics 2020: Globocan estimates of incidence and mortality worldwide for 36 cancers in 185 countries. CA Cancer J Clin. 2021;71:209–249. doi: 10.3322/caac.21660. [DOI] [PubMed] [Google Scholar]
- 2.Cao W, Chen HD, Yu YW, Li N, Chen WQ. Changing profiles of cancer burden worldwide and in China: a secondary analysis of the global cancer statistics 2020. Chin Med J (Engl) 2021;134:783–791. doi: 10.1097/CM9.0000000000001474. [DOI] [PMC free article] [PubMed] [Google Scholar]
- 3.Chen JG, Chen HZ, Zhu J, Yang YL, Zhang YH, Huang PX, Chen YS, Zhu CY, Yang LP, Shen K, Qiang FL, Wang GR. Cancer survival in patients from a hospital-based cancer registry, China. J Cancer. 2018;9:851–860. doi: 10.7150/jca.23039. [DOI] [PMC free article] [PubMed] [Google Scholar]
- 4.Carninci P, Kasukawa T, Katayama S, Gough J, Frith MC, Maeda N, Oyama R, Ravasi T, Lenhard B, Wells C, Kodzius R, Shimokawa K, Bajic VB, Brenner SE, Batalov S, Forrest AR, Zavolan M, Davis MJ, Wilming LG, Aidinis V, Allen JE, Ambesi-Impiombato A, Apweiler R, Aturaliya RN, Bailey TL, Bansal M, Baxter L, Beisel KW, Bersano T, Bono H, Chalk AM, Chiu KP, Choudhary V, Christoffels A, Clutterbuck DR, Crowe ML, Dalla E, Dalrymple BP, de Bono B, Della Gatta G, di Bernardo D, Down T, Engstrom P, Fagiolini M, Faulkner G, Fletcher CF, Fukushima T, Furuno M, Futaki S, Gariboldi M, Georgii-Hemming P, Gingeras TR, Gojobori T, Green RE, Gustincich S, Harbers M, Hayashi Y, Hensch TK, Hirokawa N, Hill D, Huminiecki L, Iacono M, Ikeo K, Iwama A, Ishikawa T, Jakt M, Kanapin A, Katoh M, Kawasawa Y, Kelso J, Kitamura H, Kitano H, Kollias G, Krishnan SP, Kruger A, Kummerfeld SK, Kurochkin IV, Lareau LF, Lazarevic D, Lipovich L, Liu J, Liuni S, McWilliam S, Madan Babu M, Madera M, Marchionni L, Matsuda H, Matsuzawa S, Miki H, Mignone F, Miyake S, Morris K, Mottagui-Tabar S, Mulder N, Nakano N, Nakauchi H, Ng P, Nilsson R, Nishiguchi S, Nishikawa S, Nori F, Ohara O, Okazaki Y, Orlando V, Pang KC, Pavan WJ, Pavesi G, Pesole G, Petrovsky N, Piazza S, Reed J, Reid JF, Ring BZ, Ringwald M, Rost B, Ruan Y, Salzberg SL, Sandelin A, Schneider C, Schönbach C, Sekiguchi K, Semple CA, Seno S, Sessa L, Sheng Y, Shibata Y, Shimada H, Shimada K, Silva D, Sinclair B, Sperling S, Stupka E, Sugiura K, Sultana R, Takenaka Y, Taki K, Tammoja K, Tan SL, Tang S, Taylor MS, Tegner J, Teichmann SA, Ueda HR, van Nimwegen E, Verardo R, Wei CL, Yagi K, Yamanishi H, Zabarovsky E, Zhu S, Zimmer A, Hide W, Bult C, Grimmond SM, Teasdale RD, Liu ET, Brusic V, Quackenbush J, Wahlestedt C, Mattick JS, Hume DA, Kai C, Sasaki D, Tomaru Y, Fukuda S, Kanamori-Katayama M, Suzuki M, Aoki J, Arakawa T, Iida J, Imamura K, Itoh M, Kato T, Kawaji H, Kawagashira N, Kawashima T, Kojima M, Kondo S, Konno H, Nakano K, Ninomiya N, Nishio T, Okada M, Plessy C, Shibata K, Shiraki T, Suzuki S, Tagami M, Waki K, Watahiki A, Okamura-Oho Y, Suzuki H, Kawai J, Hayashizaki Y. The transcriptional landscape of the mammalian genome. Science. 2005;309:1559–1563. doi: 10.1126/science.1112014. [DOI] [PubMed] [Google Scholar]
- 5.Djebali S, Davis CA, Merkel A, Dobin A, Lassmann T, Mortazavi A, Tanzer A, Lagarde J, Lin W, Schlesinger F, Xue C, Marinov GK, Khatun J, Williams BA, Zaleski C, Rozowsky J, Röder M, Kokocinski F, Abdelhamid RF, Alioto T, Antoshechkin I, Baer MT, Bar NS, Batut P, Bell K, Bell I, Chakrabortty S, Chen X, Chrast J, Curado J, Derrien T, Drenkow J, Dumais E, Dumais J, Duttagupta R, Falconnet E, Fastuca M, Fejes-Toth K, Ferreira P, Foissac S, Fullwood MJ, Gao H, Gonzalez D, Gordon A, Gunawardena H, Howald C, Jha S, Johnson R, Kapranov P, King B, Kingswood C, Luo OJ, Park E, Persaud K, Preall JB, Ribeca P, Risk B, Robyr D, Sammeth M, Schaffer L, See LH, Shahab A, Skancke J, Suzuki AM, Takahashi H, Tilgner H, Trout D, Walters N, Wang H, Wrobel J, Yu Y, Ruan X, Hayashizaki Y, Harrow J, Gerstein M, Hubbard T, Reymond A, Antonarakis SE, Hannon G, Giddings MC, Ruan Y, Wold B, Carninci P, Guigó R, Gingeras TR. Landscape of transcription in human cells. Nature. 2012;489:101–108. doi: 10.1038/nature11233. [DOI] [PMC free article] [PubMed] [Google Scholar]
- 6.Zhang M, Wu WB, Wang ZW, Wang XH. lncRNA NEAT1 is closely related with progression of breast cancer via promoting proliferation and EMT. Eur Rev Med Pharmacol Sci. 2017;21:1020–1026. [PubMed] [Google Scholar]
- 7.Su J, Liang H, Yao W, Wang N, Zhang S, Yan X, Feng H, Pang W, Wang Y, Wang X, Fu Z, Liu Y, Zhao C, Zhang J, Zhang CY, Zen K, Chen X, Wang Y. MiR-143 and MiR-145 regulate IGF1R to suppress cell proliferation in colorectal cancer. PLoS One. 2014;9:e114420. doi: 10.1371/journal.pone.0114420. [DOI] [PMC free article] [PubMed] [Google Scholar]
- 8.Salmena L, Poliseno L, Tay Y, Kats L, Pandolfi PP. A ceRNA hypothesis: the rosetta stone of a hidden RNA language? Cell. 2011;146:353–358. doi: 10.1016/j.cell.2011.07.014. [DOI] [PMC free article] [PubMed] [Google Scholar]
- 9.Tay Y, Rinn J, Pandolfi PP. The multilayered complexity of ceRNA crosstalk and competition. Nature. 2014;505:344–352. doi: 10.1038/nature12986. [DOI] [PMC free article] [PubMed] [Google Scholar]
- 10.Lu R, Zhao G, Yang Y, Jiang Z, Cai J, Zhang Z, Hu H. Long noncoding RNA HOTAIRM1 inhibits cell progression by regulating miR-17-5p/PTEN axis in gastric cancer. J Cell Biochem. 2019;120:4952–4965. doi: 10.1002/jcb.27770. [DOI] [PubMed] [Google Scholar]
- 11.Zhang Y, Yuan Y, Zhang Y, Cheng L, Zhou X, Chen K. SNHG7 accelerates cell migration and invasion through regulating miR-34a-Snail-EMT axis in gastric cancer. Cell Cycle. 2020;19:142–152. doi: 10.1080/15384101.2019.1699753. [DOI] [PMC free article] [PubMed] [Google Scholar]
- 12.Jeggari A, Marks DS, Larsson E. miRcode: a map of putative microRNA target sites in the long non-coding transcriptome. Bioinformatics. 2012;28:2062–2063. doi: 10.1093/bioinformatics/bts344. [DOI] [PMC free article] [PubMed] [Google Scholar]
- 13.Chen Y, Wang X. miRDB: an online database for prediction of functional microRNA targets. Nucleic Acids Res. 2020;48:D127–D131. doi: 10.1093/nar/gkz757. [DOI] [PMC free article] [PubMed] [Google Scholar]
- 14.Agarwal V, Bell GW, Nam JW, Bartel DP. Predicting effective microRNA target sites in mammalian mRNAs. Elife. 2015;4:e05005. doi: 10.7554/eLife.05005. [DOI] [PMC free article] [PubMed] [Google Scholar]
- 15.Reczko M, Maragkakis M, Alexiou P, Grosse I, Hatzigeorgiou AG. Functional microRNA targets in protein coding sequences. Bioinformatics. 2012;28:771–776. doi: 10.1093/bioinformatics/bts043. [DOI] [PubMed] [Google Scholar]
- 16.Paraskevopoulou MD, Georgakilas G, Kostoulas N, Vlachos IS, Vergoulis T, Reczko M, Filippidis C, Dalamagas T, Hatzigeorgiou AG. DIANA-microT web server v5.0: service integration into miRNA functional analysis workflows. Nucleic Acids Res. 2013;41:W169–173. doi: 10.1093/nar/gkt393. [DOI] [PMC free article] [PubMed] [Google Scholar]
- 17.Shannon P, Markiel A, Ozier O, Baliga NS, Wang JT, Ramage D, Amin N, Schwikowski B, Ideker T. Cytoscape: a software environment for integrated models of biomolecular interaction networks. Genome Res. 2003;13:2498–2504. doi: 10.1101/gr.1239303. [DOI] [PMC free article] [PubMed] [Google Scholar]
- 18.Zhou Y, Zhou B, Pache L, Chang M, Khodabakhshi AH, Tanaseichuk O, Benner C, Chanda SK. Metascape provides a biologist-oriented resource for the analysis of systems-level datasets. Nat Commun. 2019;10:1523. doi: 10.1038/s41467-019-09234-6. [DOI] [PMC free article] [PubMed] [Google Scholar]
- 19.Kaplan EL, Meier P. Nonparametric estimation from incomplete observations. Journal of the American Statistical Association. 1958;53:457–481. [Google Scholar]
- 20.Du W, Wang S, Zhou Q, Li X, Chu J, Chang Z, Tao Q, Ng EK, Fang J, Sung JJ, Yu J. ADAMTS9 is a functional tumor suppressor through inhibiting AKT/mTOR pathway and associated with poor survival in gastric cancer. Oncogene. 2013;32:3319–3328. doi: 10.1038/onc.2012.359. [DOI] [PubMed] [Google Scholar]
- 21.Hu X, Li Y, Kong D, Hu L, Liu D, Wu J. Long noncoding RNA CASC9 promotes LIN7A expression via miR-758-3p to facilitate the malignancy of ovarian cancer. J Cell Physiol. 2019;234:10800–10808. doi: 10.1002/jcp.27903. [DOI] [PubMed] [Google Scholar]
- 22.Wu Y, Wang A, Zhu B, Huang J, Lu E, Xu H, Xia W, Dong G, Jiang F, Xu L. KIF18B promotes tumor progression through activating the Wnt/β-catenin pathway in cervical cancer. Onco Targets Ther. 2018;11:1707–1720. doi: 10.2147/OTT.S157440. [DOI] [PMC free article] [PubMed] [Google Scholar]
- 23.Mattick JS, Makunin IV. Non-coding RNA. Hum Mol Genet. 2006;15 Spec No 1:R17–29. doi: 10.1093/hmg/ddl046. [DOI] [PubMed] [Google Scholar]
- 24.Chan JJ, Tay Y. Noncoding RNA: RNA regulatory networks in cancer. Int J Mol Sci. 2018;19:1310. doi: 10.3390/ijms19051310. [DOI] [PMC free article] [PubMed] [Google Scholar]
- 25.Brown BD, Gentner B, Cantore A, Colleoni S, Amendola M, Zingale A, Baccarini A, Lazzari G, Galli C, Naldini L. Endogenous microRNA can be broadly exploited to regulate transgene expression according to tissue, lineage and differentiation state. Nat Biotechnol. 2007;25:1457–1467. doi: 10.1038/nbt1372. [DOI] [PubMed] [Google Scholar]
- 26.Arvey A, Larsson E, Sander C, Leslie CS, Marks DS. Target mRNA abundance dilutes microRNA and siRNA activity. Mol Syst Biol. 2010;6:363. doi: 10.1038/msb.2010.24. [DOI] [PMC free article] [PubMed] [Google Scholar]
- 27.Kim ER, Selyutina AA, Buldakov IA, Evdokimova V, Ovchinnikov LP, Sorokin AV. The proteolytic YB-1 fragment interacts with DNA repair machinery and enhances survival during DNA damaging stress. Cell Cycle. 2013;12:3791–3803. doi: 10.4161/cc.26670. [DOI] [PMC free article] [PubMed] [Google Scholar]
- 28.Guo TT, Yu YN, Yip GW, Matsumoto K, Bay BH. Silencing the YB-1 gene inhibits cell migration in gastric cancer in vitro. Anat Rec (Hoboken) 2013;296:891–898. doi: 10.1002/ar.22702. [DOI] [PubMed] [Google Scholar]
- 29.Su W, Feng S, Chen X, Yang X, Mao R, Guo C, Wang Z, Thomas DG, Lin J, Reddy RM, Orringer MB, Chang AC, Yang Z, Beer DG, Chen G. Silencing of long noncoding RNA MIR22HG triggers cell survival/death signaling via oncogenes YBX1, MET, and p21 in lung cancer. Cancer Res. 2018;78:3207–3219. doi: 10.1158/0008-5472.CAN-18-0222. [DOI] [PMC free article] [PubMed] [Google Scholar]
- 30.Lim JP, Shyamasundar S, Gunaratne J, Scully OJ, Matsumoto K, Bay BH. YBX1 gene silencing inhibits migratory and invasive potential via CORO1C in breast cancer in vitro. BMC Cancer. 2017;17:201. doi: 10.1186/s12885-017-3187-7. [DOI] [PMC free article] [PubMed] [Google Scholar]
- 31.Liu J, Sun X, Zhu H, Qin Q, Yang X, Sun X. Long noncoding RNA POU6F2-AS2 is associated with oesophageal squamous cell carcinoma. J Biochem. 2016;160:195–204. doi: 10.1093/jb/mvw025. [DOI] [PubMed] [Google Scholar]
- 32.Chu PC, Lin PC, Wu HY, Lin KT, Wu C, Bekaii-Saab T, Lin YJ, Lee CT, Lee JC, Chen CS. Mutant KRAS promotes liver metastasis of colorectal cancer, in part, by upregulating the MEK-Sp1-DNMT1-miR-137-YB-1-IGF-IR signaling pathway. Oncogene. 2018;37:3440–3455. doi: 10.1038/s41388-018-0222-3. [DOI] [PubMed] [Google Scholar]
- 33.Johnson TG, Schelch K, Cheng YY, Williams M, Sarun KH, Kirschner MB, Kao S, Linton A, Klebe S, McCaughan BC, Lin RCY, Pirker C, Berger W, Lasham A, van Zandwijk N, Reid G. Dysregulated expression of the microRNA miR-137 and its target YBX1 contribute to the invasive characteristics of malignant pleural mesothelioma. J Thorac Oncol. 2018;13:258–272. doi: 10.1016/j.jtho.2017.10.016. [DOI] [PubMed] [Google Scholar]
- 34.Wang Y, Zhang J. Identification of differential expression lncRNAs in gastric cancer using transcriptome sequencing and bioinformatics analyses. Mol Med Rep. 2018;17:8189–8195. doi: 10.3892/mmr.2018.8889. [DOI] [PMC free article] [PubMed] [Google Scholar]
- 35.Hu Y, Hu Z, Ding H, Li Y, Zhao X, Shao M, Pan Y. Identification of key biomarkers and potential signaling pathway associated with poor progression of gastric cancer. Transl Cancer Res. 2020;9:5459–5472. doi: 10.21037/tcr-20-926. [DOI] [PMC free article] [PubMed] [Google Scholar]
- 36.Chen W, Zhang W, Wu R, Cai Y, Xue X, Cheng J. Identification of biomarkers associated with histological grade and prognosis of gastric cancer by co-expression network analysis. Oncol Lett. 2019;18:5499–5507. doi: 10.3892/ol.2019.10869. [DOI] [PMC free article] [PubMed] [Google Scholar]
- 37.Liang L, Zhu JH, Chen G, Qin XG, Chen JQ. Prognostic values for the mRNA expression of the ADAMTS family of genes in gastric cancer. J Oncol. 2020;2020:9431560. doi: 10.1155/2020/9431560. [DOI] [PMC free article] [PubMed] [Google Scholar]
- 38.Zhou W, Ouyang J, Li J, Liu F, An T, Cheng L, Kuo ZC, Zhang C, He Y. MRPS17 promotes invasion and metastasis through PI3K/AKT signal pathway and could be potential prognostic marker for gastric cancer. J Cancer. 2021;12:4849–4861. doi: 10.7150/jca.55719. [DOI] [PMC free article] [PubMed] [Google Scholar]
- 39.Chen J, Chen JG, Sun B, Wu JH, Du CY. Integrative analysis of immune microenvironment-related CeRNA regulatory axis in gastric cancer. Math Biosci Eng. 2020;17:3953–3971. doi: 10.3934/mbe.2020219. [DOI] [PubMed] [Google Scholar]
- 40.Li J, Wang X, Wang Y, Yang Q. H19 promotes the gastric carcinogenesis by sponging miR-29a-3p: evidence from lncRNA-miRNA-mRNA network analysis. Epigenomics. 2020;12:989–1002. doi: 10.2217/epi-2020-0114. [DOI] [PubMed] [Google Scholar]
- 41.Li Y, Li R, Wang X, Yuan Y, Zhang Y. A robust circular RNA-associated three-gene prognostic signature for patients with gastric cancer. Biomed Res Int. 2021;2021:6633289. doi: 10.1155/2021/6633289. [DOI] [PMC free article] [PubMed] [Google Scholar]
- 42.Teng F, Zhang JX, Chen Y, Shen XD, Su C, Guo YJ, Wang PH, Shi CC, Lei M, Cao YO, Liu SQ. LncRNA NKX2-1-AS1 promotes tumor progression and angiogenesis via upregulation of SERPINE1 expression and activation of the VEGFR-2 signaling pathway in gastric cancer. Mol Oncol. 2021;15:1234–1255. doi: 10.1002/1878-0261.12911. [DOI] [PMC free article] [PubMed] [Google Scholar]
- 43.Feng L, Li J, Li F, Li H, Bei S, Zhang X, Yang Z. Long noncoding RNA VCAN-AS1 contributes to the progression of gastric cancer via regulating p53 expression. J Cell Physiol. 2020;235:4388–4398. doi: 10.1002/jcp.29315. [DOI] [PubMed] [Google Scholar]
- 44.Huang J, Chen YX, Zhang B. IGF2-AS affects the prognosis and metastasis of gastric adenocarcinoma via acting as a ceRNA of miR-503 to regulate SHOX2. Gastric Cancer. 2020;23:23–38. doi: 10.1007/s10120-019-00976-2. [DOI] [PubMed] [Google Scholar]
- 45.Shan Y, Ying R, Jia Z, Kong W, Wu Y, Zheng S, Jin H. LINC00052 promotes gastric cancer cell proliferation and metastasis via activating the Wnt/β-Catenin signaling pathway. Oncol Res. 2017;25:1589–1599. doi: 10.3727/096504017X14897896412027. [DOI] [PMC free article] [PubMed] [Google Scholar] [Retracted]
- 46.Liao Y, Cao W, Zhang K, Zhou Y, Xu X, Zhao X, Yang X, Wang J, Zhao S, Zhang S, Yang L, Liu D, Tian Y, Wu W. Bioinformatic and integrated analysis identifies an lncRNA-miRNA-mRNA interaction mechanism in gastric adenocarcinoma. Genes Genomics. 2021;43:613–622. doi: 10.1007/s13258-021-01086-z. [DOI] [PubMed] [Google Scholar]
- 47.Wang F, Tang C, Xu D, Tang Y, Jiang Y, Gao X, Xu J. LncRNA ADAMTS9-AS2 suppresses the proliferation of gastric cancer cells and the tumorigenicity of cancer stem cells through regulating SPOP. J Cell Mol Med. 2020;24:4830–4838. doi: 10.1111/jcmm.15161. [DOI] [PMC free article] [PubMed] [Google Scholar]
- 48.Wan J, Jiang S, Jiang Y, Ma W, Wang X, He Z, Wang X, Cui R. Data mining and expression analysis of differential lncRNA ADAMTS9-AS1 in prostate cancer. Front Genet. 2020;10:1377. doi: 10.3389/fgene.2019.01377. [DOI] [PMC free article] [PubMed] [Google Scholar]
- 49.Liang Y, Zhang C, Dai DQ. Identification of DNA methylation-regulated differentially-expressed genes and related pathways using Illumina 450K BeadChip and bioinformatic analysis in gastric cancer. Pathol Res Pract. 2019;215:152570. doi: 10.1016/j.prp.2019.152570. [DOI] [PubMed] [Google Scholar]
- 50.Wu L, Chen J, Ding C, Wei S, Zhu Y, Yang W, Zhang X, Wei X, Han D. MicroRNA-137 Contributes to dampened tumorigenesis in human gastric cancer by targeting AKT2. PLoS one. 2015;10:e0130124. doi: 10.1371/journal.pone.0130124. [DOI] [PMC free article] [PubMed] [Google Scholar] [Retracted]
- 51.Deng J, Lei W, Xiang X, Zhang L, Lei J, Gong Y, Song M, Wang Y, Fang Z, Yu F, Feng M, Sun Z, Chen J, Zhan Z, Xiong J. Cullin 4A (CUL4A), a direct target of miR-9 and miR-137, promotes gastric cancer proliferation and invasion by regulating the Hippo signaling pathway. Oncotarget. 2016;7:10037–10050. doi: 10.18632/oncotarget.7048. [DOI] [PMC free article] [PubMed] [Google Scholar]
- 52.Lei C, Du F, Sun L, Li T, Li T, Min Y, Nie A, Wang X, Geng L, Lu Y, Zhao X, Shi Y, Fan D. miR-143 and miR-145 inhibit gastric cancer cell migration and metastasis by suppressing MYO6. Cell Death Dis. 2017;8:e3101. doi: 10.1038/cddis.2017.493. [DOI] [PMC free article] [PubMed] [Google Scholar]
- 53.Zeng JF, Ma XQ, Wang LP, Wang W. MicroRNA-145 exerts tumor-suppressive and chemo-resistance lowering effects by targeting CD44 in gastric cancer. World J Gastroenterol. 2017;23:2337–2345. doi: 10.3748/wjg.v23.i13.2337. [DOI] [PMC free article] [PubMed] [Google Scholar]
- 54.Yang JD, Ma L, Zhu Z. SERPINE1 as a cancer-promoting gene in gastric adenocarcinoma: facilitates tumour cell proliferation, migration, and invasion by regulating EMT. J Chemother. 2019;31:408–418. doi: 10.1080/1120009X.2019.1687996. [DOI] [PubMed] [Google Scholar]
- 55.Kilic MO, Aynekin B, Kara A, Icen D, Demircan K. Differentially regulated ADAMTS1, 8, and 18 in gastric adenocarcinoma. Bratisl Lek Listy. 2017;118:71–76. doi: 10.4149/BLL_2017_014. [DOI] [PubMed] [Google Scholar]
- 56.Chen ZL, Qin L, Peng XB, Hu Y, Liu B. INHBA gene silencing inhibits gastric cancer cell migration and invasion by impeding activation of the TGF-β signaling pathway. J Cell Physiol. 2019;234:18065–18074. doi: 10.1002/jcp.28439. [DOI] [PubMed] [Google Scholar]
- 57.Zhang C, Li Z, Xu L, Che X, Wen T, Fan Y, Li C, Wang S, Cheng Y, Wang X, Qu X, Liu Y. CXCL9/10/11, a regulator of PD-L1 expression in gastric cancer. BMC Cancer. 2018;18:462. doi: 10.1186/s12885-018-4384-8. [DOI] [PMC free article] [PubMed] [Google Scholar]
- 58.Li C, Zhang J, Wu H, Li L, Yang C, Song S, Peng P, Shao M, Zhang M, Zhao J, Zhao R, Wu W, Ruan Y, Wang L, Gu J. Lectin-like oxidized low-density lipoprotein receptor-1 facilitates metastasis of gastric cancer through driving epithelial-mesenchymal transition and PI3K/Akt/GSK3β activation. Sci Rep. 2017;7:45275. doi: 10.1038/srep45275. [DOI] [PMC free article] [PubMed] [Google Scholar]
- 59.He YX, Song XH, Zhao ZY, Zhao H. HOXA13 upregulation in gastric cancer is associated with enhanced cancer cell invasion and epithelial-to-mesenchymal transition. Eur Rev Med Pharmacol Sci. 2017;21:258–265. [PubMed] [Google Scholar]
- 60.Chen Z, Soutto M, Rahman B, Fazili MW, Peng D, Piazuelo MB, Chen H, Washington MK, Shyr Y, El-Rifai W. Integrated expression analysis identifies transcription networks in mouse and human gastric neoplasia. Genes Chromosomes Cancer. 2017;56:535–547. doi: 10.1002/gcc.22456. [DOI] [PMC free article] [PubMed] [Google Scholar]
- 61.Wang J, Zhang Y, Dou Z, Jiang H, Wang Y, Gao X, Xin X. Knockdown of STIL suppresses the progression of gastric cancer by down-regulating the IGF-1/PI3K/AKT pathway. J Cell Mol Med. 2019;23:5566–5575. doi: 10.1111/jcmm.14440. [DOI] [PMC free article] [PubMed] [Google Scholar]
- 62.Li T, Huang H, Shi G, Zhao L, Li T, Zhang Z, Liu R, Hu Y, Liu H, Yu J, Li G. TGF-β1-SOX9 axis-inducible COL10A1 promotes invasion and metastasis in gastric cancer via epithelial-to-mesenchymal transition. Cell Death Dis. 2018;9:849. doi: 10.1038/s41419-018-0877-2. [DOI] [PMC free article] [PubMed] [Google Scholar]
- 63.Ke H, Wu S, Zhang Y, Zhang G. miR-139-3p/Kinesin family member 18B axis suppresses malignant progression of gastric cancer. Bioengineered. 2022;13:4528–4536. doi: 10.1080/21655979.2022.2033466. [DOI] [PMC free article] [PubMed] [Google Scholar]
- 64.Zhang M, Zhang C, Du W, Yang X, Chen Z. ATAD2 is overexpressed in gastric cancer and serves as an independent poor prognostic biomarker. Clin Transl Oncol. 2016;18:776–781. doi: 10.1007/s12094-015-1430-8. [DOI] [PubMed] [Google Scholar]
- 65.Hong SA, Yoo SH, Lee HH, Sun S, Won HS, Kim O, Ko YH. Prognostic value of Dickkopf-1 and ß-catenin expression in advanced gastric cancer. BMC Cancer. 2018;18:506. doi: 10.1186/s12885-018-4420-8. [DOI] [PMC free article] [PubMed] [Google Scholar]
- 66.Luo T, Zhao J, Lu Z, Bi J, Pang T, Cui H, Yang B, Li W, Wang Y, Wu S, Xue X. Characterization of long non-coding RNAs and MEF2C-AS1 identified as a novel biomarker in diffuse gastric cancer. Transl Oncol. 2018;11:1080–1089. doi: 10.1016/j.tranon.2018.06.007. [DOI] [PMC free article] [PubMed] [Google Scholar]
- 67.Kim SK, Jang HR, Kim JH, Noh SM, Song KS, Kim MR, Kim SY, Yeom YI, Kim NS, Yoo HS, Kim YS. The epigenetic silencing of LIMS2 in gastric cancer and its inhibitory effect on cell migration. Biochem Biophys Res Commun. 2006;349:1032–1040. doi: 10.1016/j.bbrc.2006.08.128. [DOI] [PubMed] [Google Scholar]
- 68.Xing X, Cai W, Ma S, Wang Y, Shi H, Li M, Jiao J, Yang Y, Liu L, Zhang X, Chen M. Down-regulated expression of OPCML predicts an unfavorable prognosis and promotes disease progression in human gastric cancer. BMC Cancer. 2017;17:268. doi: 10.1186/s12885-017-3203-y. [DOI] [PMC free article] [PubMed] [Google Scholar]
- 69.Chun SH, Kim EY, Yoon JS, Won HS, Yim K, Hwang HW, Hong SA, Lee M, Lee SL, Kim SS, Sun S, Ko YH. Prognostic value of noggin protein expression in patients with resected gastric cancer. BMC Cancer. 2021;21:558. doi: 10.1186/s12885-021-08273-x. [DOI] [PMC free article] [PubMed] [Google Scholar]
- 70.Miao Y, Li Q, Sun G, Wang L, Zhang D, Xu H, Xu Z. MiR-5683 suppresses glycolysis and proliferation through targeting pyruvate dehydrogenase kinase 4 in gastric cancer. Cancer Med. 2020;9:7231–7243. doi: 10.1002/cam4.3344. [DOI] [PMC free article] [PubMed] [Google Scholar]
- 71.Liu NQ, Huurne MT, Nguyen LN, Peng T, Wang SY, Studd JB, Joshi O, Ongen H, Bramsen JB, Yan J, Andersen CL, Taipale J, Dermitzakis ET, Houlston RS, Hubner NC, Stunnenberg HG. The non-coding variant rs1800734 enhances DCLK3 expression through long-range interaction and promotes colorectal cancer progression. Nat Commun. 2017;8:14418. doi: 10.1038/ncomms14418. [DOI] [PMC free article] [PubMed] [Google Scholar]
- 72.Long PM, Moffett JR, Namboodiri AAM, Viapiano MS, Lawler SE, Jaworski DM. N-acetylaspartate (NAA) and N-acetylaspartylglutamate (NAAG) promote growth and inhibit differentiation of glioma stem-like cells. J Biol Chem. 2013;288:26188–26200. doi: 10.1074/jbc.M113.487553. [DOI] [PMC free article] [PubMed] [Google Scholar]
- 73.Misawa K, Kanazawa T, Imai A, Endo S, Mochizuki D, Fukushima H, Misawa Y, Mineta H. Prognostic value of type XXII and XXIV collagen mRNA expression in head and neck cancer patients. Mol Clin Oncol. 2014;2:285–291. doi: 10.3892/mco.2013.233. [DOI] [PMC free article] [PubMed] [Google Scholar]
- 74.Luo W, Liu Q, Chen X, Liu H, Quan B, Lu J, Zhang K, Wang X. FXYD6 regulates chemosensitivity by mediating the expression of Na+/K+-ATPase α1 and affecting cell autophagy and apoptosis in colorectal cancer. Biomed Res Int. 2021;2021:9986376. doi: 10.1155/2021/9986376. [DOI] [PMC free article] [PubMed] [Google Scholar] [Retracted]
- 75.Fouad EM, Harb OA, Amin SR, Farargy OME, Habib FM, Gertallah LM. The Expression of FOXE-1 and STIP-1 in Papillary Thyroid carcinoma and their relationship with patient prognosis. Iran J Pathol. 2018;13:256–271. [PMC free article] [PubMed] [Google Scholar]
- 76.Morelli MB, Amantini C, Nabissi M, Liberati S, Cardinali C, Farfariello V, Tomassoni D, Quaglia W, Piergentili A, Bonifazi A, Bello FD, Santoni M, Mammana G, Servi L, Filosa A, Gismondi A, Santoni G. Cross-talk between alpha1D-adrenoceptors and transient receptor potential vanilloid type 1 triggers prostate cancer cell proliferation. BMC Cancer. 2014;14:921. doi: 10.1186/1471-2407-14-921. [DOI] [PMC free article] [PubMed] [Google Scholar]
- 77.Wang CJ, Zhang ZZ, Xu J, Wang M, Zhao WY, Tu L, Zhuang C, Liu Q, Shen YY, Cao H, Zhang ZG. SLITRK3 expression correlation to gastrointestinal stromal tumor risk rating and prognosis. World J Gastroenterol. 2015;21:8398–8407. doi: 10.3748/wjg.v21.i27.8398. [DOI] [PMC free article] [PubMed] [Google Scholar]
- 78.Cheon H, Xing JC, Moosic KB, Ung J, Chan V, Chung DS, Toro MF, Elghawy O, Wang JS, Hamele CE, Hardison RC, Olson TL, Tan SF, Feith D, Aakrosh R, Loughran T. Genomic landscape of TCR alpha-beta and TCR gamma-delta T-large granular lymphocyte leukemia. Blood. 2022 doi: 10.1182/blood.2021013164. blood.2021013164. [DOI] [PMC free article] [PubMed] [Google Scholar]
- 79.Wang W, Wang S, Chu X, Liu H, Xiang M. Predicting the lung squamous cell carcinoma diagnosis and prognosis markers by unique DNA methylation and gene expression profiles. J Comput Biol. 2020;27:1041–1054. doi: 10.1089/cmb.2019.0138. [DOI] [PubMed] [Google Scholar]
- 80.Matsusaka K, Kaneda A, Nagae G, Ushiku T, Kikuchi Y, Hino R, Uozaki H, Seto Y, Takada K, Aburatani H, Fukayama M. Classification of Epstein-Barr virus-positive gastric cancers by definition of DNA methylation epigenotypes. Cancer Res. 2011;71:7187–7197. doi: 10.1158/0008-5472.CAN-11-1349. [DOI] [PubMed] [Google Scholar]
- 81.Li ZM, Zhang HY, Wang YX, Wang WB. MicroRNA-137 is downregulated in human osteosarcoma and regulates cell proliferation and migration through targeting FXYD6. J Drug Target. 2016;24:102–110. doi: 10.3109/1061186X.2015.1057149. [DOI] [PubMed] [Google Scholar]
Associated Data
This section collects any data citations, data availability statements, or supplementary materials included in this article.