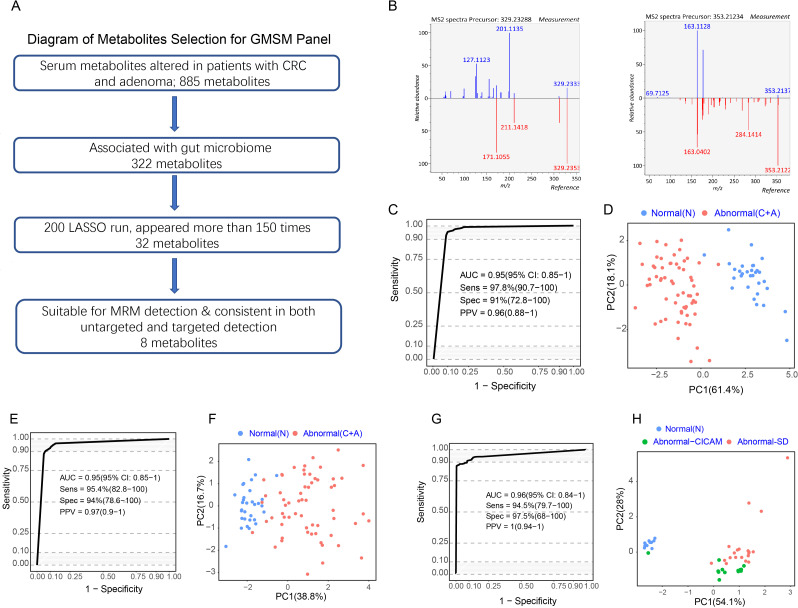
Figure 3.
A panel of gut microbiome-associated serum metabolites could predict colorectal abnormality. (A) Diagram showing the process for metabolites selection involved in the GMSM panel. Among the 885 metabolites significantly altered in abnormal colorectal patients in the discovery cohort, 322 metabolites were associated with the gut microbiome. The LASSO algorithm was further used to select key metabolites, and 32 metabolites appeared more than 75% of the time among 200 LASSO runs. Their feasibility for targeted MRM analysis was evaluated, and targeted metabolic detection was carried out in the discovery cohort. Finally, 8 metabolites showed consistent variances in targeted and untargeted metabolomic analysis in the same cohort. These metabolites were selected as the GMSM panel for further model construction. (B) Mirror plots showing the experimental MS2 spectrums of the inferred metabolites and the MS2 spectrum of related metabolites derived from a public database. Left panel: (Z) −5,8,11-trihydroxyoctadec-9- enoic acid (X14.3_329.233mz neg); right panel: (E) −2-(4,8-dimethylnona-3,7-dien-1-yl) −5-hydroxy-2,7-dimethyl-2H-chromene-8-carbaldehyde (X27.8_353.212mz_neg). (C) ROC curveof the GMSM panel for the discrimination between the normal individuals and abnormal colorectal patients based on untargeted metabolomics detection in the discovery cohort. (D) PCA plot showing the discrimination between the normal and colorectal abnormal individuals by the GMSM panel based on untargeted metabolomics detection in the discovery cohort. € ROC curve of the CRC GMSM panel for the discrimination between the normal individuals and abnormal colorectal patients based on targeted metabolomics detection in the discovery cohort. (F) PCA plot showing the discrimination between the normal individuals and abnormal colorectal patients by the GMSM panel based on targeted metabolomics detection in the discovery cohort. (G) ROC curve of the CRC GMSM panel for the discrimination between the normal individuals and abnormal colorectal patients based on untargeted metabolomics detection in the serum and faeces matched cohort. (H) PCA plot showing the discrimination between the normal individuals and abnormal colorectal patients by the GMSM panel based on untargeted metabolomics detection in the serum and faeces matched cohort. The GMSM panel could also accurately discriminate the normal individuals (blue spots) and the abnormal colorectal patients from two independent sources (green spots indicate patients from CICAMS; red spots indicate patients from SD). CICAMS, Cancer Institute, Chinese Academy of Medical Sciences; CRC, colorectal cancer; GMSM, gut microbiome-associated serum metabolites; MRM, multiple reaction monitoring; PCA, principal component analysis; ROC, receiver operating characteristic.

