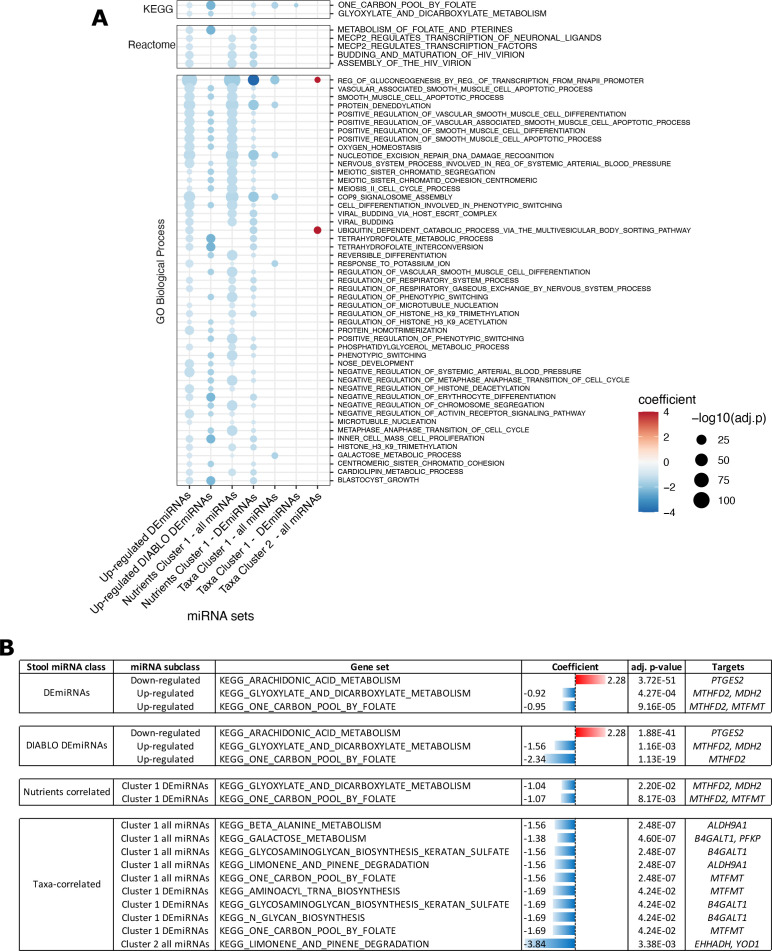
Figure 4.
(A) Dot plot showing the statistical significance of the functional terms identified as enriched in the target of different groups of stool miRNAs differentially expressed among the dietary groups (DEmiRNAs), identified by DIABLO, correlated with nutrient groups or correlated with a group of bacterial species. The size of the dot is proportional to the significance while the colour code refers to the coefficient computed by RBiomirGS. Negative coefficients are related to process predicted to be downregulated based on the miRNA expression change. Only terms enriched in at least two miRNA groups are reported. (B) Table reporting the KEGG metabolic terms enriched in the target of different miRNA groups. The colour-coded bars represent the coefficient computed by RBiomirGS. Positive (red) or negative (blue) coefficients predicted based on the miRNA expression change.

