

Abstract
Objective:
The longitudinal association of blood biomarkers of total tau (t-tau), neurofilament light (Nf-L), and glial fibrillary acidic protein (GFAP) with common sporadic AD and cognitive decline are not established.
Methods:
Using a single molecule array technology, ultrasensitive immunoassays for serum concentrations of total tau (t-tau), neurofilament light (Nf-L), and glial fibrillary acidic protein (GFAP) were measured in a population sample of 1,327 participants (60% African Americans and women) who had a clinical evaluation for AD, completed in-home cognitive assessments, and undergone 1.5T structural MRI.
Results:
Higher concentrations of serum biomarkers were associated with the development of clinical AD, especially, the time-specific associations were notable: t-tau 8–16 years, and Nf-L and GFAP 4–8 years prior to clinical AD. Serum biomarkers were associated with faster cognitive decline over 16 years: baseline t-tau above 0.40 pg/mL had 30% faster decline, Nf-L above 25.5 pg/mL had 110% faster decline, and GFAP above 232 pg/mL had 130% faster decline compared to those in the lowest quartile. Participants with baseline GFAP above 232 pg/mL showed 160% faster decline in hippocampal volume compared to those below 160 pg/mL. Additionally, higher baseline t-tau was associated with faster increase in third ventricular volume, and baseline Nf-L and GFAP were associated with faster decline in cortical thickness.
Interpretation:
Serum t-tau, Nf-L, and GFAP predict the development of sporadic AD and cognitive decline, and changes in structural brain characteristics, suggesting their usefulness not only as screening and predictive biomarkers, but also in capturing the pathogenesis of Alzheimer’s dementia.
Introduction
Promising blood biomarkers of presymptomatic sporadic Alzheimer’s disease (AD) and progression to clinical AD can provide selection, screening, and risk stratification of participants in therapeutic trials, and serve as predictive markers of adverse clinical outcomes including traumatic brain injury (TBI)1 and other neurological disorders.2–6 However, their use as minimally invasive, cost- and time-effective tools for investigating the neurodegenerative processes underlying clinical AD has received less attention. Improved understanding of these biomarkers might lead to enhanced strategies for preventive and therapeutic steps early during the development of the disease.7,8 Total tau (t-tau), neurofilament light (Nf-L), and glial fibrillary acidic protein (GFAP) in blood are three such cytoskeletal biomarkers of interest for which single molecular ultrasensitive immunoassays are available.9
Plasma t-tau is related to cognitive decline,10 hippocampal volume, and neurofibrillary tangles,11 and serum Nf-L with the onset of familial AD.12 In addition, GFAP has also been associated with Alzheimer’s disease13 and cognitive impairment.14,15 However, less is known of how these biomarkers are related to longitudinal cognitive outcomes over a decade, including the time-dependent development of clinical AD, and long-term changes in cognitive functioning and brain morphology. To address these issues of scientific significance, we examined the relations of t-tau, Nf-L, and GFAP with clinically diagnosed AD, as well as rate of cognitive decline and longitudinal changes in structural MRI characteristics, over a 16-year period in a population sample consisting of 1,327 participants with 60% African Americans and women.
Methods
The Chicago Health and Aging Project (CHAP) enrolled participants based on a door-to-door census in four Chicago neighborhoods with a large proportion of African American (AA) and European American (EA) residents.16 The inclusion criteria required only residence in the geographical area and age over 65 years with 80% of all older adults participating in the study. There were up to six triennial cycles of data collection between 1993 and 2012, and four new cohorts of participants who attained the age of 65 during the study were enrolled. About one-third of participants were selected for a clinical assessment for AD during which time blood samples were collected.
The CHAP study collected blood samples in 5,696 participants with 11,600 blood draws during the study duration (1993–2012). However, we were able to perform immunoassays in 3,000 samples due to cost and budgetary constraints. In order to maximize our power to test the time-dependent association with clinical AD, we selected participants who provided multiple blood draws and underwent a clinical diagnosis for AD. Of the 5,696 participants with blood draws, 1,534 participants underwent clinical evaluations, of whom we selected all 454 participants with 4 or more blood draws and two or more cognitive assessments. The remaining 843 participants were randomly selected from 3,148 participants with 3 or less blood draws and two or more population assessment of cognitive tests. Of the total 1,327 participants for this investigation, 742 participants had undergone MRI scan, and 183 of them had two or more longitudinal MRI scans. Figure 1 shows the study design and sample selection for blood biomarker assessments for this investigation.
Figure 1:
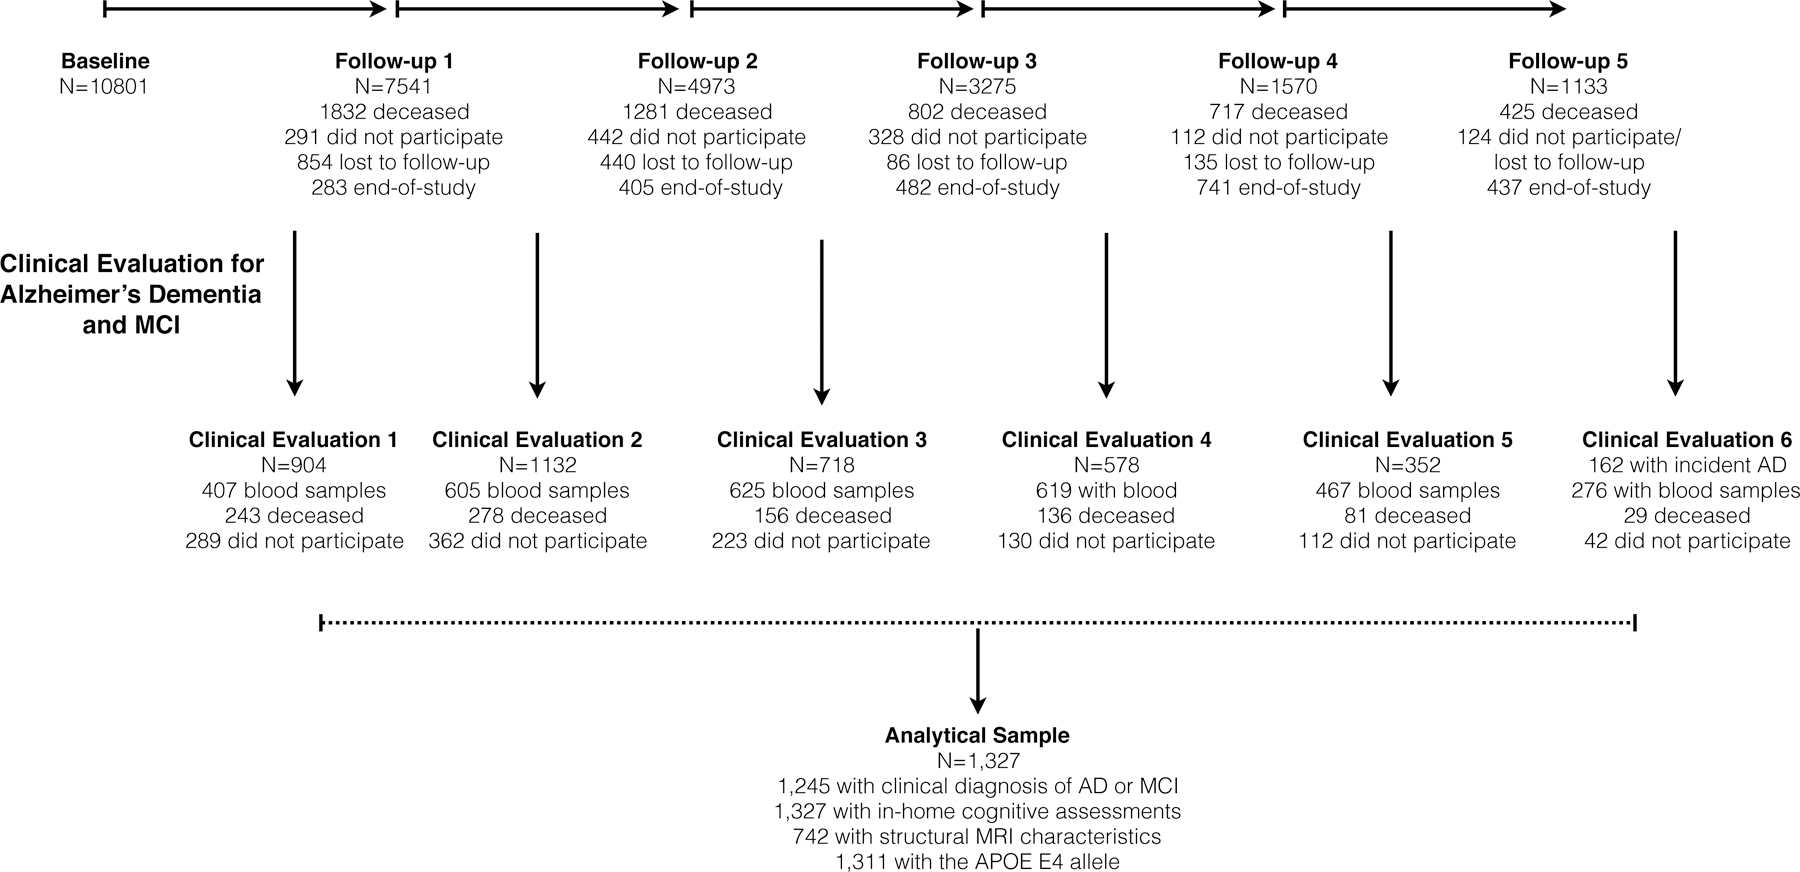
Study Design and Sample Selection for Clinical Evaluation and Blood Collection in a Population Sample
Note: End-of-study: Successive age cohorts who had less follow-up than the original cohort
The Institutional Review Board of the Rush University Medical Center approved the study protocols, and all participants provided written consent for blood collection, population interviews, and clinical evaluations.
Quantification of T-tau, Nf-L, and GFAP
Following blood draws during in-home assessments, study personnel collected and transported blood samples on dry ice to Rush Biorepository freezer at –80°C freezer. All blood samples were collected and frozen between 1994 and 2012. In mid-2019, previously unthawed blood samples were shipped to Quanterix Corporation (Billerica, MA), where three neuronal cytoskeletal biomarkers of neurodegeneration were assayed. The ultrasensitive immunoassays were performed in duplicates using the bead-based HD platform and the Neurology 4Plex A kit. We used the mean concentration based on the average of duplicate measurements. The coefficient of variation between the replicates for total tau was 7.3%, whereas for Nf-L and GFAP was 3.0%.
Global and Individual Tests of Cognition
A brief battery of four cognitive tests were administered to participants during in-home population assessments. We derived a global measure of cognitive function by averaging four cognitive tests – two tests of episodic memory, one test of executive function, and the MMSE, after centering and scaling each to baseline mean and standard deviation of the original cohort.17 Individual cognitive tests were based on standardized tests of memory scores, executive function-based speed scores, and the MMSE.
Clinical Diagnosis of AD and MCI
The clinical diagnosis for AD followed NINCDS/ADRDA guidelines requiring a history of cognitive decline and impairment in at least two cognitive domains.18 To minimize random variability and improve diagnostic decisions across clinicians and time, we developed educationally adjusted cut points on 11 tests19 and used impairment ratings for five cognitive domains: orientation, attention, memory, language, and perception.20 A neuropsychologist, who had access to all cognitive data, education, occupation, and ratings of sensorimotor problems and motivation, agreed or disagreed with each cognitive domain rating and in the event of disagreement supplied a revised rating. A board-certified neurologist with access to all clinical data then agreed or disagreed with the diagnosis algorithm and in the event of disagreement supplied a revised diagnosis. Participants who had impairment in at least one cognitive domain and were judged not to meet dementia criteria by the neurologist were diagnosed with mild cognitive impairment (MCI).
Structural MRI Evaluations
All participants were scanned at the High-Tech Imaging Center, Palos Heights, IL using the same General Electric 1.5T scanner (Excite platform, version 11; General Electric Healthcare, Milwaukee, Wisconsin). Three imaging sequences using fluid-attenuated inversion recovery, SPGR with an echo-time minimum, double-spin echo with a repetition time of 2100 ms.21 The scans digitally transferred to the Imaging of Dementia and Aging Laboratory at UC Davis for processing and analysis. Briefly, non-brain tissue was removed using an atlas-based method and nonlinearly registered by a cubic B-spline deformation template adapted for those over 60.22 The B-spline deformation was modeled using a spatially smooth thin-plate spline interpolation. Structural MRI images were processed to remove the skull using an atlas-based method.23,24 Gray, white and CSF tissues segmentation algorithm was designed to enhance accuracy at likely tissue boundaries after correction for image intensity inhomogeneities.25 Hippocampal and ventricular volumes were computed by a multi-atlas hippocampal segmentation algorithm.24 A registration-based method using Das et al.26 consisted of an initial probabilistic segmentation of GM, WM and CSF after intensity inhomogeneity correction using our segmentation methods.27 For each boundary voxel on the GM/WM boundary, the thickness is calculated as the distance moved under the registration transformation and propagated across the GM mask.
Statistical Analysis
Descriptive statistics using means and standard deviations for continuous characteristics and percentages for categorical characteristics. The first blood draw was treated as the baseline time for cognitive decline analyses and time-dependent biomarker values for clinical AD. The concentrations of serum t-tau, Nf-L, and GFAP were positively skewed and log10 transformed for regression analysis. The coefficients using log10 transformed values provide the association of 10-fold higher biomarkers with cognitive outcomes. To accommodate the scale of biomarkers, we used a 5-fold association of biomarker with cognitive outcomes. The regression models adjusted for age at blood draw, education, female gender, African American race/ethnicity, and the presence of the APOE ε4 allele. A multivariate logistic regression model with time-dependent log10 transformed t-tau, Nf-L, and GFAP also included the time (years) between blood draw and clinical evaluation to examine the association of blood biomarkers with clinical diagnosis of AD and MCI.28 To examine whether the associations were graded and to reduce the influence of extreme values, we performed a set of secondary analysis with participants categorized based on quartiles of assay concentrations. We also examined the coefficient of variation for every 5 year of storage time and did not find any trends. We also performed a sensitivity analysis to examine the effect of storage time on the association of blood biomarkers with clinical AD.
In a separate analysis, the multivariate logistic regression model was stratified by the time between blood draw and clinical diagnosis during four intervals – at the time of diagnosis, within first four years (>0–4 years), between 4 and 8 years, and over 8 (8–16) years prior to diagnosis of AD. Since, the number of participants in 12–16 years was small, we combined them with 8–12 years to improve our statistical power to detect significant odds ratios.
For longitudinal change in cognitive function and change in structural MRI characteristics, a log10 transformed concentration of t-tau, Nf-L and GFAP at baseline blood draw and their interaction with time since baseline (in years) was used to predict longitudinal changes in global and individual tests of memory and speed scores, and structural MRI characteristics using a linear mixed effects model with person-specific intercept and person-specific slope.29 In a second set of analysis, we used quartiles of concentrations of t-tau, Nf-L, and GFAP at the first blood draw to predict longitudinal changes in global cognition and structural MRI characteristics. All generalized linear models and graphical representations were performed using the R program.30
Results
The study sample consisted of 1,327 participants with 3,000 blood draws and cognitive assessments performed between 1995 and 2011 (Table 1). The average age of these participants at baseline was 73.5 (SD= 6.4) years with an education of 12.5 (SD=3.6) years. The sample consisted of 811 (61%) AAs and 824 (62%) women. During the study, 35% (N=436) developed clinical AD, another 25% (N=317) developed MCI, and the remaining 40% (N=492) had no cognitive impairment (NCI). In this study sample, the average time from initial clinical evaluation to development of clinical AD was 6.4 (range: 0–16) years, and the average time of follow-up for cognitive assessments during population interviews was 10.1 (range: 0–16) years.
Table 1.
Characteristics of 1,327 Participants from a Biracial Population Sample
| All Participants | African Americans | European Americans | |
|---|---|---|---|
| N=1,327 | N=811 | N=516 | |
| Age, years1 | 73.5 (6.4) | 72.2 (5.9) | 75.4 (6.8) |
| Education, years1 | 12.5 (3.6) | 11.4 (3.5) | 14.0 (3.2) |
| Global cognition1 | 0.194 (.785) | 0.067 (.756) | 0.393 (.788) |
| Females, %1 | 764, 61% | 455, 61% | 309, 61% |
| Clinical AD, %2 | 436, 35% | 279, 38% | 157, 31% |
| MCI, %3 | 317, 25% | 218, 30% | 99, 20% |
| APOE ε4 allele, %1 | 421, 34% | 274, 36% | 147, 29% |
| Total tau, pg/mL4 | 0.40 (0.23, 0.68) | 0.41 (0.23, 0.69) | 0.40 (0.23, 0.68) |
| 5th – 95th percentile5 | 0.10 – 1.81 | 0.10 – 1.81 | 0.10 – 1.70 |
| n-fold difference6 | 18.9 | 18.9 | 17.7 |
| Nf-L, pg/mL4 | 25.7 (18.6, 37.1) | 24.5 (17.8, 37.2) | 26.9 (20.4, 39.8) |
| 5th – 95th percentile5 | 11.8 – 82.8 | 11.3 – 80.9 | 13.3 – 88.6 |
| n-fold difference6 | 7.0 | 7.2 | 6.7 |
| GFAP, pg/mL4 | 237 (166, 347) | 247 (158, 347) | 230 (174, 347) |
| 5th – 95th percentile5 | 97 – 555 | 96 – 554 | 105 – 562 |
| n-fold difference6 | 5.7 | 5.8 | 5.4 |
NOTE: Means (SD) and N (%) are presented in the table
Baseline demographic and APOE E4 allele characteristics;
Developed clinical AD based on last clinical diagnosis;
Developed MCI but not AD based on last clinical diagnosis
Baseline geometric mean (95% CI) of serum concentration from log10 transformed measurements;
sample quantiles corresponding to 5th and 95th percentiles;
n-fold percent difference in concentrations between 5th and 95th percentile
Baseline t-tau ranged from 0.096 (limit of detection) to 63.3 pg/mL with a geometric mean of 0.40 pg/mL and 19-fold higher concentration between 5th and 95th percentile (Table 1); Nf-L ranged from 0.99 (limit of detection) to 755 pg/mL with a geometric mean of 25.7 pg/mL and 7-fold higher concentration between 5th and 95th percentile; and GFAP ranged from 28.1 (limit of detection) to 6411.5 pg/mL with a geometric mean of 237 pg/mL and 6-fold higher GFAP between 5th and 95th percentile. It is notable that the variation in t-tau was nearly 3-fold higher (5th and 95th percentile) than Nf-L and GFAP. The correlation coefficient between Nf-L and GFAP was highest at 0.56, while the correlation of total tau and GFAP was lowest at 0.31, and the correlation of NFL with total tau was 0.38.
Serum Biomarkers and Development of Clinical AD
Higher concentrations of log10 t-tau, Nf-L, and GFAP were associated with a higher odds ratio for clinically diagnosed AD. For 5-fold higher concentration of t-tau, the odds ratio for clinical AD was 1.67 (95% CI= 1.40, 1.99) compared to NCI (Figure 2A). The association of t-tau with clinical AD was higher among African Americans (OR=2.10, 95% CI= 1.64, 2.71) when compared to European Americans (OR=1.35, 95% CI= 1.05, 1.73) with a p-value of 0.048. We used quartiles to examine the incremental change in the association of serum biomarkers with clinical AD. Participants in the 2nd quartile of t-tau between 0.22–0.40 pg/mL had higher odds ratio for clinical AD (OR=1.36, 95% CI=1.03, 1.77), 3rd quartile between 0.40–0.71 pg/mL with odds ratio of 1.56 (95% CI= 1.19, 2.05), and 4th quartile above 0.71 pg/mL with odds ratio of 1.95 (95% CI= 1.46, 2.59), all compared to participants below 0.22 pg/mL.
Figure 2.
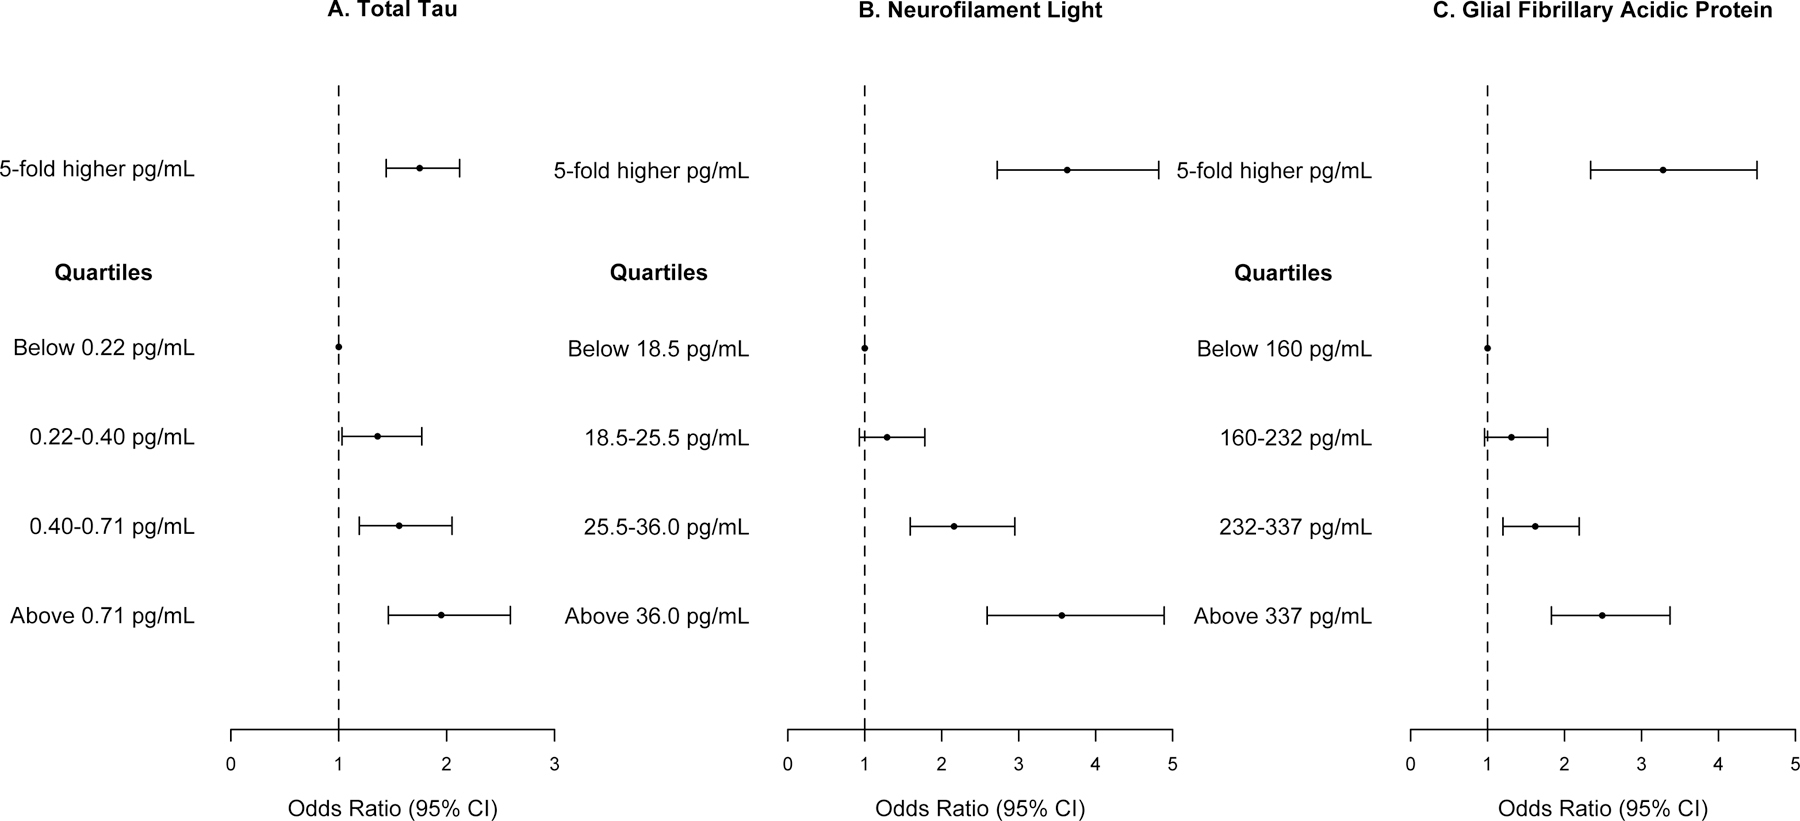
Association of Serum Total Tau, Neurofilament Light Chain, and Glial Fibrillary Acidic Protein with Clinically Diagnosed AD Compared to No Cognitive Impairment in 1,245 Participants from a Biracial Population Sample
Odds ratios and 95% confidence intervals for clinical AD based on quasibinomial logistic regression models adjusted for age, gender, race/ethnicity, education, time between blood draw and clinical diagnosis, and the presence of the APOE ε4 allele.
For 5-fold higher concentration of Nf-L, the odds ratio for AD was 3.63 (95% CI= 2.73, 4.83) (Figure 2B), which was not different between AAs and EAs (p=0.31). The concentration of Nf-L in each higher quartile showed a graded association with clinical AD. Participants in the 3rd quartile of Nf-L between 25.5–36.0 pg/mL had higher odds ratio of clinical AD (OR=2.16, 95% CI= 1.59, 2.95) and 4th quartile of Nf-L above 36.0 pg/mL had an odds ratio of 3.56 for clinical AD (95% CI= 2.59, 4.89) compared to participants below 18.5 pg/mL.
For 5-fold higher concentration of GFAP, the odds ratio for clinical AD was 3.28 (95% CI= 2.38, 4.50) (Figure 2C), which was not different between AAs and EAs (p=0.11). Participants in the 3rd quartile of GFAP between 232–337 pg/mL had a higher odds ratio of clinical AD (OR=1.62, 95% CI= 1.20, 2.19), and participants in the 4th quartile of GFAP above 337 pg/mL had an odds ratio of 2.49 for clinical AD (95% CI= 1.83, 3.37), compared to participants below 160 pg/mL.
In a multivariate regression model including the three blood biomarkers and demographic characteristics, we found that each of the biomarkers were associated with clinical AD. Specifically, for 5-fold higher concentration of blood biomarkers, the odds ratio for clinical AD was 1.44 (95% CI= 1.06, 1.96) for total tau, 3.86 (95% CI= 2.36, 6.31) for Nf-L, and 2.11 (95% CI= 1.23, 3.63) for GFAP.
In a sensitivity analysis for the association of blood biomarkers with clinical AD adjusting for storage time, we found that the association of blood biomarkers was slightly higher for t-tau with odds ratio of clinical AD was 1.71 (95% CI= 1.42, 2.03), lower for Nf-L with odds ratio of 3.58 (95% CI= 2.68, 4.93), and higher for GFAP with odds ratio of 3.32 (95% CI= 2.34, 4.55). We also found no systematic increases in coefficient of variation of the sample duplicates with storage time.
Serum Biomarkers and Development of Clinical AD at Specific Time Intervals
The association of t-tau with clinically diagnosed AD was highest during the longest time interval prior to diagnosis (Table 2). At the time of diagnosis, 5-fold higher concentration of t-tau was associated with an odds ratio of clinical AD of 1.61 (95% CI= 1.22, 2.13, N=889), which at 8–16 years prior to clinical diagnosis was 3.51 (95% CI= 1.02, 12.16, N=149). Therefore, t-tau was associated with a significantly increased risk of developing clinical AD over 16 years prior to the diagnosis with small differences in t-tau resulting in higher odds ratios.
Table 2.
Time-Dependent Odds Ratio (95% CI) of 5-Fold Association of Serum Total Tau, Neurofilament Light, and Glial Fibrillary Acidic Protein with Clinically Diagnosed AD in 1,245 Participants from a Biracial Population Sample
| Years Prior to Developing Clinical Disease | ||||
|---|---|---|---|---|
| At Diagnosis | 0–4 years | 4–8 years | 8–16 years | |
| OR (95% CI) | OR (95% CI) | OR (95% CI) | OR (95% CI) | |
| Average time, y | 0 | 3 | 6 | 11 |
|
| ||||
| Clinically Diagnosed AD | ||||
| Sample size | N=889/AD=271 | N=1,026/AD=365 | N=308/AD=110 | N=149/AD=42 |
| Total Tau, pg/mL | 1.61 (1.22, 2.13) | 1.61 (1.24, 2.09) | 1.95 (1.12, 3.40) | 3.51 (1.02, 12.16) |
| Nf-L, pg/mL | 2.77 (1.81, 4.23) | 4.84 (3.09, 7.57) | 4.43 (1.72, 11.40) | 2.57 (0.45, 14.62) |
| GFAP, pg/mL | 3.58 (2.12, 6.03) | 3.30 (2.06, 5.28) | 3.32 (1.26, 8.74) | 2.16 (0.43, 10.97) |
|
| ||||
| Clinically Diagnosed MCI | ||||
| Sample size | N=1,050/MCI=432 | N=1,082/421 | N=339/141 | N=155/48 |
| T-tau, pg/mL | 0.99 (0.78, 1.25) | 1.22 (0.96, 1.56) | 1.63 (1.01, 2.63) | 3.96 (1.35, 11.66) |
| Nf-L, pg/mL | 1.54 (1.08, 2.21) | 1.52 (1.03, 2.23) | 1.51 (0.73, 3.11) | 1.74 (0.48, 6.32) |
| GFAP, pg/mL | 1.40 (0.92, 2.11) | 1.09 (0.71, 1.66) | 1.15 (0.55, 2.43) | 1.03 (0.30, 3.56) |
NOTE: All serum biomarkers were log10 transformed in quasibinomial logistic regression models and log odds of clinical AD adjusted for age, gender, race/ethnicity, education, and the presence of the APOE ε4 allele.
The association of Nf-L with clinical AD was high over 8 years prior to diagnosis (Table 2). At the time of diagnosis, 5-fold higher concentration of Nf-L was associated with a higher odds ratio of clinical AD (OR=2.77, 95% CI=1.81, 4.23), which at 0–4 years was 4.84 (95% CI= 3.09, 7.57) and at 4–8 years was 4.43 (95% CI= 1.72, 11.40). The association of GFAP with clinical AD also remained high until 8 years prior to developing AD (Table 2). Overall, 5-fold higher concentration of GFAP was associated with clinical AD with an estimated odds ratio of 3.58 (95% CI= 2.12, 6.03), which at 0–4 years was 3.30 (95% CI= 2.06, 5.28) and at 4–8 years was 3.32 (95% CI= 1.26, 8.74). However, the association of Nf-L and GFAP with clinical AD was not significant 8–16 years prior to diagnosis.
Serum Biomarkers and Clinically Diagnosed MCI
Higher concentrations of t-tau, Nf-L, and GFAP were associated with clinically diagnosed MCI. Specifically, for 5-fold higher t-tau, the odds ratio for MCI was 1.16 (95% CI=1.01, 1.35) compared to NCI. Similar to the trend observed for clinical AD, the odds ratio for MCI was 3.96 (95% CI= 1.35, 11.66) for 8–16 years prior to diagnosis of MCI, whereas t-tau was not associated cross-sectionally at the time of diagnosis (Table 2). For 5-fold higher neurofilament light, odds ratio for MCI was 1.55 (95% CI=1.22, 2.25) compared to NCI. Associations were significant at diagnosis and at 0–4 years prior to diagnosis. However, GFAP was not associated with MCI either overall or over time suggesting its relation to more severe cognitive impairment.
Serum Biomarkers and Longitudinal Cognitive Decline
Higher baseline concentrations of t-tau, NF-L, and GFAP were associated with lower score of baseline cognitive function and increased rate of cognitive decline (Table 3). These associations did not differ between AAs and EAs. Quartiles of serum biomarkers were also associated with lower baseline global cognitive function scores and faster rate of cognitive decline (Figure 3), suggesting a consistent longitudinal association of serum biomarkers with cognitive decline.
Table 3.
Association of 5-Fold Higher Serum Concentration of Total Tau, Neurofilament Light, and Glial Fibrillary Acidic Protein with Baseline Level and Annual Rate of Decline in Global and Individual Tests of Cognition in 1,327 Participants from a Biracial Population Sample
| Global Cognition Coefficient (95% CI) |
Memory Score Coefficient (95% CI) |
Speed Score Coefficient (95% CI) |
|
|---|---|---|---|
| Increase in Baseline Score of Cognition1 | |||
| T-Tau, pg/mL | −0.110 (−0.172, −0.047) | −0.100 (−0.027, −0.172) | −0.113 (−0.039, −0.186) |
| Nf-L, pg/mL | −0.237 (−0.142, −0.332) | −0.168 (−0.058, −0.279) | −0.314 (−0.203, −0.425) |
| GFAP, pg/mL | −0.195 (−0.081, −0.310) | −0.149 (−0.017, −0.281) | −0.169 (−0.035, −0.305) |
|
| |||
| Increase in Annual Rate of Cognitive Decline2 | |||
| T-Tau, pg/mL | 0.009 (0.002, 0.016) | 0.002 (−0.007, 0.011) | −0.0004 (0.007, −0.008) |
| Nf-L, pg/mL | 0.033 (0.022, 0.043) | 0.022 (0.009, 0.035) | 0.016 (0.005, 0.026) |
| GFAP, pg/mL | 0.045 (0.033, 0.057) | 0.016 (0.009, 0.021) | 0.022 (0.010, 0.034) |
NOTE: A linear mixed effects regression model with log10 transformed serum biomarkers adjusted for age, gender, race/ethnicity, education, and the presence of the APOE ε4 allele.
Negative baseline scores of cognition shows higher baseline biomarker concentrations were associated with lower standardized cognitive scores.
Positive annual rate of cognitive decline shows that higher baseline biomarker concentrations were associated with faster rate of cognitive decline.
Figure 3:
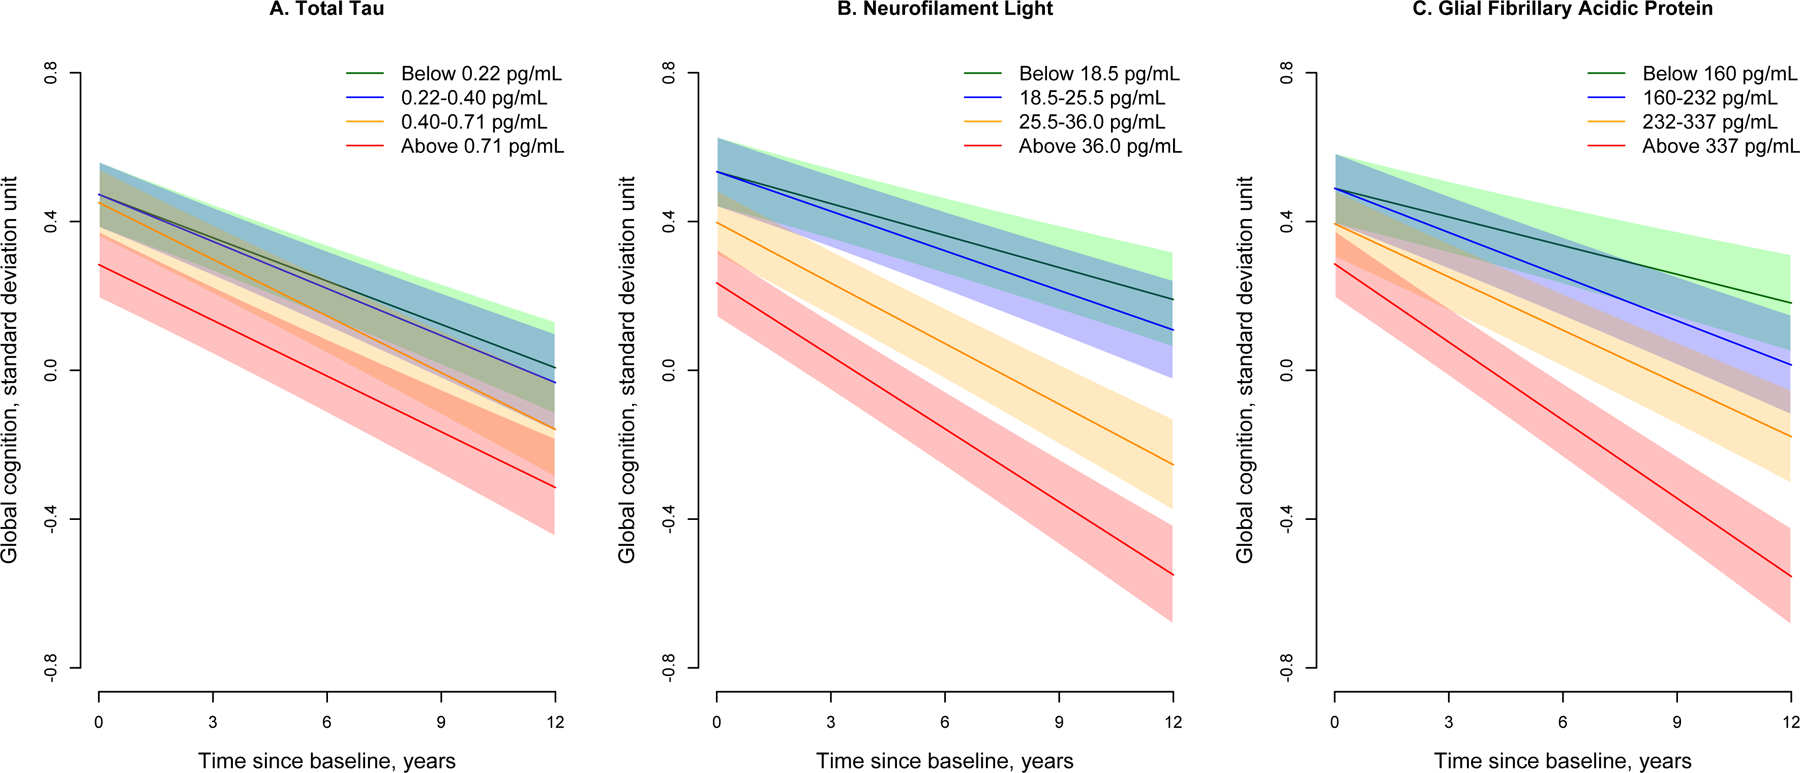
Longitudinal Trajectories of Global Cognition for Quartiles of Serum Total Tau, Neurofilament Light, and Glial Fibrillary Acidic Protein in 1,327 Participants from a Biracial Population Sample
Cognitive trajectories are based on linear mixed effects regression models adjusted for age, gender, race/ethnicity, education, and the presence of the APOE ε4 allele. Green line shows the lowest quartile, blue shows the 2nd quartile, orange shows the 3rd quartile, and red shows the highest quartile of biomarker concentrations. The 95% confidence bands for predicted cognitive scores are also shown.
For every 5-fold higher t-tau, the rate of decline in global cognition increased by 0.009 standard deviation unit (SDU) per year (Table 3). Participants in 3rd and 4th quartiles of t-tau showed a faster rate of decline (95% confidence bands also presented) compared to participants in the lowest quartile (Figure 3A). Specifically, the rate of decline in global cognition was 0.038 SDU per year for participants in the lowest quartile (green), which increased to 0.051 SDU per year for participants in 3rd (orange) and 4th quartile (red), roughly 32% faster (p=0.001) rate of longitudinal cognitive decline.
For every 5-fold higher Nf-L, the rate of decline in global cognition increased by 0.033-SDU per year (Table 3). Among participants with Nf-L below 18.5 pg/ml (lowest quartile), the rate of global cognitive decline was 0.029 SDU per year (green), which increased to 0.055 SDU per year in 3rd (orange) for participants 25.5–36.0 pg/mL (88% faster; p<0.001) and 0.066 SDU per year in 4th quartile (red) for participants above 36.0 pg/mL (125% faster; p<0.001) (Figure 3B). Participants with Nf-L between 25.5–36.0 pg/mL also had baseline global cognitive scores lower by 0.137 (95% CI= 0.035, 0.238) and those above 36.0 pg/mL by 0.299 (95% CI= 0.193, 0.404) SDU compared to those below 18.5 pg/mL.
For 5-fold higher GFAP, the rate of decline in global cognition increased by 0.045 SDU per year. Among participants with GFAP in the lowest quartile (below 160 pg/mL), the rate of cognitive decline was 0.026 SDU per year (green), which increased to 0.040 SDU per year in 2nd (blue) among participants between 160–232 pg/mL (55% faster; p=0.008), 0.048 SDU per year in 3rd (orange) among 232–337 pg/mL (85% faster; p<0.001), and 0.070 SDU per year in 4th quartile (red) among those above 337 pg/mL (188% faster; p<0.001) (Figure 3C). Participants with GFAP above 337 pg/mL had global cognition score lower by 0.203 (95% CI= 0.095, 0.310) compared to participants with GFAP below 160 pg/mL.
Table 3 also shows that t-tau was associated with baseline level of memory and speed score tests, but not with longitudinal change in episodic and perceptual speed scores. However, Nf-L and GFAP were associated with baseline levels and longitudinal decline in memory and speed score tests.
Serum Biomarkers and Longitudinal Change in Structural MRI
In a sample of 742 participants, baseline concentrations of t-tau were associated with lower cortical thickness (Table 4), whereas, Nf-L was associated with lower total brain volume, and higher white matter hyperintensities (WMH) and third ventricular volumes. Participants with higher concentrations of GFAP also had higher lateral and third ventricular volumes.
Table 4.
Association of Baseline Serum Concentrations of Total Tau, Neurofilament Light, and Glial Fibrillary Acidic Protein with Longitudinal Changes in 743 Participants with Structural MRI Characteristics
| Total Tau Estimate (95% CI) |
NF-L Estimate (95% CI) |
GFAP Estimate (95% CI) |
|
|---|---|---|---|
| Baseline Structural MRI Characteristics | |||
| Total brain volume | −1.14 (−5.24, 2.96) | −6.76 (−12.9, −0.57) | 0.97 (−5.98, 7.92) |
| WMH, cc | 6.6% (−10.7%, 27.3%) | 40.7% (7.7, 84.0) | 27.6% (−5.1, 71.7) |
| Hippocampal volume, cc | 0.047 (−0.059, 0.152) | 0.028 (−0.119, 0.175) | 0.127 (−0.059, 0.195) |
| Lateral ventricles, cc | 1.48 (−1.13, 4.09) | 1.48 (−2.46, 5.42) | 4.51 (0.22, 8.79) |
| Third ventricles, cc | 0.022 (−0.039, 0.084) | 0.108 (0.022, 0.194) | 0.104 (0.008, 0.199) |
| Cortical thickness, mm | −5.03 (−7.64, −2.43) | 0.75 (−3.25, 4.76) | 1.10 (−3.33, 5.54) |
|
| |||
| Rate of Change in Structural MRI Characteristics | |||
| Total brain volume | −0.21 (−0.55, 0.12) | −0.33 (−0.76, 0.11) | −0.42 (−0.96, −0.11) |
| WMH, cc | −3.6% (−7.7%, 0.7%) | −5.0% (−10.8%, 1.1%) | −4.4% (−11.1%, 2.8%) |
| Hippocampal volume, cc | −0.037 (−0.062, −0.012) | −0.049 (−0.083, −0.015) | −0.096 (−0.134, −0.058) |
| Lateral ventricles, cc | 0.170 (−0.233, 5.72) | 0.530 (−0.021, 1.081) | 0.599 (−0.003, 1.204) |
| Third ventricles, cc | 0.031 (0.008, 0.054) | −0.001 (−0.030, 0.030) | −0.010 (−0.034, 0.023) |
| Cortical thickness, mm | 0.54 (−0.58, 1.67) | −1.57 (−3.05, −0.09) | −1.80 (−3.41, −0.20) |
NOTE: All serum biomarkers were log10 transformed in regression model and adjusted for age, gender, race/ethnicity, education, and presence of the APOE ε4 allele in a linear mixed effects regression model with main effects for log10 transformed concentration and interaction of log10 transformed concentration with time since initial MRI (in years).
All three baseline serum biomarkers, t-tau, Nf-L, and GFAP were associated with a higher longitudinal decrease in hippocampal volume (Table 4). For 5-fold higher concentration, the decline in hippocampal volume increased by 0.037cc per year for t-tau, 0.049cc per year for Nf-L, and 0.096cc per year for GFAP.
Figure 4 shows the association of baseline serum biomarkers with longitudinal change in structural MRI characteristics. Participants with baseline serum GFAP between 232–337 pg/mL (3rd quartile) had hippocampal volume decline by 0.095cc (95% CI= 0.065, 0.125) per year, above 337 pg/mL (4th quartile) with a decline of 1.11cc (95% CI= 0.069, 0.154) per year, compared to participants below 160 pg/mL (lowest quartile) with a decline of 0.038cc (95% CI= 0.014, 0.062) per year, Figure 4A. Participants with baseline serum t-tau above 0.71 pg/mL (4th quartile) had third larger ventricle volume with a slower decline by 0.013cc (95% CI= 0.006, 0.032; p=0.009) compared to participants below 0.22 pg/mL (1st quartile) with a decline of 0.051cc (95% CI= 0.039, 0.073), Figure 4B. Participants with baseline serum Nf-L above 36.0 pg/mL (4th quartile) had annual cortical thickness decline by 4.59mm (95% CI= 3.29, 5.86; p=0.026) compared to participants below 18.5 pg/mL (1st quartile) who had a decline of 2.79mm (95% CI= 1.83, 3.74), Figure 4C. Participants with baseline serum GFAP between 232–337 pg/mL (3rd quartile) had annual cortical thickness decline by 4.24mm (95% CI= 3.18, 5.29; p=0.019), above 372 pg/mL (4th quartile) with a decline of 4.78mm (95% CI= 3.33, 6.24; p=0.012), compared to participants below 160 pg/mL with a decline of 2.54mm (95% CI= 1.57, 3.50), Figure 4D.
Figure 4:
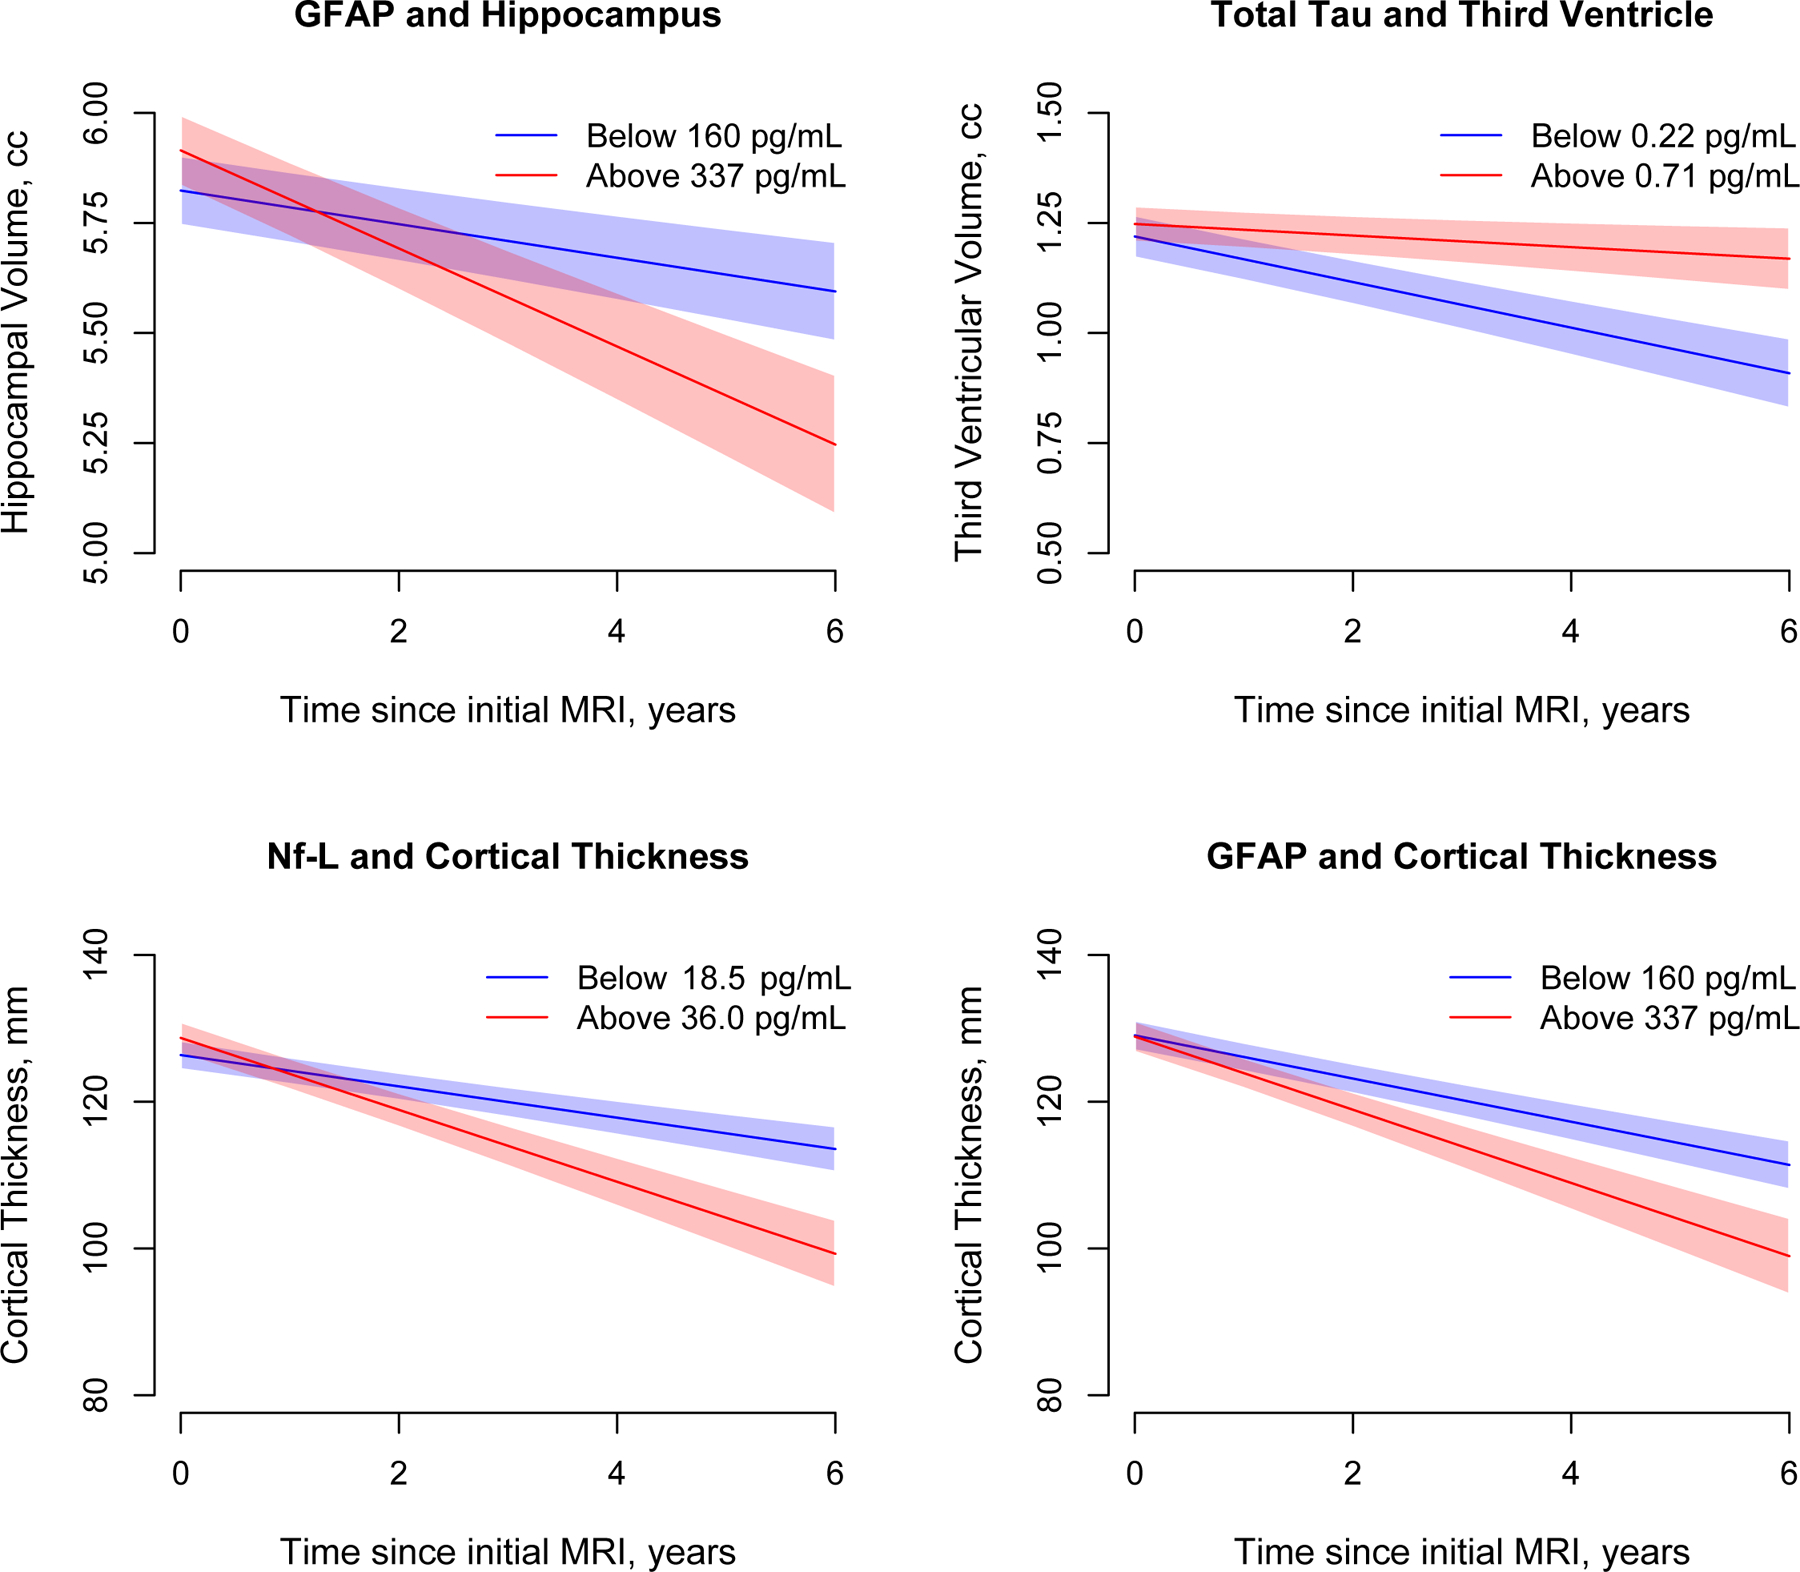
Longitudinal Changes in Structural MRI Characteristics for Quartiles of Serum Total Tau, Neurofilament Light, and Glial Fibrillary Acidic Protein in 742 Participants from a Biracial Population Sample
Change in structural MRI characteristics of hippocampal and third ventricular volumes, and cortical thickness are based on linear mixed effects regression models adjusted for age, gender, race/ethnicity, education, and the presence of the APOE ε4 allele. Green line shows the lowest quartile and red shows the highest quartile of biomarker concentrations. The 95% confidence bands for predicted values are also shown.
Discussion
Our results build on the findings of serum Nf-L as a biomarker for familial AD7 and on the results of numerous studies of the proximate associations of CSF and plasma biomarkers of clinical AD.12,13,,31,32 Our contributions stem from its focus on frequent sporadic clinically diagnosed AD, its population-based, biracial design, its large size, and the implications of its findings for the potential use of serum biomarkers from ultrasensitive immunoassays as tools for screening, predicting, and potentially investigating AD pathogenesis.
The three cytoskeletal biomarkers investigated here, t-tau, Nf-L, and GFAP are related to neurodegenerative diseases,33 although our clinical diagnosis is specific to AD and dementia. Each is an essential cytoskeletal protein with t-tau and Nf-L commonly expressed in neurons and GFAP in astroglia. Aggregation of tau characterizes several other neurodegenerative conditions,34 and each reported as a robust marker for adverse clinical consequences including traumatic brain injury.35 It is likely that these biomarkers denote the neurodegenerative processes underlying clinical AD as well as other common dementia pathologies including cerebrovascular disease. Their associations with clinical AD over a decade prior to clinical diagnosis, the variation in the temporal pattern of these associations, with Nf-L and GFAP associated with clinical AD 8 years proximate to diagnosis, while t-tau was associated 8–16 years before diagnosis, and the general acceptability of providing blood samples in large studies of unaffected people each suggest that these biomarkers might be useful tools for further elucidating the causes and consequences of neurodegeneration and may provide an opportunity to identify individuals for early intervention.
Further, our data support the hypothesis that clinical AD is the consequence of pathological processes that extend over decades. The time course of t-tau impact on clinical AD supports this hypothesis and the weakening impact of t-tau measures as they approach the time of diagnosis is remarkably similar to the impact of vascular risk factor influence on brain injury and dementia.36,37 If this hypothesis is proven to be correct, further characterizing genetic, health and lifestyle factors of younger individuals, especially in mid-life, with elevated t-tau will likely lead to identification of novel and potentially modifiable risk factors for late-life clinical AD.
All three serum cytoskeletal biomarkers predicted lower baseline cognitive function scores and faster cognitive decline. Notably, the highest quartiles of serum Nf-L and GFAP were associated with a faster rate of cognitive decline over an observation period spanning 16 years. Plasma t-tau has shown to be associated with a steeper decline in global cognition over three years5 and Nf-L with short-term changes in cognition.38 Our findings that serum t-tau level is a robust remote predictor of clinically diagnosed AD is compatible with recent findings that tauopathy seen on multi-tracer PET among cognitively unimpaired older adults is associated with better meta-memory monitoring.39 GFAP’s associations with cognitive decline have not been extensively studied, however, the increase in rate of cognitive decline observed among those above 337 pg/mL is noteworthy.
Our results show that the impact of these neurodegenerative markers did not differ by race. While the exact underlying pathophysiology of clinically diagnosed AD may differ by race/ethnicity,40,41 the outcome of these processes, as seen by the consistent associations between these measures and development of clinical AD or MCI or rates of cognitive decline, support the hypothesis that the consequence of brain injury may have a common downstream pathogenic consequence that is captured by these biomarkers.
Although higher levels of t-tau have been shown to be associated with smaller hippocampal volume in the Framingham Heart Study,13 this is the first study to show that higher levels of t-tau are also associated with longitudinal changes in hippocampal volume suggesting a potential biological relationship of total tau with hippocampal volume. Higher t-tau also predicted increases in third ventricular volume over time, which supports the hypothesis that ventricular expansion reflects neuronal loss.
Few pathological studies show a relationship between astroglia expression and degenerative or vascular diseases,42,43 the relation of these glial proteins measured in blood to changes in structural brain characteristics is novel, particularly our finding that they are associated with a higher rate of hippocampal atrophy. This finding has several important implications. One, it could lead to early development of clinical AD suggesting a greater amount of progressive atrophy. Second, total tau and Nf-L were also associated with longitudinal changes in hippocampal volume, supporting the notion that the level of these blood proteins (when abnormal) reflect brain degeneration. Third, the presence of these blood proteins could be used to monitor disease activity in treatment trials or even be the source of disease modification.
Serum Nf-L was also higher in individuals with WMH severity.44,45 However, t-tau and GFAP were not associated with WMH, which suggests that the pathobiological concentration of serum Nf-L may be more specific to cerebrovascular disease. Both Nf-L and GFAP showed specific patterns of cortical thinning in the MRI scans, such cortical thinning signatures appear to be associated with AD risk and progression.46 Differences in the relation of these serum biomarkers to longitudinal change in structural MRI characteristics are potentially significant, since they suggest differences in pathological mechanisms during the progression to clinical AD. The longitudinal change in these blood biomarkers are also of potential interest in our future work that will provide additional understanding of the underlying pathological processes.
Limitations of our study include restriction to three cytoskeletal biomarkers t-tau, Nf-L, and GFAP in serum, lack of a substantial number of other minority populations, limitation of observations to a maximum of 16 years prior to clinical diagnosis, and lack of neuropathological autopsy material. Inclusion of ultrasensitive assays of other markers of neurodegeneration, especially ones representing non-cytoskeletal elements, including Aβ−40 and Aβ−42, may provide further clues to support their potential as markers of clinical AD pathogenesis; the availability of autopsy material also may have provided more pathological relevance. The preclinical course of AD may be longer than demonstrated,47 and observation extending into mid-life or earlier may provide better understanding of the pre-symptomatic changes prior to the development of clinical AD. The CHAP study had about 6% dropout with lower cognition. The association of the blood biomarkers with level of cognition suggests that including the dropouts is more likely to make the associations larger than reported.
Our study reports that the three cytoskeletal biomarkers: t-tau, Nf-L, and GFAP are useful biomarkers for future development of clinical AD, MCI, cognitive decline, and changes in structural MRI characteristics in a population sample of older adults. Our study also reports that these blood biomarkers have a graded association with the risk of clinical AD, faster rate of cognitive decline at higher concentrations, and changes in hippocampal volume and cortical thickness. Importantly, t-tau behaves as a remote biomarker to predict clinical outcomes, whereas Nf-L and GFAP behave more as proximal biomarkers and showed consistent associations with changes in brain morphology.
Acknowledgements:
This study was supported by NIH R01 grants – R01AG051635, RF1AG057532, R01AG058679.
Footnotes
Potential Conflicts of Interest: The authors have no potential conflicts of interest.
REFERENCES
- 1.Gan ZS, Stein SC, Swanson R, et al. Blood biomarkers for traumatic brain injury: A quantitative assessment of diagnostic and prognostic accuracy. Front Neurol 2019;10:446. [DOI] [PMC free article] [PubMed] [Google Scholar]
- 2.Sandelius Å, Zetterberg H, Blennow K, et al. Plasma neurofilament light chain concentration in the inherited peripheral neuropathies. Neurology 2018;90:e518–e524. [DOI] [PMC free article] [PubMed] [Google Scholar]
- 3.Lin CH, Li CH, Yang KC, et al. Blood NfL: A biomarker for disease severity and progression in Parkinson disease. Neurology 2019;93:e1104–e1111. [DOI] [PubMed] [Google Scholar]
- 4.Hansson O, Janelidze S, Hall S, et al. Blood-based NfL: A biomarker for differential diagnosis of parkinsonian disorder. Neurology 2017;88:930–937. [DOI] [PMC free article] [PubMed] [Google Scholar]
- 5.Lu CH, Macdonald-Wallis C, Gray E, et al. Neurofilament light chain: A prognostic biomarker in amyotrophic lateral sclerosis [published correction appears in Neurology. 2015 Sep 8;85(10):921]. Neurology 2015;84:2247–2257. [DOI] [PMC free article] [PubMed] [Google Scholar]
- 6.Rojas JC, Karydas A, Bang J, et al. Plasma neurofilament light chain predicts progression in progressive supranuclear palsy. Ann Clin Transl Neurol 2016;3:216–225. [DOI] [PMC free article] [PubMed] [Google Scholar]
- 7.Thambisetty M, Lovestone S. Blood-based biomarkers of Alzheimer’s disease: challenging but feasible. Biomark Med 2010;4:65–79. [DOI] [PMC free article] [PubMed] [Google Scholar]
- 8.Elahi FM, Casaletto KB, La Joie R, et al. Plasma biomarkers of astrocytic and neuronal dysfunction in early- and late-onset Alzheimer’s disease. Alzheimers Dement 2020;16:681–695. [DOI] [PMC free article] [PubMed] [Google Scholar]
- 9.Zetterberg H Biomarkers reflecting different facets of Alzheimer’s disease. Eur J Neurol 2008;15:1143–1144. [DOI] [PubMed] [Google Scholar]
- 10.Peltz CB, Kenney K, Gill G, Diaz-Arrastia R, et al. Blood biomarkers of traumatic brain injury and cognitive impairment in older veterans. Neurology Jun 2020, 10.1212/WNL.0000000000010087. [DOI] [PMC free article] [PubMed] [Google Scholar]
- 11.Zetterberg H Blood-based biomarkers for Alzheimer’s disease – An update. J Neurosci Methods 2019;319:2–6. [DOI] [PubMed] [Google Scholar]
- 12.Mielke MM, Hagen CE, Wennberg AMV, et al. Association of plasma total tau level with cognitive decline and risk of mild cognitive impairment or dementia in the mayo clinic study on aging. JAMA Neurol 2017;74:1073–1080. [DOI] [PMC free article] [PubMed] [Google Scholar]
- 13.Pase MP, Beiser AS, Himali JJ, et al. Assessment of Plasma Total Tau Level as a Predictive Biomarker for Dementia and Related Endophenotypes. JAMA Neurol 2019;76:598–606. [DOI] [PMC free article] [PubMed] [Google Scholar]
- 14.Preische O, Schultz SA, Apel A, et al. Serum neurofilament dynamics predicts neurodegeneration and clinical progression in presymptomatic Alzheimer’s disease. Nat Med 2019;25:277–283. [DOI] [PMC free article] [PubMed] [Google Scholar]
- 15.Oeckl P, Halbgebauer S, Anderl-Straub S, et al. Glial Fibrillary Acidic Protein in Serum is Increased in Alzheimer’s Disease and Correlates with Cognitive Impairment. J Alzheimers Dis 2019;67:481–488. [DOI] [PubMed] [Google Scholar]
- 16.Rajan KB, Wilson RS, Weuve J, et al. Cognitive impairment 18 years prior to clinical diagnosis of Alzheimer’s disease dementia. Neurology 2015;85:898–904. [DOI] [PMC free article] [PubMed] [Google Scholar]
- 17.Wilson RS, Bennett DA, Beckett LA, et al. Cognitive activity in older persons from a geographically defined population. J gerontol B Psychol Sci Soc Sci 1999;54:155–160. [DOI] [PubMed] [Google Scholar]
- 18.McKhann G, Drachman D, Folstein M, et al. Clinical diagnosis of Alzheimer’s disease: report of the NINCDS-ADRDA Work Group under the auspices of Department of Health and Human Services Task Force on Alzheimer’s Disease. Neurology 1984;34:939–944. [DOI] [PubMed] [Google Scholar]
- 19.Bennett DA, Wilson RS, Schneider JA, et al. Natural history of mild cognitive impairment in older persons. Neurology 2002;59:198–205. [DOI] [PubMed] [Google Scholar]
- 20.Bennett DA, Schneider JA, Aggarwal NT, et al. Decision rules guiding the clinical diagnosis of Alzheimer’s disease in two community-based cohort studies compared to standard practice in a clinic-based cohort study. Neuroepidemiology 2006;27:169–176. [DOI] [PubMed] [Google Scholar]
- 21.Aggarwal NT, Wilson RS, Bienias JL, et al. The association of magnetic resonance imaging measures with cognitive function in a biracial population sample. Arch Neurol 2010;67:475–482. [DOI] [PMC free article] [PubMed] [Google Scholar]
- 22.Rajapakse JC, Giedd JN, DeCarli C, et al. A technique for single-channel MR brain tissue segmentation: application to a pediatric sample. Magnetic Resonance Imaging 1996;14:1053–65. [DOI] [PubMed] [Google Scholar]
- 23.Lee DY, Fletcher E, Martinez O, et al. Vascular and degenerative processes differentially affect regional interhemispheric connections in normal aging, mild cognitive impairment, and Alzheimer disease. Stroke 2010;41:1791–1797. [DOI] [PMC free article] [PubMed] [Google Scholar]
- 24.Aljabar P, Heckemann RA, Hammers A, et al. Multi-atlas based segmentation of brain images: atlas selection and its effect on accuracy. Neuroimage 2009;46:726–738. [DOI] [PubMed] [Google Scholar]
- 25.Fletcher E, Carmichael O, DeCarli C. MRI non-uniformity correction through interleaved bias estimation and B-spline deformation with a template. Conference proceedings: Annual International Conference of the IEEE Engineering in Medicine and Biology Society Conference 2012;2012:106–109. [DOI] [PMC free article] [PubMed] [Google Scholar]
- 26.Das SR, Avants BB, Grossman M, Gee JC. Registration based cortical thickness measurement. Neuroimage 2009;45:867–879. [DOI] [PMC free article] [PubMed] [Google Scholar]
- 27.Fletcher E, Singh B, Harvey D, Carmichael O, Decarli C. Adaptive image segmentation for robust measurement of longitudinal brain tissue change. Conference proceedings: Annual International Conference of the IEEE Engineering in Medicine and Biology Society IEEE Engineering in Medicine and Biology Society Conference 2012;2012:5319–5322. [DOI] [PMC free article] [PubMed] [Google Scholar]
- 28.Hosmer DW, Lemeshow S, Studivant RX. Applied logistic regression New York, NY: John Wiley & Sons; 2013. [Google Scholar]
- 29.Diggle PJ, Heagerty P, Liang KY, Zeger SL. Analysis of longitudinal data Oxford, UK: Oxford University Press; 2002. [Google Scholar]
- 30.R Core Team. R: A language and environment for statistical computing R Foundation for Statistical Computing, Vienna, Austria, 2012. [Google Scholar]
- 31.Bateman RJ, Xiong C, Benzinger TL, et al. Clinical and biomarker changes in dominantly inherited Alzheimer’s disease. N Engl J Med 2012;367:795–784. [DOI] [PMC free article] [PubMed] [Google Scholar]
- 32.Mattsson N, Andreasson U, Zetterberg H, et al. Association of plasma neurofilament light with neurodegeneration in patients with Alzheimer disease. JAMA Neurol 2017;74:557–566. [DOI] [PMC free article] [PubMed] [Google Scholar]
- 33.Cairns NJ, Lee VMY, Trojanowski JQ. The cytoskeleton in neurodegenerative disease. J Pathol 2004;204:438–449. [DOI] [PMC free article] [PubMed] [Google Scholar]
- 34.Olsson B, Lautner R, Andreasson U, et al. CSF and blood biomarkers for the diagnosis of Alzheimer’s disease: A systematic review and meta-analysis. Lancet Neurol 2016;15:673–684. [DOI] [PubMed] [Google Scholar]
- 35.Shahim P, Gren M, Liman V, et al. Serum neurofilament light protein predicts clinical outcome in traumatic brain injury. Sci Rep 2016;7:36791. [DOI] [PMC free article] [PubMed] [Google Scholar]
- 36.Pase MP, Davis-Plourde K, Himali JJ, et al. Vascular risk at younger ages most strongly associates with current and future brain volume. Neurology 2018;91: e1479–e1486. [DOI] [PMC free article] [PubMed] [Google Scholar]
- 37.Swan GE, DeCarli C, Miller BL, et al. Association of midlife blood pressure to late-life cognitive decline and brain morphology. Neurology 1998;51:986–993 [DOI] [PubMed] [Google Scholar]
- 38.Weston PSJ, Poole T, Ryan NS, et al. Serum neurofilament light in familial Alzheimer disease: a marker of early neurodegeneration. Neurology 2017;89:2167–2175. [DOI] [PMC free article] [PubMed] [Google Scholar]
- 39.Vannini P, Uquillas FD, Jacobs HIL, et al. Decreased meta-memory is associated with early tauopathy in cognitively unimpaired older adults. Neuroimage Clin 2019;24:102097. [DOI] [PMC free article] [PubMed] [Google Scholar]
- 40.Filshtein TJ, Dugger BN, Jin LW, et al. Neuropathological Diagnoses of Demented Hispanic, Black, and Non-Hispanic White Decedents Seen at an Alzheimer’s Disease Center. J Alzheimers Dis 2019;68:145–158. [DOI] [PMC free article] [PubMed] [Google Scholar]
- 41.Barnes LL, Leurgans S, Aggarwal NT, et al. Mixed pathology is more likely in black than white decedents with Alzheimer dementia. Neurology 2015;85:528–534. [DOI] [PMC free article] [PubMed] [Google Scholar]
- 42.Fakhoury M. Microglia and Astrocytes in Alzheimer’s Disease: Implications for Therapy. Curr Neuropharmacol 2018;16:508–518. [DOI] [PMC free article] [PubMed] [Google Scholar]
- 43.Liu Z, Chopp M. Astrocytes, therapeutic targets for neuroprotection and neurorestoration in ischemic stroke. Prog Neurobiol 2016;144:103–120. [DOI] [PMC free article] [PubMed] [Google Scholar]
- 44.Gattringer T, Pinter D, Enzinger C, et al. Serum neurofilament light is sensitive to active cerebral vascular small vessel disease. Neurology 2017;89:2108–2114. [DOI] [PMC free article] [PubMed] [Google Scholar]
- 45.Moore EE, Hohman TJ, Badami FS, et al. Neurofilament relates to white matter microstructure in older adults. Neurobiol Aging 2018;70:233–241. [DOI] [PMC free article] [PubMed] [Google Scholar]
- 46.Dickerson BC, Bakkour A, Salat DH, et al. The Cortical Signature of Alzheimer’s Disease: Regionally Specific Cortical Thinning Relates to Symptom Severity in Very Mild to Mild AD Dementia and is Detectable in Asymptomatic Amyloid-Positive Individuals. Cerebral Cortex 2009;19:497–510. [DOI] [PMC free article] [PubMed] [Google Scholar]
- 47.Jack CR Jr, Knopman DS, Jagust WJ, et al. Hypothetical model of dynamic biomarkers of the Alzheimer’s pathological cascade. Lancet Neurol 2010;9:119–128. [DOI] [PMC free article] [PubMed] [Google Scholar]