Abstract
Background:
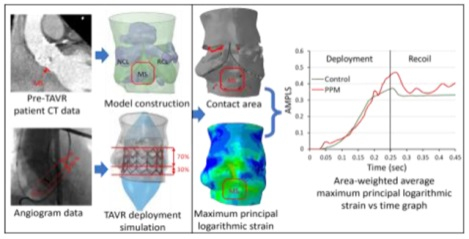
Cardiac conduction abnormality (CCA)- one of the major persistent complications associated with transcatheter aortic valve replacement (TAVR) may lead to permanent pacemaker implantation. Localized stresses exerted by the device frame on the membranous septum (MS) which lies between the aortic annulus and the bundle of His, may disturb the cardiac conduction and cause the resultant CCA. We hypothesize that the area-weighted average maximum principal logarithmic strain (AMPLS) in the MS region can predict the risk of CCA following TAVR.
Methods:
Rigorous finite element-based modeling analysis was conducted in two patients (Balloon expandable TAVR recipients) to assess post-TAVR CCA risk. Following the procedure one of the patients required permanent pacemaker (PPM) implantation while the other did not (control case). Patient-specific aortic root was modeled, MS was identified from the CT image, and the TAVR deployment was simulated. Mechanical factors in the MS region such as logarithmic strain, contact force, contact pressure, contact pressure index (CPI) and their time history during the TAVR deployment; and anatomical factors such as MS length, implantation depth, were analyzed.
Results:
Maximum AMPLS (0.47 and 0.37, respectively), contact force (0.92 N and 0.72 N, respectively), and CPI (3.99 and 2.86, respectively) in the MS region were significantly elevated in the PPM patient as compared to control patient.
Conclusion:
Elevated stresses generated by TAVR devices during deployment appear to correlate with CCA risk, with AMPLS in the MS region emerging as a strong predictor that could be used for preprocedural planning in order to minimize CCA risk.
Keywords: TAVR, TAVI, Cardiac conduction abnormality, CCA, Permanent pacemaker implantation, PPM, PPI, Aortic Stenosis, Finite element analysis, FEA
Graphical Abstract
1. Introduction
Calcific aortic stenosis (AS) is a progressive fibro-calcific remodeling and thickening of the aortic valve leaflets that diminishes the valve’s functioning, resulting in narrowed opening of the leaflets during systole, abnormal hemodynamics and increased left ventricular (LV) mechanical stresses1. Surgical aortic valve replacement (SAVR) is considered the gold-standard treatment for severe AS; however, transcatheter aortic valve replacement (TAVR) approach is becoming the standard therapy over the past decade. Since the first-in-human procedure in 20022, TAVR has showed efficacy in high surgical risk patients. Recent data provided evidence on the equivalency or superiority of TAVR performance and clinical risk compared to surgical aortic valve replacement (SAVR) in intermediate and low surgical risk patients3.
The early generation devices were associated with several clinical complications such as device embolization, paravalvular leakage (65–85% of cases)4, aortic dissection, and conduction abnormalities5,6. While the occurrence of most procedural complications has decreased with the introduction of improved newer generation TAVR devices, conduction disturbances remain higher in TAVR than in SAVR recepients7. A TAVR device requires adequate radial force to anchor against the calcific leaflet and aortic annulus, which is located in close proximity to the atrioventricular (A-V) junction through which the conduction system runs8 (Figure 1). The TAVR procedure can therefore affect the conduction pathway with different degrees of severity and in some cases may result in conduction abnormalities that at times may necessitate permanent pacemaker (PPM) implantation9–11. The average rate of PPM with newer generation transcatheter valves has been reported ranging from 2.3% to as high as 25.9%12,13. Patients who required PPM after TAVR have endured an increased risk of all-cause death and heart failure rehospitalization14.
Figure 1.
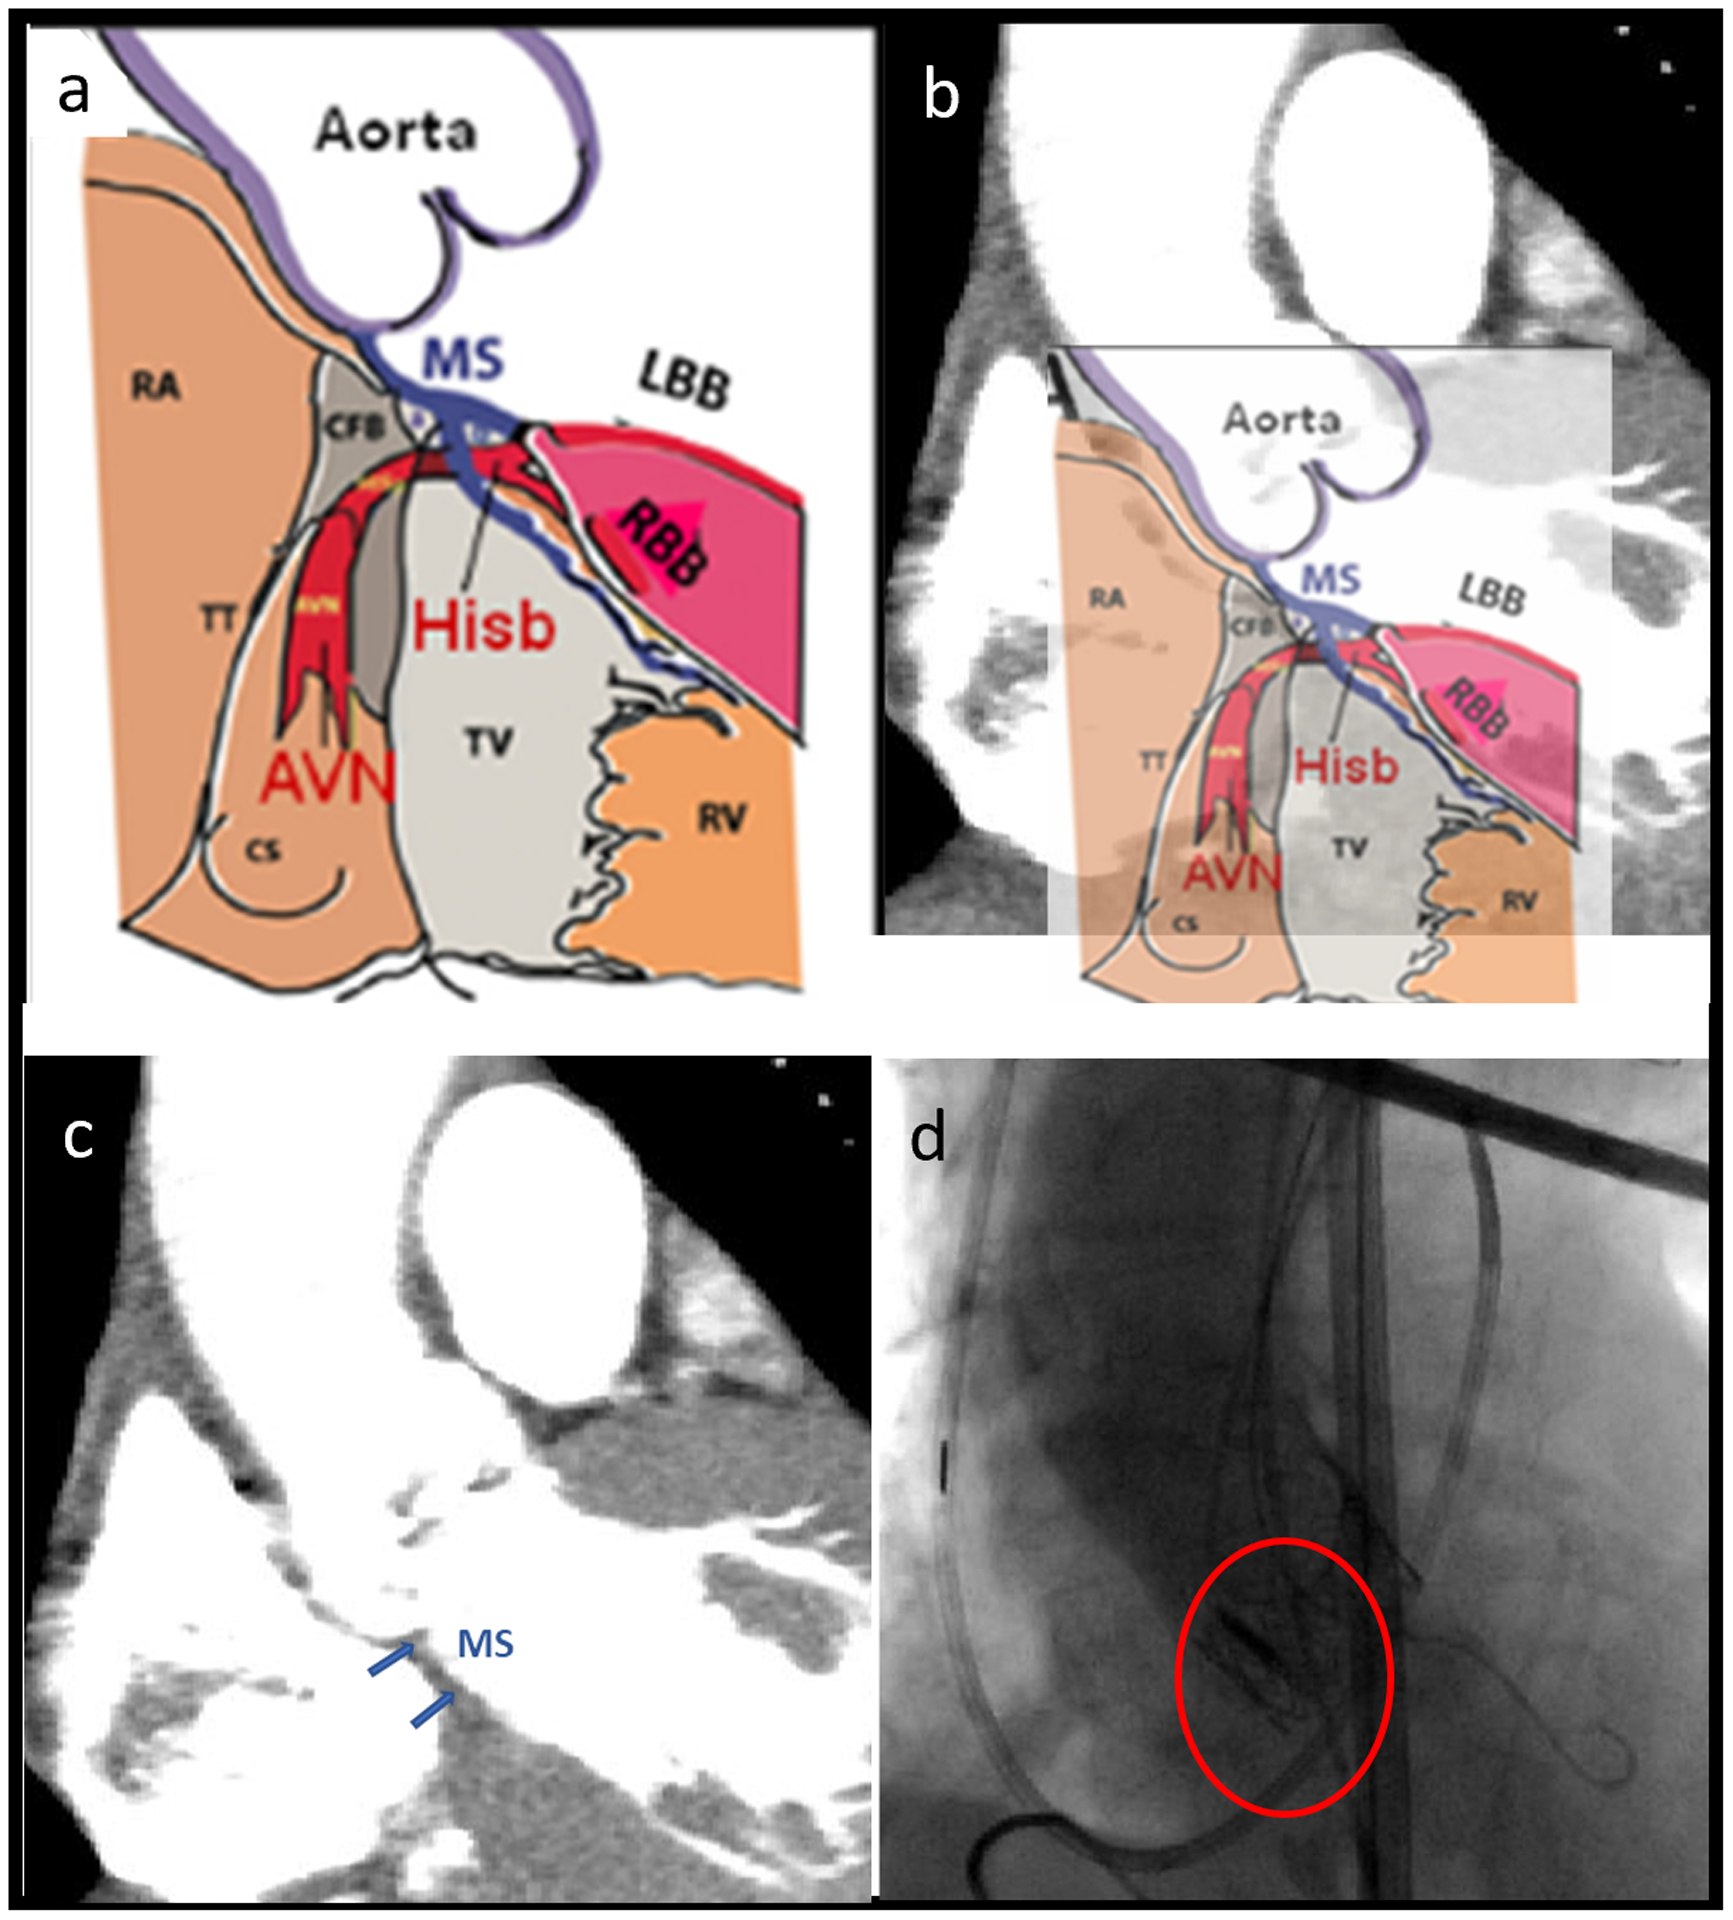
(a) Schematic of the aortic annulus, MS and Hisb40 (Used with permission from Cardiotext Publishing), (b) Schematic overlayed with the CTA image of the control patient (c) MS region identified in patient CTA image and (d) Post-TAVR angiogram shows the valve prosthesis compressing the MS region.
Clinical studies have been carried out to understand CCA occurrence after TAVR and to predict the requirement of PPM after TAVR based on the patient anatomical features and deployment techniques. Membranous septum (MS) length has been found to be inversely related to the need of PPM after TAVR15,16. Shorter MS means a shorter distance between aortic valve annulus and bundle of His, which indicates that the TAVR prosthesis has a higher chance of interacting with the conduction fibers for the patients with short MS. Deeper implantation depth has a strong correlation with the need of PPM implantation17. Several studies have combined the effect of MS length and implantation depth and demonstrated inverse relation between ΔMSID (difference between the MS length and the implantation depth) and the need of PPM implantation15,16,18,19. Valve oversizing has also been found to be associated with a higher rate of post-TAVR CCA or PPM implantation20. Previously, patient-specific numerical modeling was used to study performance and post-procedural complications of TAVR in order to aid TAVR procedural planning optimization21–23. Recently, in-silico studies have been performed to quantify different mechanical factors associated with new onset of CCA after TAVR. Rocatello et al.24 have performed an study on patients receiving self-expandable TAVR devices and demonstrated that maximum contact pressure and contact pressure index (CPI) are associated with new onset of CCA. Maximum logarithmic strain was also found to be associated with CCA after TAVR25. These computational studies focused on the mechanical factors causing CCA - after the expansion of the device. However, a clinical study has found that in 62% of the patients with CCA following TAVR the new CCA first occurred during the actual valve implantation26. This motivated us to investigate the effect of mechanical factors associated with CCA during the TAVR procedure, including its dynamic response during the deployment and recoil phases. Our hypothesis is that the localized area-weighted average maximum principal logarithmic strain (AMPLS) in the MS and its time history will be able to predict the risk of CCA after TAVR. To our knowledge, no computational study has assessed CCA risk due to balloon expandable TAVR devices. Therefore, a rigorous, patient-specific computational study is required to understand the role of different factors in developing the onset of CCA in balloon-expandable TAVR devices. In this study, we have employed advanced computational techniques to simulate balloon-expandable TAVR procedure in patient-specific anatomy and analyzed several different anatomical and mechanical factors to identify the best CCA risk assessing parameter.
2. Methods
Two patients who received SAPIEN family (Edwards Lifesciences, Irvine CA) balloon-expandable TAVR devices at Stony Brook University Hospital were selected for this study (Table 1). One of the patients experienced new onset of CCA after TAVR procedure and required PPM (PPM patient) and the other patient did not experienced CCA after TAVR (Control patient).
2.1. Anatomy reconstruction
Pre-TAVR cardiac CT scans and angiogram during the TAVR procedure of the selected patient cases were anonymized and collected under approval of the local institutional review board. ECG-gated Aquilion ONE 320-channel volume CT scanner (Toshiba, Medical Systems, Ottawara, Japan) was used to acquire CT images with non-ionic contrast media. The planar resolution was 0.755 mm × 0.755 mm, the slice thickness was 0.5 mm, and the cardiac phase was set to 75% of the R-R interval (diastole). Images of the aortic root of the patient cases were imported as DICOM and segmented into 3D surface meshes using ITK-SNAP 3.6, ITK-SNAP, USA27. Subsequently, the arterial lumen and calcium deposit facets were modeled using the technique used in our previous study28, where automatic region competition snake algorithms was employed to reconstruct ascending aorta, coronary ostia and left ventricle outflow tract (LVOT). The faceted aortic sinus was then used to create a non-uniform rational basis spline (NURBS)-based surface. The leaflets were reconstructed through surface interpolation following the manually extracted coordinates of aortic leaflet landmarks29. The generated surfaces were then meshed using ANSYS SpaceClaim and Fluent Meshing (ANSYS Inc., Canonsburg, PA)21. Later, the surface meshed aortic sinus was extruded in Abaqus CAE to incorporate the wall thickness. The calcium deposits were then placed (Figure 2d) and embedded into the soft tissue performing shrink-wrap operation which created pockets of spaces for the calcium deposits within the soft tissue. This process helps to better resemble the stenotic morphology (Figure 2e). The models (aortic wall, leaflets, and calcium deposits) were volume meshed with tetrahedral elements with a mean mesh size of 0.35 mm, using Ansys Fluent Meshing tool. Mesh was much finer than in comparable FE models30 and exceeds what is needed to establish mesh independence that we have established beforehand. Mesh continuity at the interface between sinus and leaflets and between calcifications and surrounding soft tissue was ensured and the mesh quality was maintained by enforcing mesh skewness more than 0.9 to facilitate convergence of the finite element (FE) analysis. The mesh size of the control and PPM patient annulus were approximately 1.51 million and 1.64 million, respectively. Finally, the average diameter (area-derived) of the aortic annulus was compared to the clinical CT-based measurements and found that the patient who required PPM had +6.2% and the control patient had +3.2% difference between the and FEA model and the CT derived measurements (Table 1).
Figure 2.
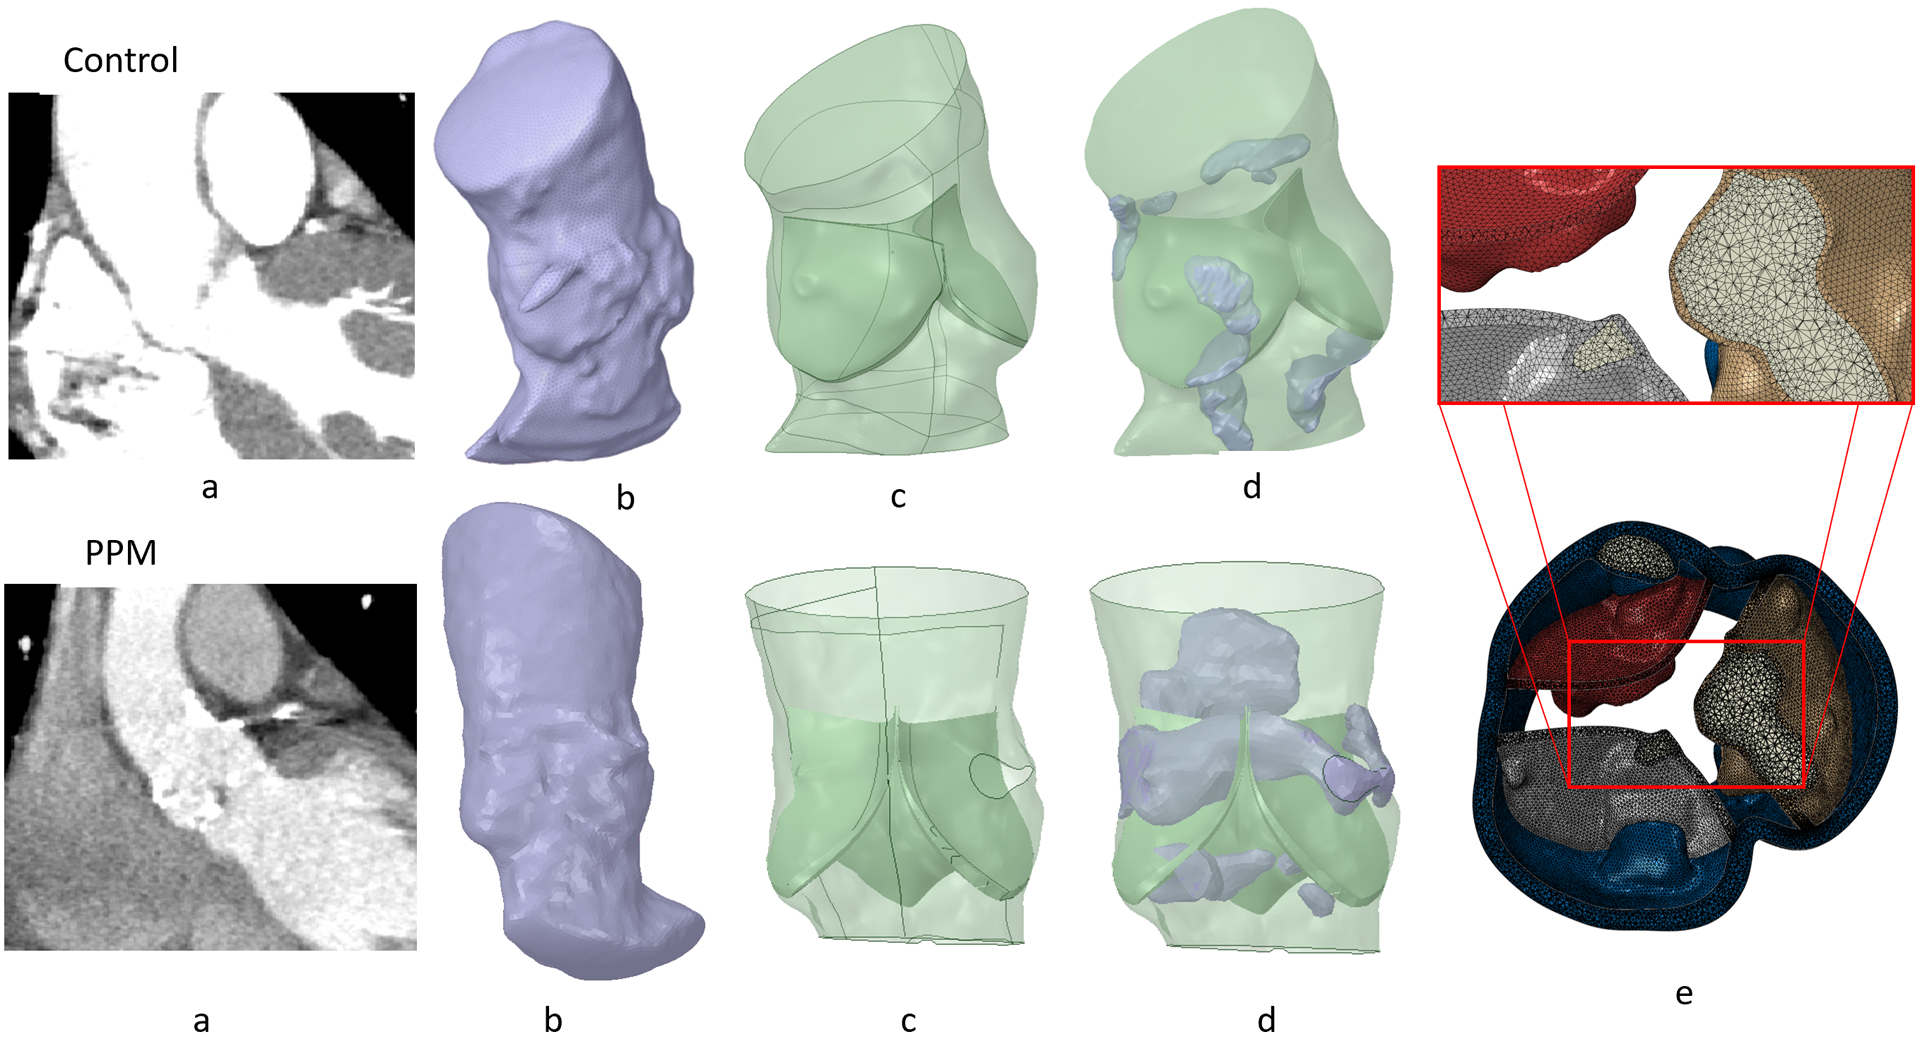
(a) CTA scan of control and PPM patients, (b) Surface STL anatomies extracted from segmentation, (c) NURBS based model processed in SpaceClaim (d) Calcium plaques were placed in the model and shrink wrapped, and (e) calcium deposit embedded inside the tissue.
2.2. MS identification and implantation depth measurement
The His bundle (HB) surfaces in between the atrioventricular (A-V) MS and the posterior crest of the muscular septum below the interleaflet triangle of non-coronary leaflet (NCL) and left-coronary leaflet (LCL)8. The lower end of the MS marks an anatomic landmark for the left ventricular exit point of the HB. Therefore, the length of the MS constitutes aortic annulus-to-HB distance.
In this study, concept presented in Mori et. al.31 was adopted to identify the MS with respect to the location of the basal plane. Initially, a virtual basal plane was created by joining together the nadirs of aortic leaflets following the technique described in Choe et. al.32.The proximal and the distal landmarks of the membranous septum were identified and the distance of the top and the bottom points of the MS from the basal plane were measured from coronal view15. Then, top and the bottom points of the MS were measured in a second plane at right angles that bisected the interleaflet triangle between the right coronary and noncoronary leaflets. Top three points created the anterior MS landmark, and the bottom three points made the posterior MS landmark. Six points measured from the CT were traced back to the 3D model with respect to the basal plane and the secondary plane. MS region was then created joining the six landmark points (Figure 3). The maximum height of the MS region of the PPM and control patients were approximately 6.7 mm and 10.4 mm. Implantation depth was measured from the post-TAVR angiogram (Figure 4) where approximately 70% of the valve height was on the aortic side and 30% was on the ventricular side of the annular plane. The implantation depths of the control patient and PPM patient were approximately measured as 4.3 mm and 5.7 mm.
Figure 3.
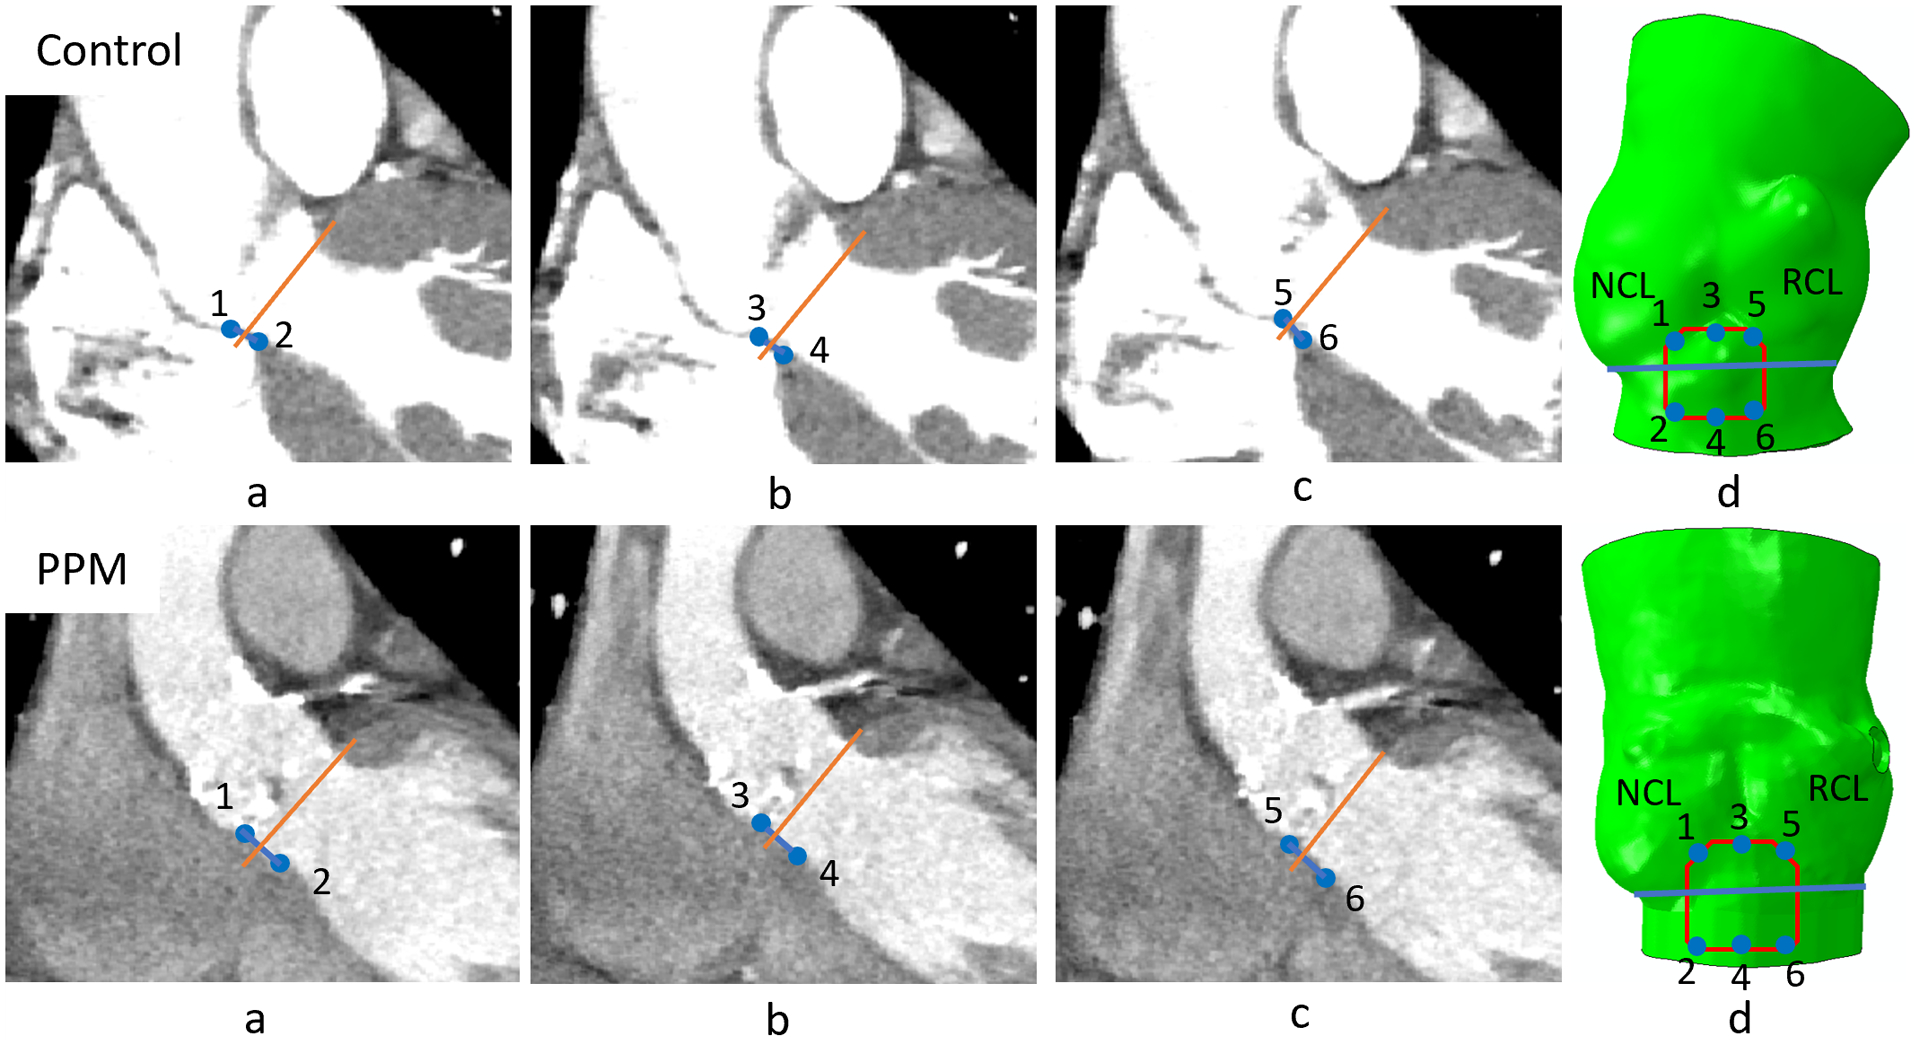
(a), (b) and (c) Edges of the MS in three different horizontal planes were marked (coronal view); (d) six points collected from the CT image were traced back to the 3D model; MS region was generated connecting the traced points. (BP= Basal plane, 1-3-5 anterior MS landmark, 2-4-6 posterior MS landmark, 1–3 is the distal and 5–6 is the proximal MS landmarks from the coronal view.)
Figure 4.
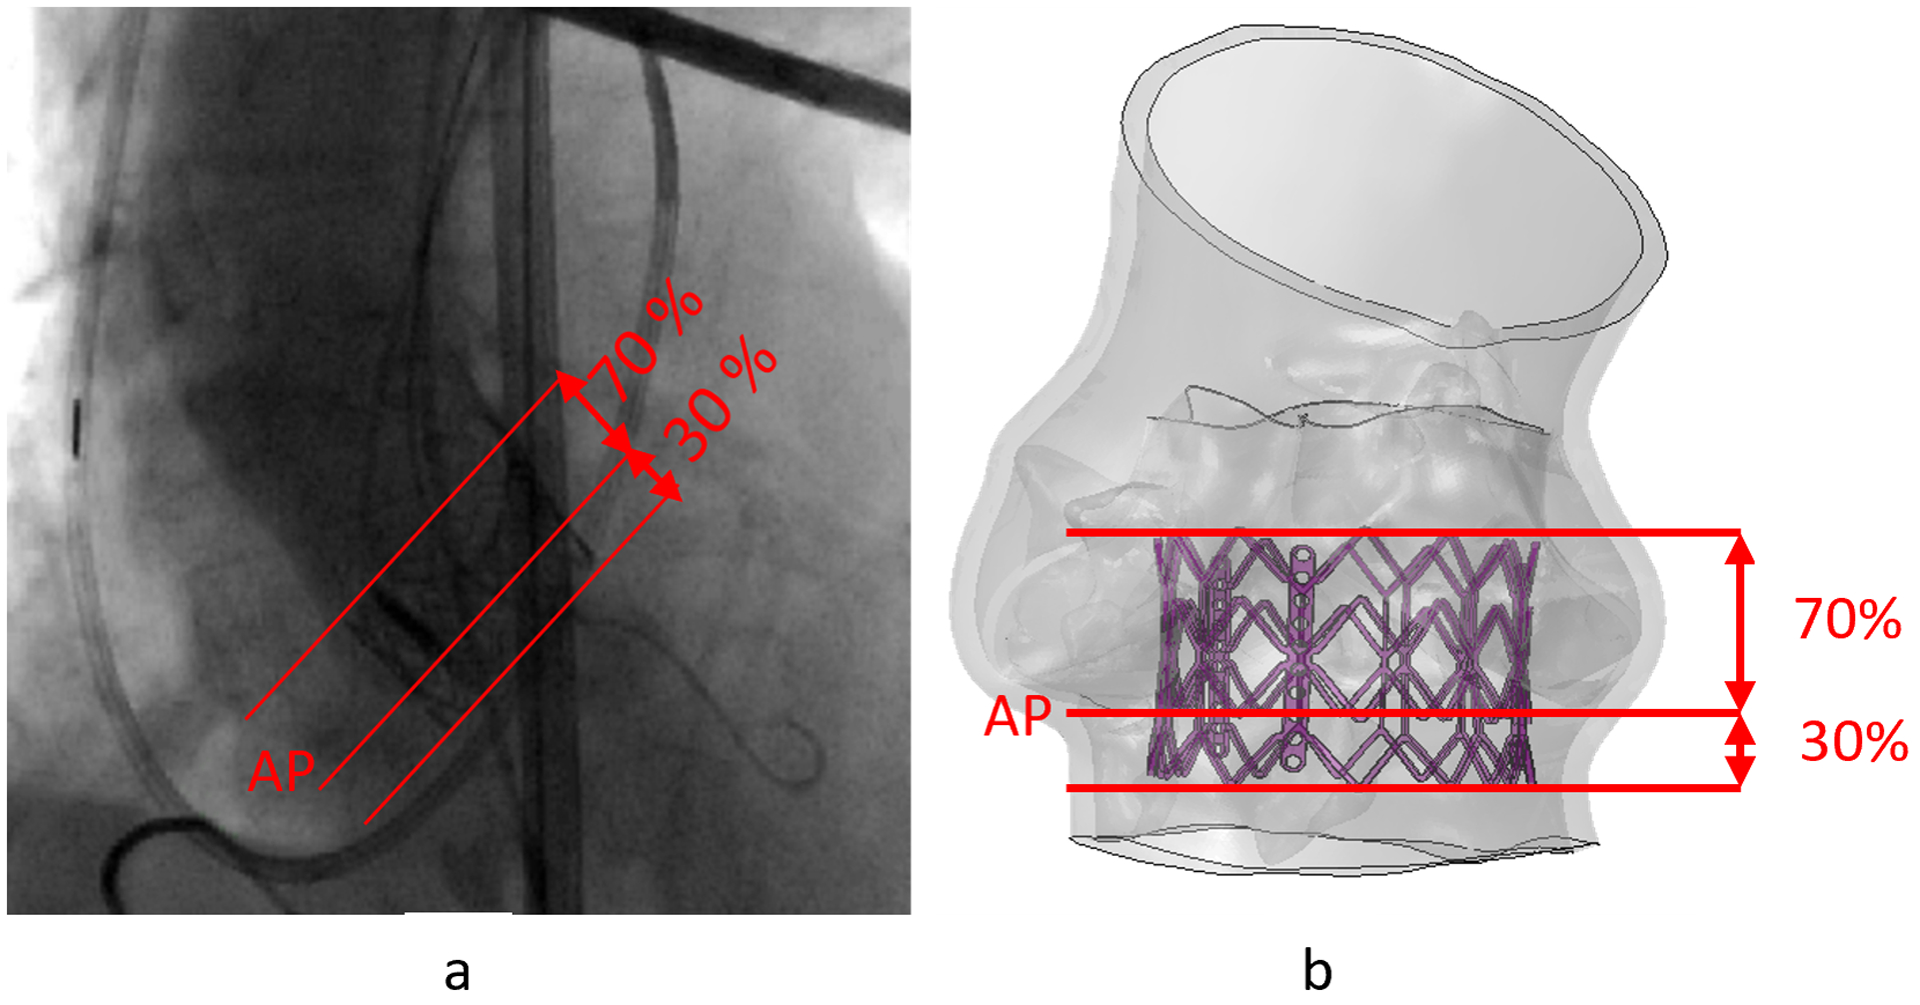
(a) Approximation of implantation depth from angiogram image, (b) Implantation depth used in the TAVR simulation for control case. (AP = Annular plane)
2.3. TAVR device crimping and balloon inflation
The SAPIEN and SAPIENXT valves were modeled and meshed using 69876 and 38214 linear hexahedral elements of type C3D8R, respectively. Abaqus Explicit 2018 (SIMULIA, Dassault Systèmes, Providence, RI) was used as the finite element analysis tool for the crimping process where radial displacement boundary conditions (BCs) to the nodes of a coaxial cylindrical sheath were adopted. Constitutive laws for the stent material were collected from the literature. Stainless steel was modeled as a bilinear elasto-plastic material (ρ = 7760 kg/m3, E = 193 GPa, σY (0.2%) = 340 MPa, σU (48%) = 670 MPa, v = 0.29)33 and used for the stents. The balloon was modeled as linear elastic with quadrilateral shell elements (ρ = 1100 kg/m3, E = 600 MPa, v = 0.45, αR = 8000)33. After the inflation, the interaction between the balloon and the stent was detached. TAV prosthetic leaflets were not included in the models since it was demonstrated34 that they have negligible impact (<1% in nodal discrepancy) on the post-deployment stent deformation. Balloon inflation was simulated following two approaches, a pressure-based inflation and a fluid-cavity-based approach which allows a more realistic volume-controlled inflation28.
2.4. TAVR deployment in patient-specific anatomies
TAVR procedure was simulated in two stages, deployment, and recoil (Figure 5). Clinical implantation depths were employed during the TAVR simulation. Additionally, similar simulations were performed adopting a higher and a lower implantation depth (50% and 10% below annular plane, respectively). Dedicated Ogden 3rd degree isotropic hyperelastic material model calibrated the material model with biaxial test measurement was used for the aortic wall, and each leaflet. Material constants used for the sinus are μ1 = −10.10, μ2 = 7.03, μ3 = 3.11, α1 = −24.18, α2 = −23.78, α3 = −25.0, D1,2,3 = 0, for the left coronary leaflet are, μ1 = −56.13, μ2 = 42.88, μ3 = 13.59, α1 = 8.65, α2 = 10.03, α3 = 6.82, D1,2,3 = 0, for the right coronary leaflet are μ1 = −24.70, μ2 = 17.83, μ3 = 6.94, α1 = 2.0, α2 = 4.0, α3 = −2.0, D1,2,3 = 0, and for the non-coronary leaflet are μ1 = −48.0, μ2 = 33.41, μ3 = 14.67, α1 = 8.65, α2 = 10.03, α3 = 6.82, D1,2,3 = 0.damping factor α = 250 were used for each leaflet and the sinus35. Homogenous linear elastic material property (E = 12.6 MPa, v = 0.3)36 was used for the calcification deposits. The top of the ascending aorta was constrained in its translational degrees of freedom (DOFs) to keep the model stationary. Frictional hard contact37 with a friction coefficient of 0.1 was used to model the interaction of the TAVR prosthesis with the native tissue and scaled penalty contact was used for the stent–balloon interaction. 1e-07 Mass scaling was employed during the deployment stage of each model, and the ratio between kinetic energy and internal energy was kept under 5%38, so that inertial forces would not have a significant effect on the model dynamic. No mass scaling was used during the recoil stage. Damping factor, α=250 was used for the aortic wall and the leaflets. After the TAVR deployment simulation, anatomical and mechanical factors such as MS length, ΔMSID, implantation depth, contact area between the valve prosthesis and the TAVR device, contact force, maximum logarithmic strain, and area-weighted average maximum principal logarithmic strain (AMPLS) in the MS were analyzed. AMPLS was calculated averaging the cumulative strain in the MS region by the surface area of the MS elements that experienced strain during the TAVR deployment simulation. CPI (percentage of MS surface area subjected to contact pressure with respect to the total surface area of the MS) was measured at the end of the recoil phase. ΔMSID was calculated by subtracting the implantation depth from the MS length.
Figure 5.
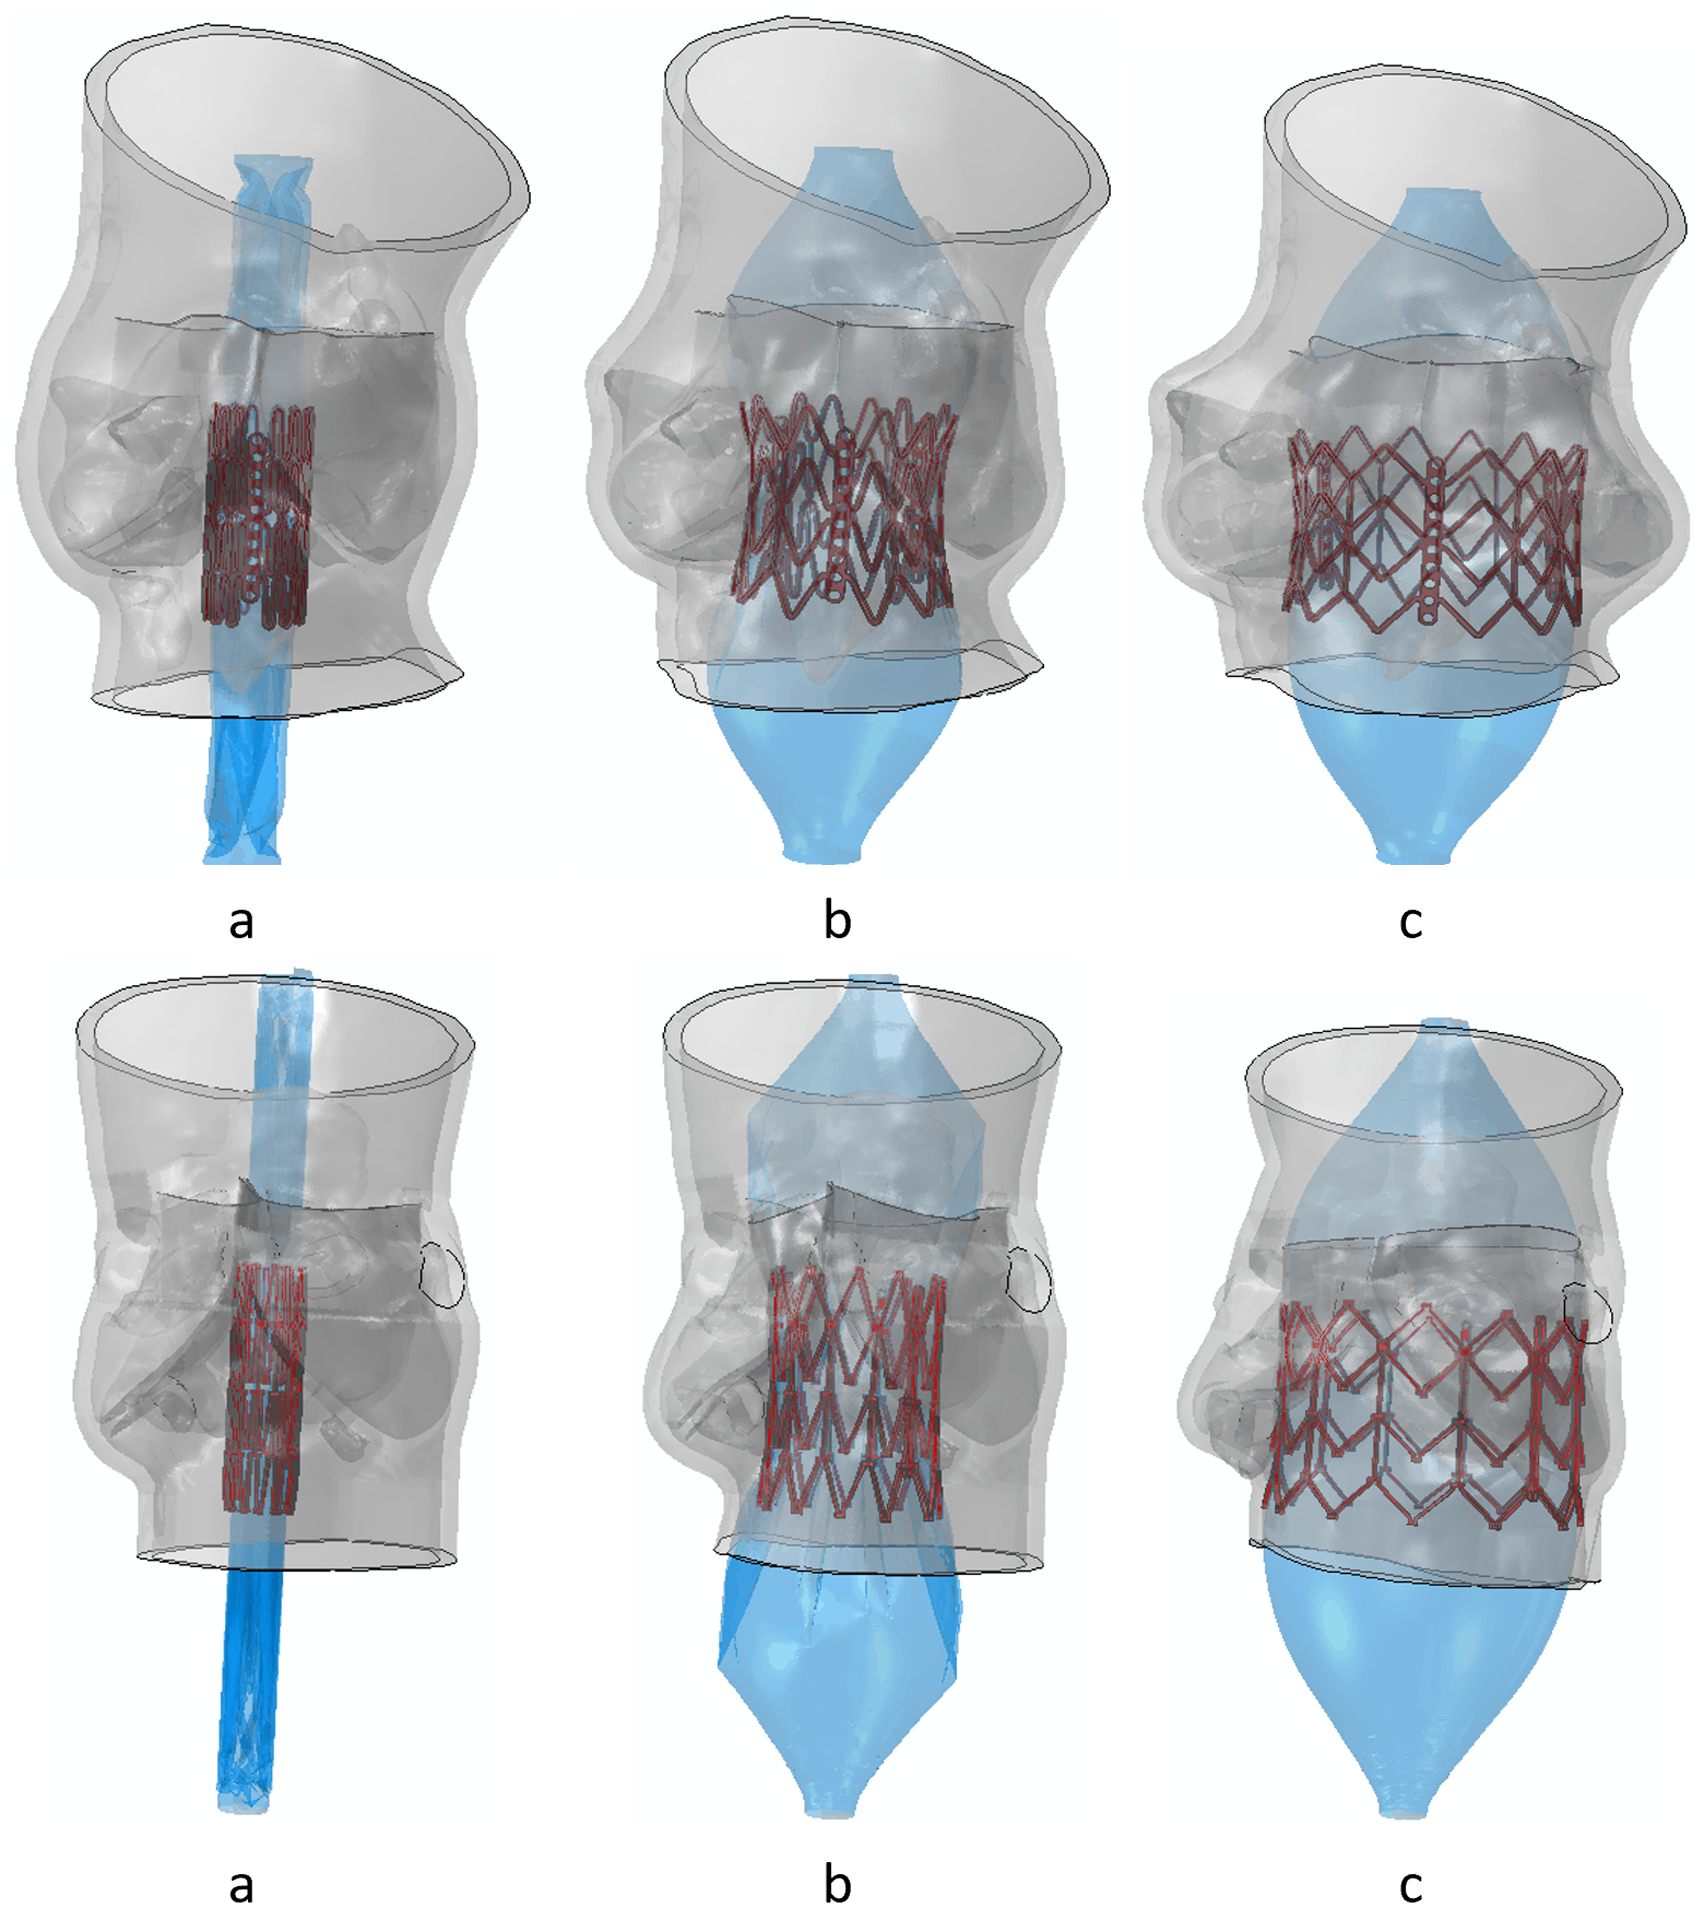
(a) Initial time step, (b) mid time step, and (c) last time step of deployment stage of the TAVR simulation. (Control patient- top and PPM patient- bottom)
3. Results
Mechanical factors such as contact force, contact pressure, strain in the MS region have been taken in consideration to assess the risk of new onset of CCA after TAVR deployment. In our study, we have considered the dynamic time history of these mechanical factors throughout the TAVR deployment- rather than the endpoint of the simulation.
3.1. Logarithmic strain
Maximum principal logarithmic strain (max. log ε) for both PPM and control patient occurred at the end of the deployment stage. AMPLS in the MS region of both patients was also analyzed (Figure 7a). The temporal peak of AMPLS for the PPM and control patients were 0.47 and 0.37 respectively which occurred in the end of deployment stage. The AMPLS for the PPM and control patients were consistent at the end of the recoil stage as well (0.39 for CCA patient and 0.33 for control patient).
Figure 7.
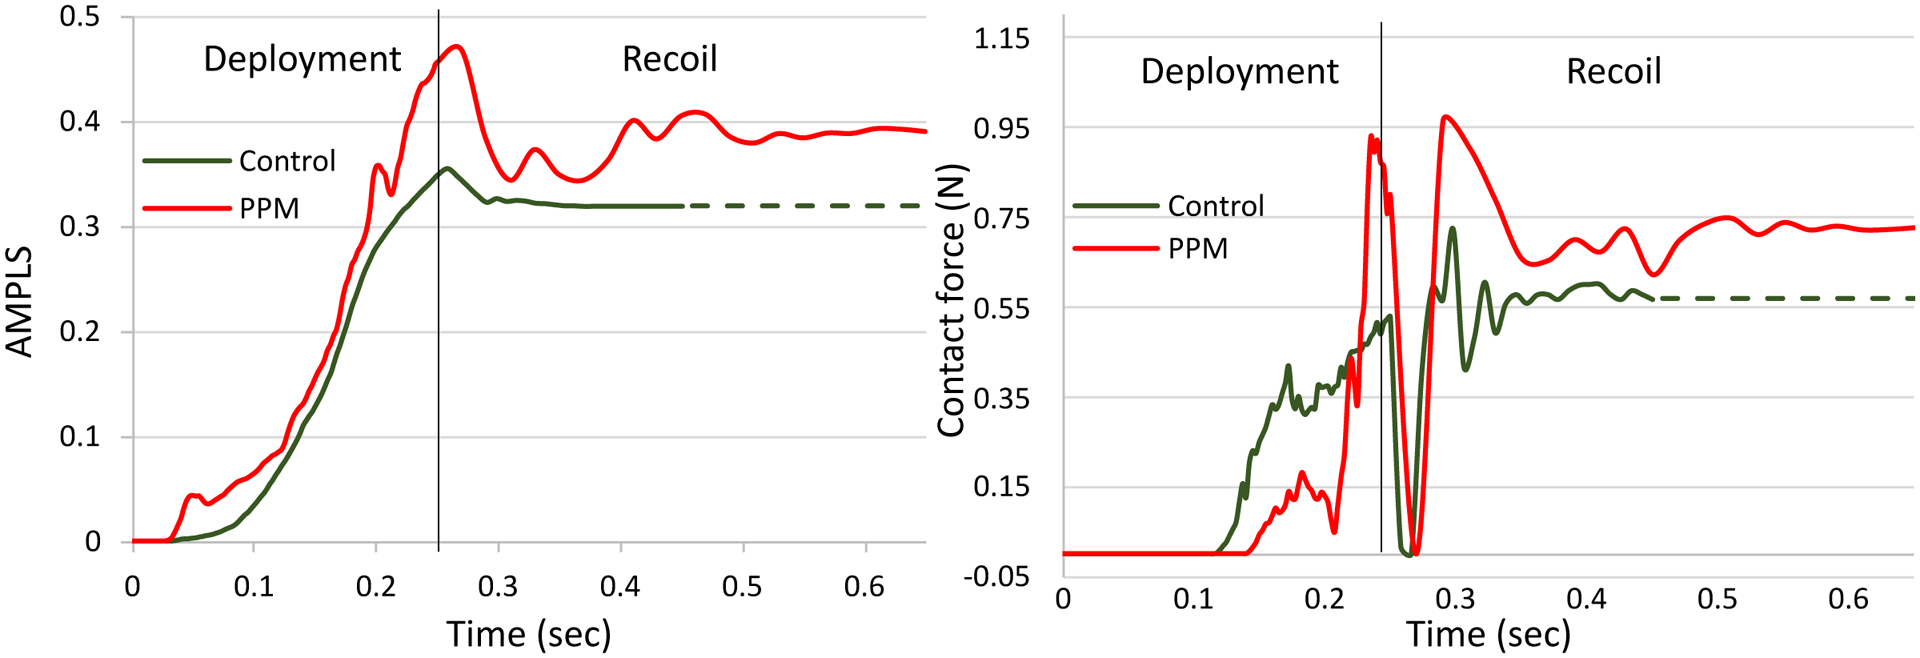
(a) Area-weighted average max. principal logarithmic strain (AMPLS) vs time and (b) Contact force vs time in the MS region of control and PPM patient cases.
3.2. Contact force and contact pressure
The control patient experienced a gradual increase of contact force in the MS region throughout the deployment stage and remained unchanged during the recoil stage. The PPM patient indicated a sudden rise of contact force between the valve prosthesis and the MS region during the deployment stage and gradual decrease during the recoil stage. For both patients, a sudden drop of contact force was observed during the early recoil stage (Figure 7b). The drop occurred due to the disengagement of the interaction between the balloon and the valve prosthesis. In actual TAVR procedure, the drop may not occur because the balloon is deflated in a relatively slower speed. The maximum contact forces occurred following the sudden drop in the recoil stage and calculated as 0.72 N and 0.92 N for the control and the PPM case, respectively. Contact pressure in the MS of the control patient was higher compared to that of the PPM patient, throughout the simulation. Maximum contact pressure for the control patient was 0.6 MPa and 0.22 MPa for the PPM patient.
3.3. Contact area and contact pressure index
Contact area between the region of interest (MS) and the TAVR prosthesis was found to be lower for the control patient compared to the PPM patient (Figure 3d). The maximum contact area for both patients were reached during the deployment stages and calculated to be 5.99 mm2 and 8.04 mm2 for control and PPM patients, respectively. CPI was found to be 2.86 for the control patient and 3.99 for the PPM patient.
3.4. Implantation depth
Implantation depths were obtained from clinical data for both patient cases. Additionally, simulations were performed at higher and lower implantation depth (50% and 90% above the annular plane, respectively) for each patient case (Figure 8) to analyze the effect of implantation depth on the above-mentioned factors. Subsequently, the AMPLS results for the higher and lower implantation depth were compared with the results obtained from the simulations for the clinical implantation depth (Figure 9). For the PPM case, the maximum contact force in the MS for 50% and 90% above annular plane implantation were 0.43 N and 0.2 N, respectively, which occurred during the recoil stage for both implantation depths. Maximum contact area for 50% and 90% above annular plane implantation were 7.86 mm2 and 11.53 mm2, respectively. For the control case, the maximum contact force in the MS for 50% and 90% above annular plane implantation were 0.8 N and 0.96 N, respectively which occurred during the deployment stage for both of the implantation depths. Maximum contact area for 50% and 90% above annular plane implantation 10.58 mm2 and 11.45 mm2, respectively.
Figure 8.
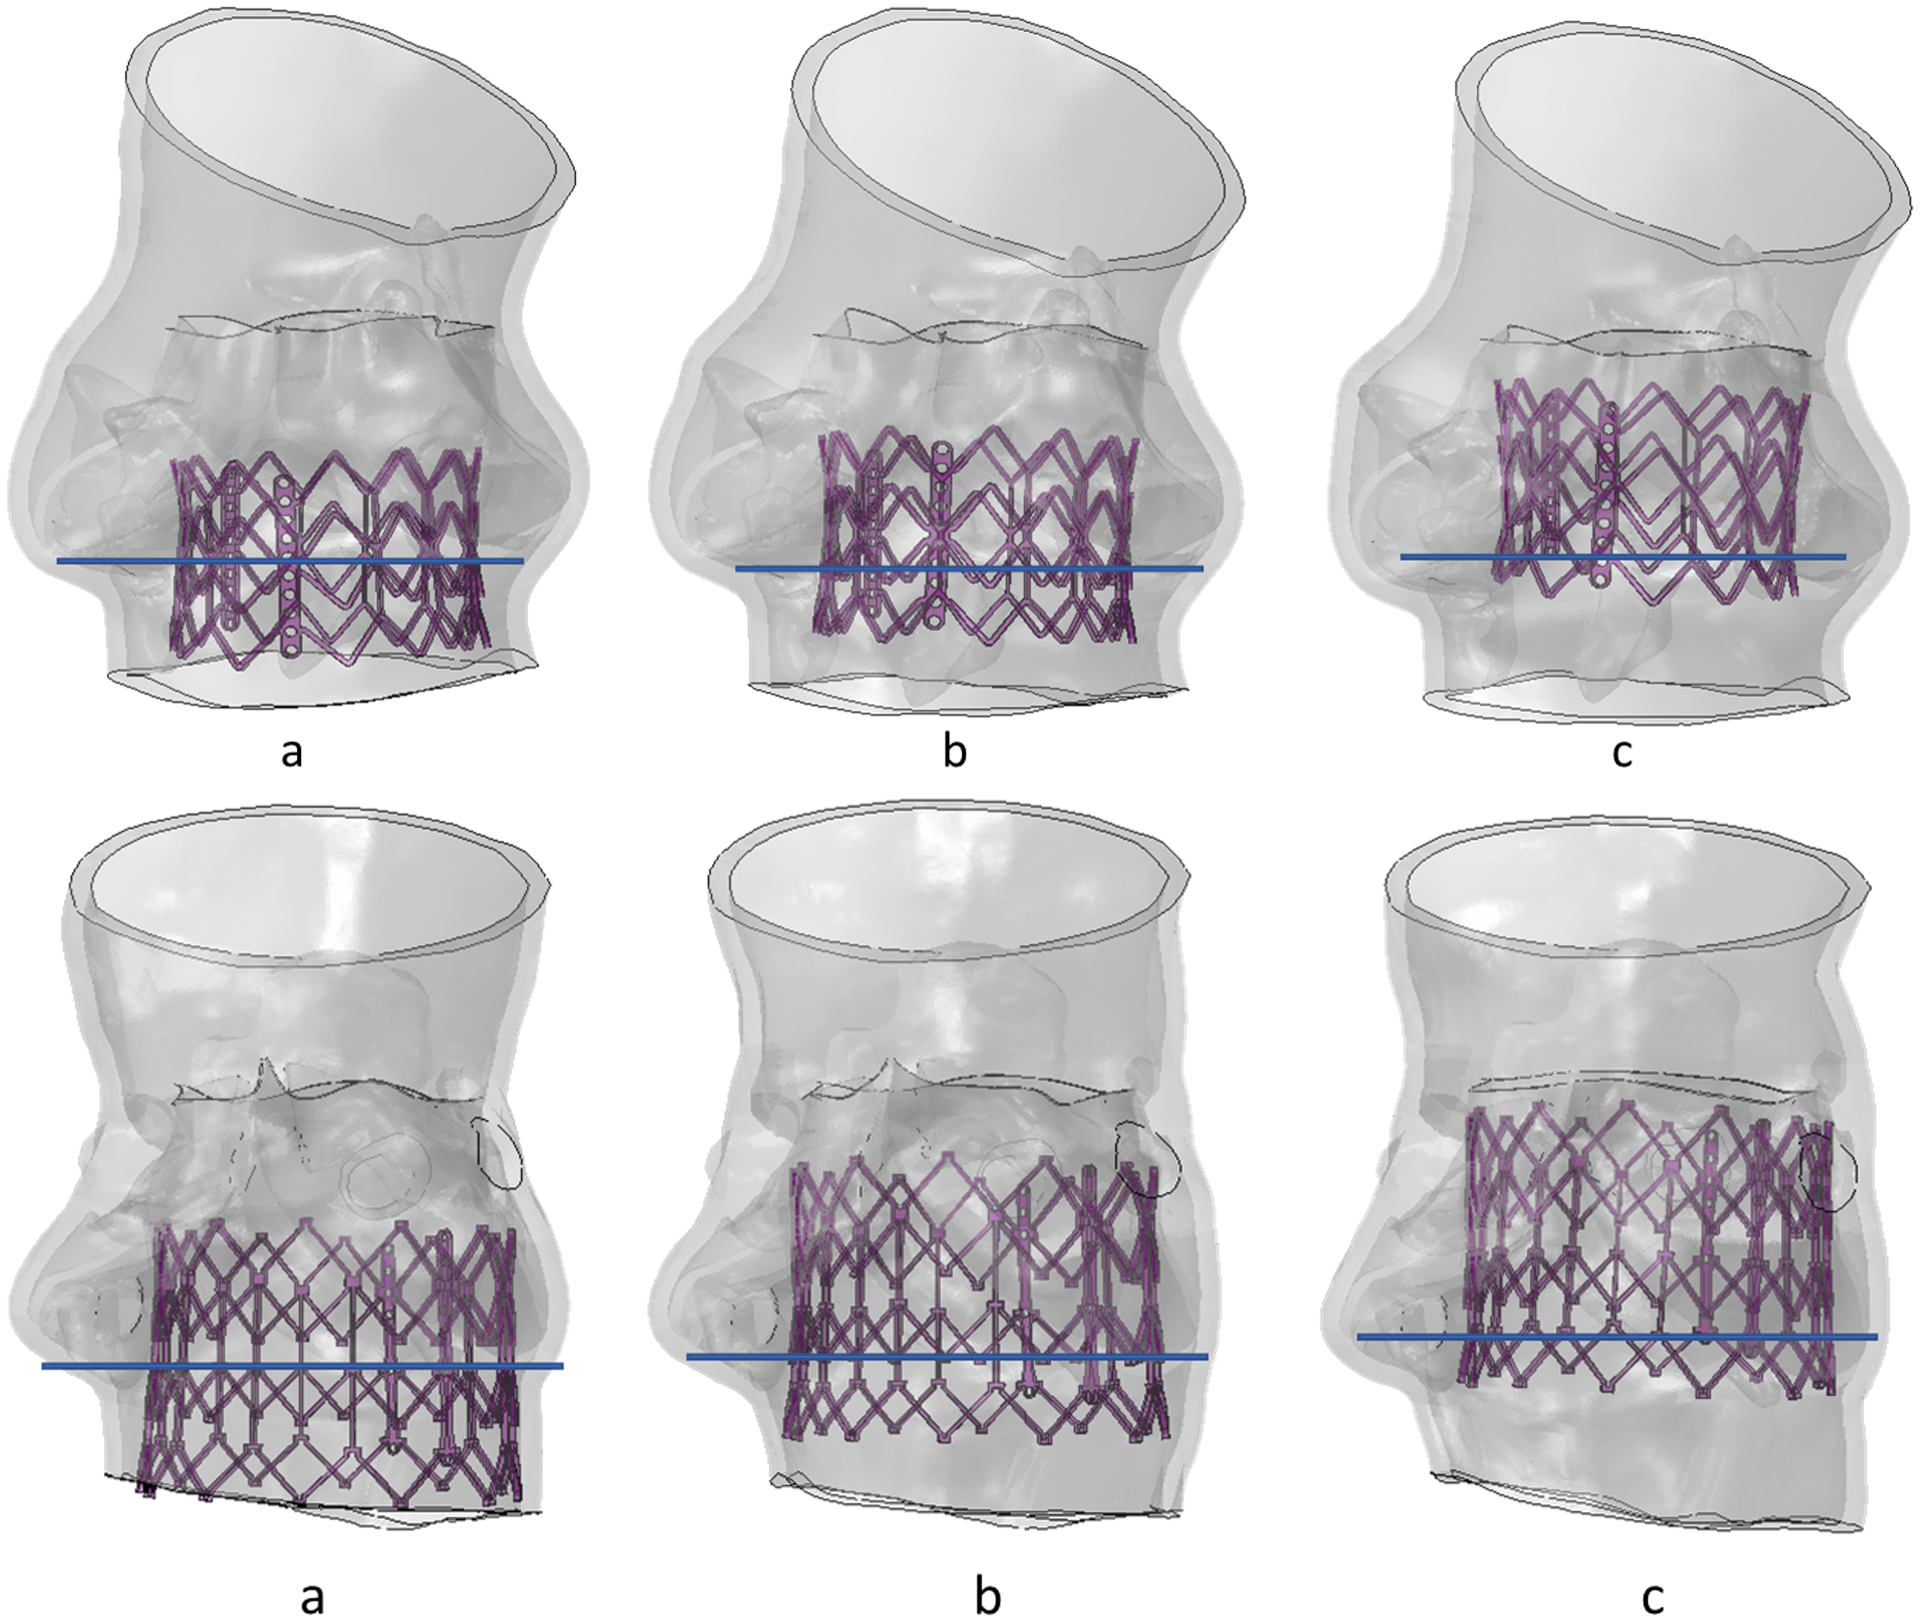
(a) 50% aortic (b) 70% aortic and (c) 90% aortic implantation depth for control (top) and PPM patient (bottom).
Figure 9.
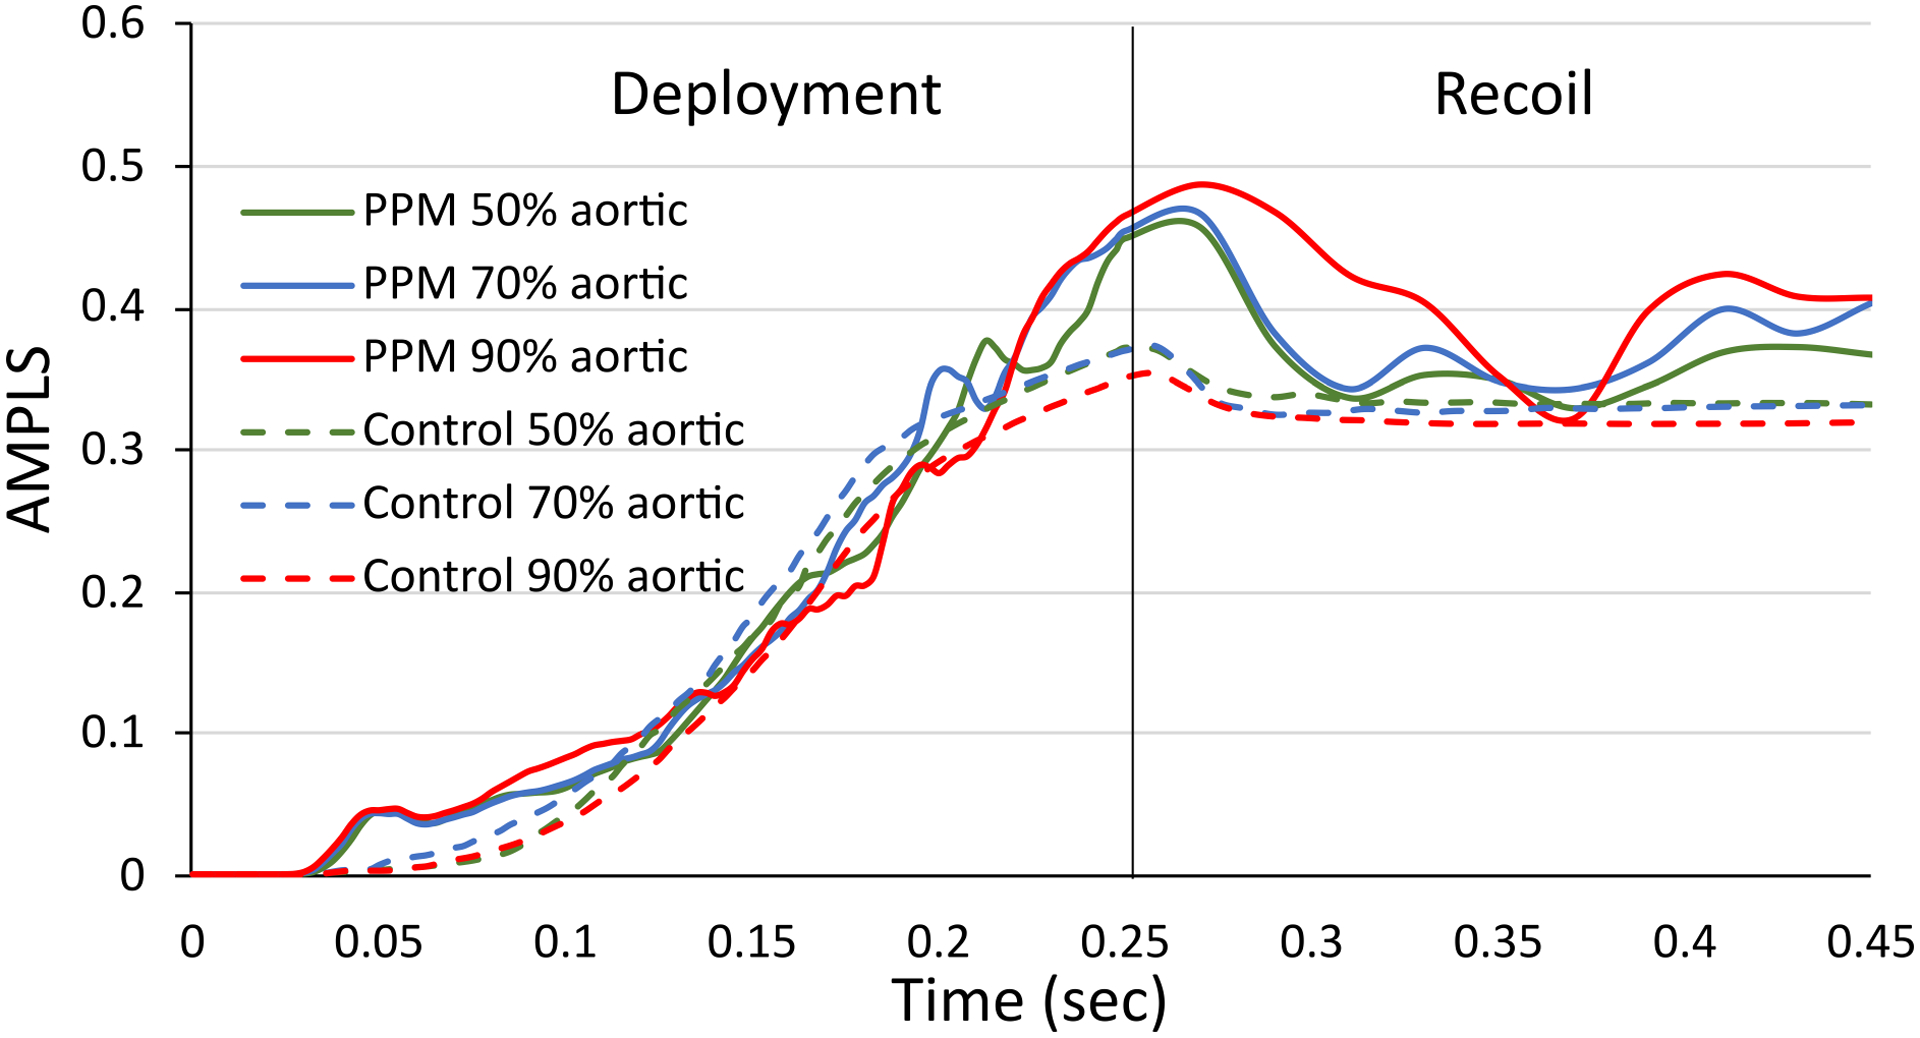
Area-weighted average max. principal logarithmic strain (AMPLS) vs time in the MS region of the (a) control patient and (b) PPM patient at three different implantation depths.
3.5. Valve oversizing, and ΔMSID
TAVR valves were oversized for both patients. The control patient had a +3.20 % CT derived valve oversizing and the PPM patient had a +13.28 % CT derived valve oversizing. ΔMSID of the control patient and the PPM patient were 2.4 and 4.7.
4. Discussion
The TAVR prosthesis is deployed in the proximity to the A-V node and may disrupt cardiac conduction through the atrioventricular conduction pathway and hence cause new conduction abnormality after a TAVR procedure. The aim of this study was to perform a rigorous, finite element-based computational analysis on several mechanical factors in the proximity of A-V node of patient-specific anatomies to assess the associated post-procedural CCA risk. Influence of the anatomical factors on the development of post-TAVR CCA was also analyzed. In this study, two patients were selected who received balloon-expandable TAVR devices. One of the patients required permanent pacemaker (PPM) after TAVR procedure and the other patient did not require PPM (control). The patients’ anatomy models were reconstructed, and MS region was identified from the CT data, and the implantation depth was measured from patient’s angiogram data. TAVR device positioning can be more precisely controlled during in-silico modeling than the actual TAVR procedure. Therefore, we have assumed that the TAVR is performed by experienced interventionalists with nearly perfect execution skills. Subsequently, FEA simulation of TAVR deployment was performed on the two reconstructed patient models. The computational technique used in this study has previously been qualitatively validated and used to study paravalvular leakage (PVL) and thrombogenicity of balloon-expandable TAVR devices21,28. Identification of MS in 3-dimension is very challenging. In this study, a concept presented in Mori et. al.31 was adopted where MS was identified with reference to the basal plane.
After the completion of the TAVR deployment simulations, contact force in the region of interest was quantified during each timestep of the TAVR procedure. The contact force in the MS region peaked during the end of the deployment stage for both the control patient case and the PPM patient cases. Recently, a study has demonstrated that contact pressure and contact pressure index are associated with new-onset of CCA after self-expandable TAVR procedure24. The PPM patient experienced a higher maximum contact force and CPI in the MS region as compared to the control patient. However, contact pressure in the MS region was higher for the control case than that of the PPM. Balloon-expandable TAV devices undergo plastic deformation during the expansion and apply radial force against the anatomy during the expansion. In contrast, self-expandable devices apply a constant radial force against the anatomy. We hypothesize that the deployment phase of the balloon-expandable device is critical to the development of the CCA, since it potentially generates the highest radial force acting on the A-V region as the anatomy adapts around the prothesis post-deployment. Additionally, due to the device shape and size differences between the self and balloon-expandable TAVR devices, the contact dynamics between the valve prosthesis and the MS may differ. Therefore, contact based parameters may not demonstrate consistent CCA risk assessment for self-expandable and balloon-expandable TAVR devices.
Bosi et. al25 have analyzed strains in the proximity to the A-V node after TAVR procedure of 14 patients who received self-expandable TAVR devices and suggested that maximum strain and spatial average of maximum strain both were able to predict CCA risk after TAVR. In this study, spatial maximum principal logarithmic strain and AMPLS in the MS region were analyzed. Higher peak value of both maximum principal logarithmic strain and AMPLS were observed for the PPM patient in accordance with Bosi et. al. The maximum and mean logarithmic strains gradually peak during the deployment phase, slightly decrease during the balloon deflation and subsequently stabilize by the end of the recoil stage. Damage in the proximity of the A-V node may already occur by the peak stresses generated during the deployment stage, as those are higher than the steady state stresses at the end or after the TAVR procedure (Fig. 8). A clinical study on the development of new onset of CCA after TAVR has demonstrated that 62% of the patients develop CCA during the TAVR procedure (from positioning of the TAVR device to retrieval of all catheters and wires)26. In our study, the temporal peak of the AMPLS and the contact force were observed during the TAVR deployment, which is aligned with the clinical observation and emphasizes the importance of analyzing the mechanical factors during the entire TAVR procedure.
Hamdan et al. have found an inverse relationship between the MS length and the risk of a high degree of AV-block and the need of PPM for patients who received self-expandable TAVR devices15. In contrast, Oestreich et al.19 analyzed the MS length of the balloon-expandable SAPIEN 3 valve recipients and reported a higher mean MS length of the patients developing left bundle branch block (LBBB) or required PPM after TAVR than that of the patients who did not. In our study, the length of MS of the control patient was smaller than that of the PPM patient, which is aligned with the findings of Oestreich et al.19 and indicates that MS length may not be a good indicator of CCA risk assessment for balloon-expandable TAVR recipients. Several studies have also indicated that high implantation depth imposes a higher risk of developing CCA after TAVR procedure17,20. Further studies have demonstrated that a combination between MS length and the implantation depth (ΔMSID) could independently predict CCA risk15,16,18. A negative ΔMSID value means that the valve prosthesis physically overlapped the conduction fibers and a positive ΔMSID means that the valve prosthesis landed away from the conduction fibers. In this study, both patient cases considered had positive ΔMSID and the PPM patient had a higher ΔMSID compared to the control patient which indicates that the ΔMSID based CCA risk assessment may not be adequate predictors, as demonstrated by the more accurate patient-specific scenario presented here. Valve oversizing has previously been reported to be associated with new-onset of CCA development after TAVR19. In our study, the patient who received PPM had a higher valve oversizing than that of the control patient (13.28% for the PPM patient and 3.60% for the control patient), in agreement with the clinical studies.
We have further studied an in-silico higher and a lower implantation depth (50% aortic and 90% aortic, respectively) and compared the results with the clinical implantation depth, to investigate the effect of implantation depth in the mechanical factors associated with CCA. For the control patient, maximum logarithmic strain, and the temporal maximum value of the AMPLS increased gradually with a higher implantation depth. For the PPM case, implantation depth had a minimal effect on maximum logarithmic strain and the temporal maximum value of the AMPLS. However, the maximum contact force in the MS region increased with the higher (50% aortic) implantation depth. This observation depicts that lower implantation depth may lower the risk of CCA after TAVR. However, local interaction between the valve prosthesis and the anatomical features such as annular shape and distribution of the calcium deposits need to be taken into consideration to assess the CCA risk and to find the optimal implantation depth on a patient-specific basis.
Studies on various animals have demonstrated a biphasic response of stretch-induced cardiac conduction velocity, where the conduction velocity increases with the increase of strain on the conduction fibers up to a certain threshold and rapidly decreases after the threshold is crossed39. Our results have also demonstrated that the PPM patient has experienced a higher AMPLS in the proximity to the conduction fibers than that of the control patient. This implies that the strain in the MS region of the PPM patient might have increased due to several anatomical and procedural factors and may have crossed the strain threshold which caused conduction abnormality after TAVR. However, the AMPLS threshold is still unknown.
In summary, this study analyzed several anatomical and mechanical factors associated with CCA after TAVR. The findings indicate that the anatomical factors play important role in increasing stresses and strains on the conduction fibers which may eventually cause CCA and require PPM after TAVR. Study on a large patient cohort may demonstrate good correlation between the anatomical factors and post-TAVR CCA. However, analysis of mechanical factors can more accurately assess post-TAVR CCA risk on a patient-specific basis. The study also elucidated the importance of analyzing the factors during the entire TAVR deployment. Among the mechanical factors, AMPLS, contact force and CPI in the MS were able to correctly assess the post-TAVR CCA risk. This strongly indicates that strain-based CCA risk assessment has benefits over contact-based analysis. Contact based CCA risk assessment is highly dependent upon anatomical size and shape of the LVOT and also prone to computational artifacts depending on the friction between the contact surfaces and the employed contact models. Moreover, contact pressure and contact force based CCA risk assessment is case specific as it cannot assess CCA risk when there is no contact between the region of interest and the valve prosthesis. On the other hand, analyzing AMPLS in the MS region has advantages such as eliminating computational artifacts and being able to predict CCA risk irrespective of the contact criteria and the anatomical variability of the patients.
The patient-specific computational framework presented in this study can potentially be used to improve TAVR pre-procedural planning strategy alongside conventional patient assessment to minimize post-TAVR CCA risk and reduce the need for PPM. Additionally, it facilitates in silico testing of new device designs at low costs, with relatively faster response times and under more realistic environment, by providing thorough quantitative analysis which is rather difficult to obtain directly from patient anatomy.
5. Limitations
Computationally expensive balloon-expandable TAVR simulations were performed in two patients-specific models to analyze the CCA risk assessment factors. Current study can assess comparative CCA risk associated with implantation parameters and TAVR valve sizing. A following study with more patients is necessary to establish a threshold of the AMPLS in the MS, to distinguish between patients who may or may not develop a new conduction abnormality after TAVR. The heart is rapid paced to minimize the heart motion during most of the TAVR procedures. The stiffness of the aortic annulus may increase due to the active contraction of the myocardium during rapid pacing of the heart. In this study, we have not accounted for the effect of rapid pacing and ventricular motion. We plan to expand our current simulations to incorporate ventricular motion and rapid pacing during the TAVR deployment, in the future.
6. Conclusions
A finite element patient-specific based computational approach is developed to thoroughly analyze the localized interaction between the TAVR prosthesis and the conduction pathway that may induce CCAs and require the need for post-deployment pacemaker implantation. Analyzing time history of the area-weighted average of the maximum principal logarithmic strain exerted by the TAVR prosthesis in the MS region during the device deployment was found to be a strong predictor for assessing CCA risk associated with TAVR devices. Such patient specific studies could further be used for preprocedural planning in order to minimize the CCA risk.
Figure 6.
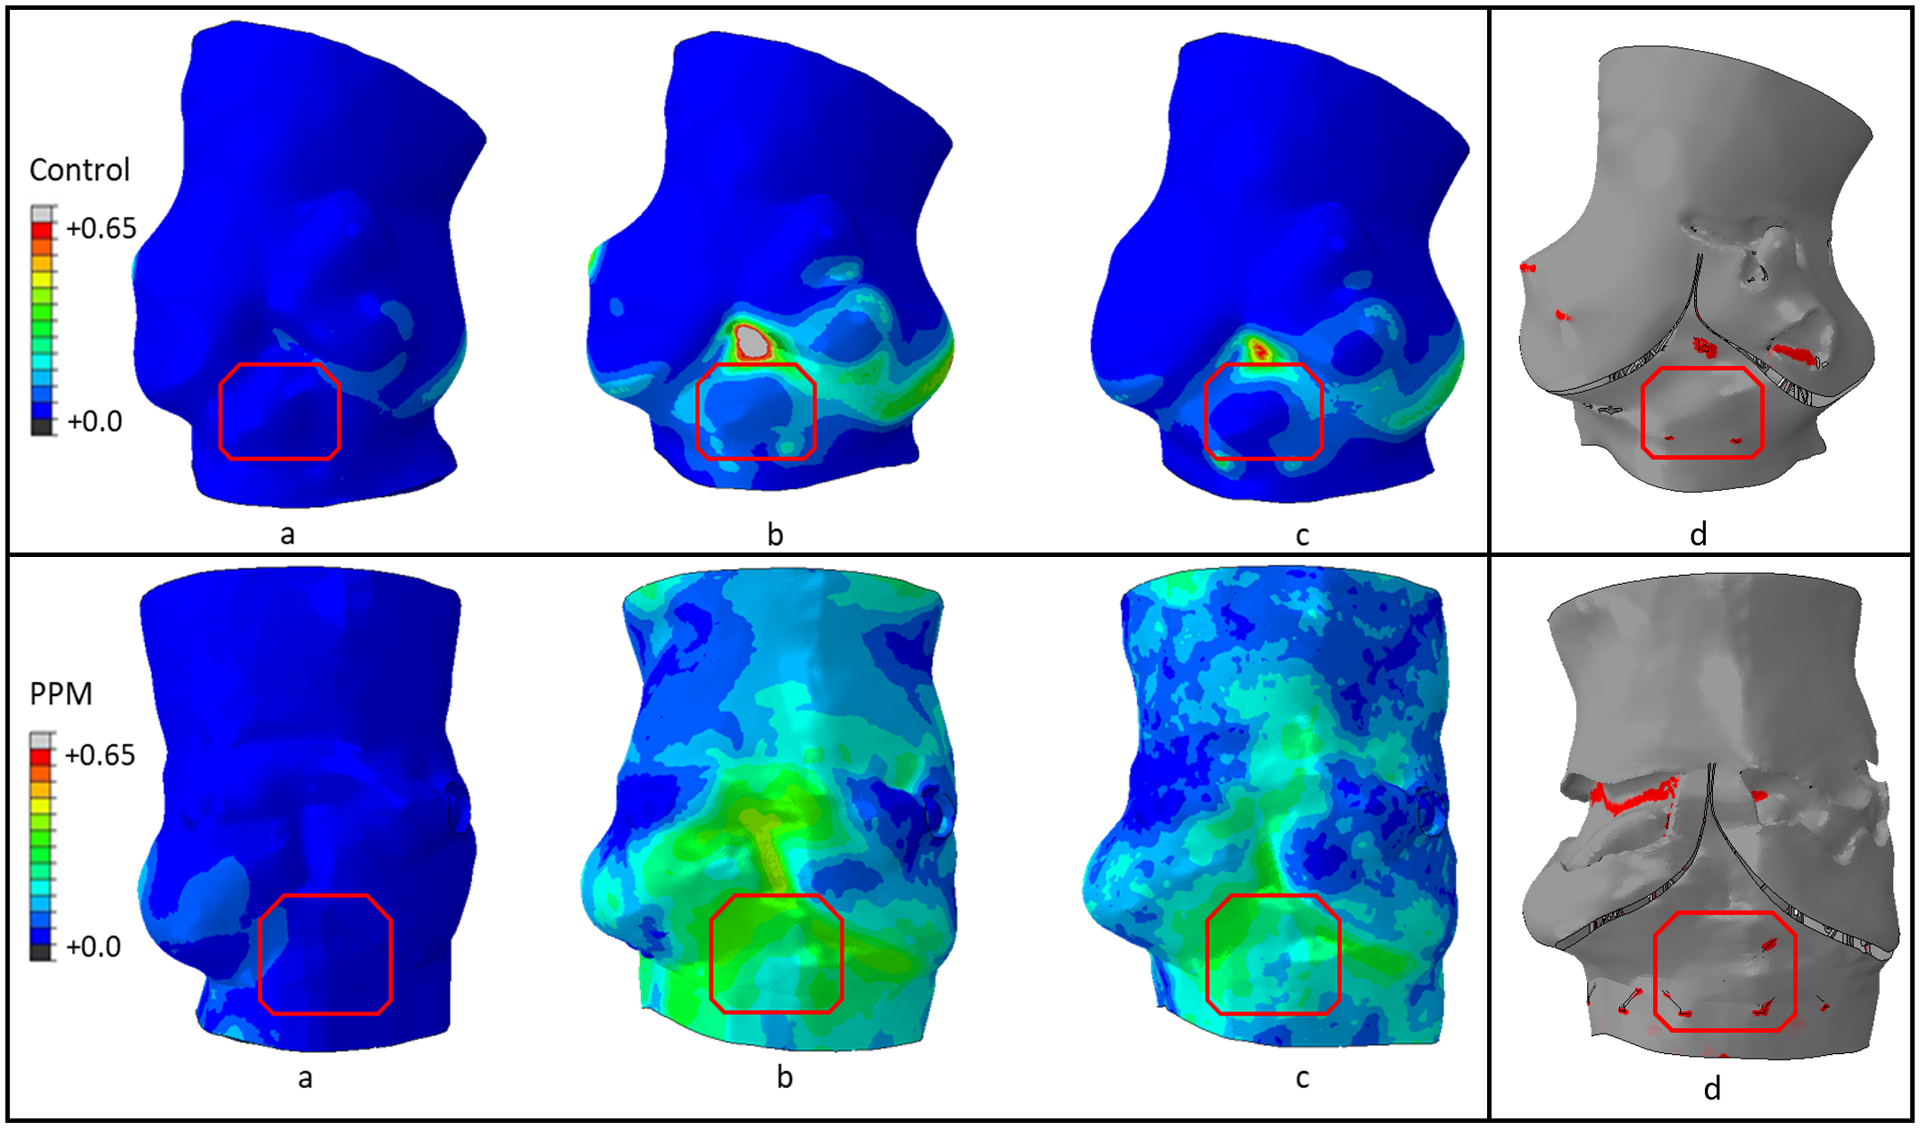
Maximum principal logarithmic strain contour (a) Half-way through deployment, (b) End of deployment stage and (c) End of recoil stage, and (d) Contact area (red) distribution between the stent and the inner surface of the aortic root at the end of deployment stage of the control patient (top) and the PPM patient (bottom).
Table 1.
Patient information and reconstructed model size verification
| Patient (TAVR model) | Control (Edwards Sapien) | PPM (Edwards Sapien XT) |
|---|---|---|
| Annulus average diameter (CTA- derived) | 22.2 mm | 25.6 mm |
| Annulus average diameter (Model) | 22.9 mm | 27.2 mm |
| Model vs CT annulus diameter (%) | +3.2 | +6.2 |
| TAVR size | 23 mm | 29 mm |
| CT derived valve oversizing (%) | +3.6 | +13.28 |
| PPM | No | Yes |
Source of Funding:
This project was supported by NIH-NIBIB U01EB026414 (DB).
Key terms
- AS
Aortic stenosis
- TAVR
Transcatheter aortic valve replacement
- CCA
Cardiac conduction abnormality
- MS
Membranous septum
- PPM
Permanent pacemaker
- A-V
Atrioventricular
- HB
His bundle
- AMPLS
Area-weighted average maximum principal logarithmic strain
- CTA
Computed tomography angiography
- LCL
Left coronary leaflet
- NCL
Non coronary leaflet
- CPI
Contact pressure index (the percentage of the MS surface area subjected to contact pressure)
Footnotes
Conflict of interest
Author Brandon Kovarovic is a consultant of Polynova Cardiovascular Inc. Authors Danny Bluestein and Marvin J. Slepian have equity interest in Polynova Cardiovascular Inc. The other authors declare that they have no conflicts of interest.
References
- 1.Kanwar A, Thaden JJ, Nkomo VT: Management of Patients With Aortic Valve Stenosis. Mayo Clin Proc 93 (4): 488–508, 2018. doi: 10.1016/j.mayocp.2018.01.020. [DOI] [PubMed] [Google Scholar]
- 2.Cribier A, Eltchaninoff H, Bash A, et al. : Percutaneous transcatheter implantation of an aortic valve prosthesis for calcific aortic stenosis: first human case description. Circulation 106 (24): 3006–8, 2002. doi: 10.1161/01.cir.0000047200.36165.b8. [DOI] [PubMed] [Google Scholar]
- 3.Leon MB, Smith CR, Mack MJ, et al. : Transcatheter or Surgical Aortic-Valve Replacement in Intermediate-Risk Patients. N Engl J Med 374 (17): 1609–20, 2016. doi: 10.1056/NEJMoa1514616. [DOI] [PubMed] [Google Scholar]
- 4.Azadani AN, Jaussaud N, Matthews PB, et al. : Energy loss due to paravalvular leak with transcatheter aortic valve implantation. Ann Thorac Surg 88 (6): 1857–63, 2009. doi: 10.1016/j.athoracsur.2009.08.025. [DOI] [PubMed] [Google Scholar]
- 5.Barbanti M, Yang TH, Rodes Cabau J, et al. : Anatomical and procedural features associated with aortic root rupture during balloon-expandable transcatheter aortic valve replacement. Circulation 128 (3): 244–53, 2013. doi: 10.1161/CIRCULATIONAHA.113.002947. [DOI] [PubMed] [Google Scholar]
- 6.Van Mieghem NM, Nuis RJ, Piazza N, et al. : Vascular complications with transcatheter aortic valve implantation using the 18 Fr Medtronic CoreValve System: the Rotterdam experience. EuroIntervention 5 (6): 673–9, 2010. doi: 10.4244/eijv5i6a111. [DOI] [PubMed] [Google Scholar]
- 7.Kanjanauthai S, Bhasin K, Pirelli L, Kliger CAJUCR: Conduction abnormalities after transcatheter aortic valve replacement. 13 (1), 2019. [Google Scholar]
- 8.Piazza N, de Jaegere P, Schultz C, Becker AE, Serruys PW, Anderson RH: Anatomy of the aortic valvar complex and its implications for transcatheter implantation of the aortic valve. Circulation: Cardiovascular Interventions 1 (1): 74–81, 2008. [DOI] [PubMed] [Google Scholar]
- 9.Bleiziffer S, Ruge H, Horer J, et al. : Predictors for new-onset complete heart block after transcatheter aortic valve implantation. JACC Cardiovasc Interv 3 (5): 524–30, 2010. doi: 10.1016/j.jcin.2010.01.017. [DOI] [PubMed] [Google Scholar]
- 10.Piazza N, Onuma Y, Jesserun E, et al. : Early and persistent intraventricular conduction abnormalities and requirements for pacemaking after percutaneous replacement of the aortic valve. JACC Cardiovasc Interv 1 (3): 310–6, 2008. doi: 10.1016/j.jcin.2008.04.007. [DOI] [PubMed] [Google Scholar]
- 11.van der Boon RM, Nuis RJ, Van Mieghem NM, et al. : New conduction abnormalities after TAVI--frequency and causes. Nat Rev Cardiol 9 (8): 454–63, 2012. doi: 10.1038/nrcardio.2012.58. [DOI] [PubMed] [Google Scholar]
- 12.Reardon MJ, Van Mieghem NM, Popma JJ, et al. : Surgical or Transcatheter Aortic-Valve Replacement in Intermediate-Risk Patients. N Engl J Med 376 (14): 1321–1331, 2017. doi: 10.1056/NEJMoa1700456. [DOI] [PubMed] [Google Scholar]
- 13.Toggweiler S, Nissen H, Mogensen B, et al. : Very low pacemaker rate following ACURATE neo transcatheter heart valve implantation. EuroIntervention 13 (11): 1274–1281, 2017. [DOI] [PubMed] [Google Scholar]
- 14.Faroux L, Chen S, Muntane-Carol G, et al. : Clinical impact of conduction disturbances in transcatheter aortic valve replacement recipients: a systematic review and meta-analysis. Eur Heart J 41 (29): 2771–2781, 2020. doi: 10.1093/eurheartj/ehz924. [DOI] [PubMed] [Google Scholar]
- 15.Hamdan A, Guetta V, Klempfner R, et al. : Inverse Relationship Between Membranous Septal Length and the Risk of Atrioventricular Block in Patients Undergoing Transcatheter Aortic Valve Implantation. 8 (9): 1218–1228, 2015. [DOI] [PubMed] [Google Scholar]
- 16.Tretter JT, Mori S, Anderson RH, et al. : Anatomical predictors of conduction damage after transcatheter implantation of the aortic valve. Open heart 6 (1): e000972, 2019. [DOI] [PMC free article] [PubMed] [Google Scholar]
- 17.Mauri V, Reimann A, Stern D, et al. : Predictors of permanent pacemaker implantation after transcatheter aortic valve replacement with the SAPIEN 3. 9 (21): 2200–2209, 2016. [DOI] [PubMed] [Google Scholar]
- 18.Maeno Y, Abramowitz Y, Kawamori H, et al. : A highly predictive risk model for pacemaker implantation after TAVR. JACC: Cardiovascular Imaging 10 (10 Part A): 1139–1147, 2017. [DOI] [PubMed] [Google Scholar]
- 19.Oestreich BA, Mbai M, Gurevich S, et al. : Computed tomography (CT) assessment of the membranous septal anatomy prior to transcatheter aortic valve replacement (TAVR) with the balloon-expandable SAPIEN 3 valve. Cardiovascular Revascularization Medicine 19 (5): 626–631, 2018. [DOI] [PubMed] [Google Scholar]
- 20.Husser O, Pellegrini C, Kessler T, et al. : Predictors of permanent pacemaker implantations and new-onset conduction abnormalities with the SAPIEN 3 balloon-expandable transcatheter heart valve. 9 (3): 244–254, 2016. [DOI] [PubMed] [Google Scholar]
- 21.Bianchi M, Marom G, Ghosh RP, et al. : Patient-specific simulation of transcatheter aortic valve replacement: impact of deployment options on paravalvular leakage. Biomechanics and modeling in mechanobiology 18 (2): 435–451, 2019. [DOI] [PMC free article] [PubMed] [Google Scholar]
- 22.Ghosh RP, Marom G, Bianchi M, et al. : Numerical evaluation of transcatheter aortic valve performance during heart beating and its post-deployment fluid–structure interaction analysis. 19 (5): 1725–1740, 2020. [DOI] [PMC free article] [PubMed] [Google Scholar]
- 23.Mao W, Wang Q, Kodali S, Sun WJJobe: Numerical parametric study of paravalvular leak following a transcatheter aortic valve deployment into a patient-specific aortic root. 140 (10): 101007, 2018. [DOI] [PMC free article] [PubMed] [Google Scholar]
- 24.Rocatello G, El Faquir N, De Santis G, et al. : Patient-specific computer simulation to elucidate the role of contact pressure in the development of new conduction abnormalities after catheter-based implantation of a self-expanding aortic valve. Circulation: Cardiovascular Interventions 11 (2): e005344, 2018. [DOI] [PubMed] [Google Scholar]
- 25.Bosi GM, Capelli C, Cheang MH, et al. : A validated computational framework to predict outcomes in TAVI. Scientific reports 10 (1): 1–11, 2020. [DOI] [PMC free article] [PubMed] [Google Scholar]
- 26.Nuis RJ, Van Mieghem NM, Schultz CJ, et al. : Timing and potential mechanisms of new conduction abnormalities during the implantation of the Medtronic CoreValve System in patients with aortic stenosis. Eur Heart J 32 (16): 2067–74, 2011. doi: 10.1093/eurheartj/ehr110. [DOI] [PubMed] [Google Scholar]
- 27.Yushkevich PA, Piven J, Hazlett HC, et al. : User-guided 3D active contour segmentation of anatomical structures: significantly improved efficiency and reliability. 31 (3): 1116–1128, 2006. [DOI] [PubMed] [Google Scholar]
- 28.Bianchi M, Marom G, Ghosh RP, et al. : Effect of Balloon‐Expandable Transcatheter Aortic Valve Replacement Positioning: A Patient‐Specific Numerical Model. Artificial organs 40 (12): E292–E304, 2016. [DOI] [PMC free article] [PubMed] [Google Scholar]
- 29.Morganti S, Conti M, Aiello M, et al. : Simulation of transcatheter aortic valve implantation through patient-specific finite element analysis: two clinical cases. Journal of biomechanics 47 (11): 2547–2555, 2014. [DOI] [PubMed] [Google Scholar]
- 30.Finotello A, Morganti S, Auricchio FJMe, physics: Finite element analysis of TAVI: Impact of native aortic root computational modeling strategies on simulation outcomes. 47: 2–12, 2017. [DOI] [PubMed] [Google Scholar]
- 31.Mori S, Tretter JT, Toba T, et al. : Relationship between the membranous septum and the virtual basal ring of the aortic root in candidates for transcatheter implantation of the aortic valve. 31 (4): 525–534, 2018. [DOI] [PubMed] [Google Scholar]
- 32.Choe J, Koo HJ, Kang J-W, Kim JB, Kang HJ, Yang DHJSR: Aortic annulus sizing in bicuspid and tricuspid aortic valves using CT in patients with surgical aortic valve replacement. 11 (1): 1–12, 2021. [DOI] [PMC free article] [PubMed] [Google Scholar]
- 33.Tzamtzis S, Viquerat J, Yap J, Mullen MJ, Burriesci G: Numerical analysis of the radial force produced by the Medtronic-CoreValve and Edwards-SAPIEN after transcatheter aortic valve implantation (TAVI). Med Eng Phys 35 (1): 125–30, 2013. doi: 10.1016/j.medengphy.2012.04.009. [DOI] [PubMed] [Google Scholar]
- 34.Bailey J, Curzen N, Bressloff NW: Assessing the impact of including leaflets in the simulation of TAVI deployment into a patient-specific aortic root. Computer methods in biomechanics and biomedical engineering 19 (7): 733–744, 2016. [DOI] [PubMed] [Google Scholar]
- 35.Martin C, Sun W: Biomechanical characterization of aortic valve tissue in humans and common animal models. Journal of biomedical materials research Part A 100 (6): 1591–1599, 2012. [DOI] [PMC free article] [PubMed] [Google Scholar]
- 36.Wang Q, Kodali S, Primiano C, Sun W: Simulations of transcatheter aortic valve implantation: implications for aortic root rupture. Biomechanics and modeling in mechanobiology 14 (1): 29–38, 2015. [DOI] [PMC free article] [PubMed] [Google Scholar]
- 37.Mummert J, Sirois E, Sun W: Quantification of biomechanical interaction of transcatheter aortic valve stent deployed in porcine and ovine hearts. Annals of biomedical engineering 41 (3): 577–586, 2013. [DOI] [PMC free article] [PubMed] [Google Scholar]
- 38.Chung W, Cho J, Belytschko T: On the dynamic effects of explicit FEM in sheet metal forming analysis. Engineering Computations, 1998. [Google Scholar]
- 39.McNary T, Sohn K, Taccardi B, Sachse FJPib, biology m: Experimental and computational studies of strain–conduction velocity relationships in cardiac tissue. 97 (2–3): 383–400, 2008. [DOI] [PubMed] [Google Scholar]
- 40.Ho SY, Ernst S: Anatomy for cardiac electrophysiologists: a practical handbook, Cardiotext publishing, 2012. [Google Scholar]


