

Abstract
This study uses the differential evolution optimization algorithm to adjust the coefficient of Arrhenius-shape correlation for calculating hydrogen (H2) solubility in alcohol-based media. The pre-exponential and exponential parts of this correlation are the functions of pressure and absolute temperature, respectively. Since this model has been validated using seventeen alcohol/hydrogen binary mixtures, it is the most generalized correlation in this regard. The proposed Arrhenius-shape correlation predicts 285 laboratory solubility measurements with the absolute average relative deviation (AARD%) of 3.28% and regression coefficient (R2) of 0.99589. The accuracy of the developed model has also been compared with two empirical correlations and three equations of state suggested in the literature. The Arrhenius-shape model has 15% and 50% smaller AARD than the most accurate empirical correlation and equation of state, respectively. Simulation findings demonstrate that all alcohol/hydrogen mixtures thermodynamically behave based on Henry’s law. Hydrogen solubility in alcohols increases by increasing either pressure or temperature. 1-octanol has the maximum ability to absorb the H2 molecules.
Subject terms: Chemical engineering, Chemistry
Introduction
In recent decades, concerns about energy security have been raised due to the depletion of hydrocarbon reserves1 and the dramatically increasing demand for energy2,3 and fossil-based fuels4–6. Furthermore, the environmental problems associated with fossil fuel consumption7, such as gas emissions8, climate change9, and global warming10 have highlighted this concern further. In this regard, renewable and clean energy like hydrogen11 and ethanol12 fuels, solar irradiation13,14, and biomass15,16 have gained significant interest in reducing the dependency on fossil-derived fuels and their related environmental problems17,18.
Meanwhile, the construction of large-scale biorefineries still encounters enormous challenges, such as cellulose conversion efficiency and economic justification17. Furthermore, the bio-based feedstocks’ low heating value, high viscosity, and chemical instability should be resolved19. The presence of molecules with oxygen-containing groups such as alcohols, carboxylic acid, and aldehydes is responsible for these limitations20. Therefore, the hydrotreating/hydrodeoxygenation unit is included to remove oxygen from these oxygenated compounds21. In this catalytic unit, the bio-based feedstocks are processed under hydrogen pressure (7–20 MPa) at a high temperature (573.15–723.15 K)20,22.
Estimating the hydrogen solubility in oxygenated materials using a valid thermodynamic model is a prerequisite for feasible study, designing, optimizing, and controlling the hydrotreating/hydrodeoxygenation process20. Accurate measuring or reliable estimating of the hydrogen solubility in the considered liquid media has a central role in the appropriate design of hydro-processing units22,23.
Furthermore, hydrogen solubility in liquid media is a fundamental thermodynamic characteristic in investigating separation24 and conversion25 efficiency. For instance, methanol/hydrogen phase equilibria are required to calculate H2 losses by co absorption from syngas24. Alcohol/hydrogen and hydrogen-enriched blends may be a replacement for fossil fuel in spark-ignition engines26. Hydrogen production from the alcohol-based reforming27, including methanol28 and ethyl alcohol29, is also affected by the hydrogen solubility behavior. Moreover, the hydrogen production using the photocatalytic30, hydrogen-liquid-hydride slurry31, and aqueous and anhydrous methanol32 reactors is also controlled by H2/liquid phase behavior. Reliable knowledge about hydrogen solubility in bio-based alcohols (ethanol and glycerol) is necessary for hydrogen production using dehydrogenation reactions33,34. Aldehydes conversion into alcohols also occurs under the hydrogen pressure as a gaseous stream35.
Some researchers have experimentally measured H2 solubility in different alcohols, including methanol24,36,37, ethanol36, 1,2-ethanediol38, 1-propanol36, 2-propanol39, 2-methoxy ethanol38, allyl alcohol40, 1-butanol36, 2-butanol38, isobutanol38, 2-ethoxyethanol38, furfuryl alcohol22, 1-pentanol38, 1-hexanol38, 2-butoxyethanol38, 1-octanol31, and 2-ethyl hexanol-l38. These experimental researches have been comprehensively analyzed in the succeeding parts of the article (see “Experimental measurement of alcohol/hydrogen binary mixtures” section). Moreover, several thermodynamic22,39,40, empirical41, and intelligent42 paradigms have been developed for estimating the hydrogen solubility/storage in different liquid or solid media. The literature only employed some well-known equations of states, i.e., the PC-SAFT (perturbed-chain statistically associating fluid theory), PR (Peng-Robinson), and SRK (Soave–Redlich–Kwong) to estimate hydrogen dissolution in some limited alcoholic media, i.e., 2-propanol/hydrogen39, furfuryl alcohol/hydrogen22, and allyl alcohol/hydrogen40. The thermodynamic-based scenarios often need high computational efforts, are valid for specific alcohol/hydrogen media, and sometimes provide a relatively high uncertainty level20. On the other hand, the available empirical correlations in the literature are only valid for calculating hydrogen solubility in primary alcohols with up to four carbon atoms41. Although the empirical correlations are fast enough, they suffer from the generalization ability and provide relatively high errors41. The available intelligent approaches are specifically usable for estimating hydrogen solubility in furfural alcohol23 and primary alcohols with a maximum of four carbon atoms41. Therefore, developing a straightforward, simple, and computationally efficient model for estimating hydrogen solubility in a wide range of alcoholics seems inevitable.
The literature provides no general approach for accurately predicting hydrogen solubility in alcoholic compounds. Therefore, the current study proposes an Arrhenius-shape correlation to calculate H2 solubility in seventeen alcoholic solvents. This correlation is assembled in the simplest form, only has three parameters, and solely needs pressure and temperature to provide the hydrogen dissolution value in alcohols. Furthermore, this Arrhenius-shape model is more generalized than the empirical correlations and equations of state suggested in the literature, and it also outperforms them by more than 50% and 15%, respectively.
Methods
Different types of mathematical scenarios43,44, such as predictive approach45–48, empirical/semi-empirical49,50, wavelet transform3,51, fuzzy model52, support vector machines53, artificial neural network54–57, dynamic modeling58, and numerical simulation59–62 have been extracted from historical data of considered problems. This study develops a three-parameter Arrhenius-shape correlation to estimate the hydrogen dissolution in various alcohols. The unknown coefficient of this correlation adjusts using the differential evolution (DE) optimization algorithm. Therefore, this section concisely reviews the mathematical formulations of the Arrhenius correlation and DE optimization algorithm. After that, the gathered experimental data for hydrogen dissolution in alcohols are presented and analyzed. Finally, some statistical indices for monitoring the prediction uncertainty of the Arrhenius-shape correlation have been introduced.
Arrhenius correlation
It is obvious that a pure gas solubility in a pure liquid (like hydrogen solubility in pure alcohol) is only a function of pressure and temperature39. This study employs the Arrhenius-shape correlation to relate the hydrogen solubility in alcohols to the pressure and temperature63. Equation (1) presents a general form of the Arrhenius correlation63.
| 1 |
In this equation, shows the dependent variable, is the pre-exponential term, represents activation energy, T designates the absolute temperature, and R stands for the gas constant.
The trial-and-error process confirms that the most accurate predictions for hydrogen solubility in alcoholic media are obtained when the pre-exponential and exponential parts are functions of pressure and temperature, respectively. Indeed, the pre-exponential term linearly relates to the pressure, and the exponential part is solely temperature-dependent.
Differential evolution algorithm
The considered Arrhenius-shape correlation has three coefficients that are needed to be adjusted using an efficient optimization scenario (see “Development phase” section). The DE categorizes as a population-based algorithm for locating the global optimization condition64. Four central stages are followed in the DE algorithm for finding the global optima, i.e., generating initial population, mutation, crossover, and selection64. Equation (2) defines as a general form of an optimization problem64.
| 2 |
where is an objective function, indicates the decision vector with n design variables, and shows equality and inequality constraints. The LB and UB subscripts are lower-bound and upper-bound of the feasible domain.
The optimization process by the DE algorithm begins with the generation of an initial population with specific numbers of random vectors (i.e., NP) in the feasible domain. Then, mutant vectors () are generated for all randomly generated vectors in the initial population (or previous generation) using Eq. (3).
| 3 |
here, G shows the number of generations or optimization iterations (G = 0 indicates the initial population). Furthermore, R1, R2, and R3 are randomly selected integers ranging from one to NP. Finally, is a positive value between zero and two that controls the effect of - on the mutant vector.
The crossover scenario is then employed to enhance the diversity of the trial vector () by mixing the original () and mutant () vectors based on Eq. (4).
| 4 |
here, the crossover (i.e., the value between zero and one) shows by . is the jth member of a randomly produced vector with values in the range of [0 1]. is a random integer value between one and dimension of the decision vector.
Finally, the fourth stage compares the objective function values obtained by the original () and trial vector () vectors and decides which one should attend at the next generation (Eq. 5).
| 5 |
This process is performed on all decision vectors in all generations. The optimization continues until the maximum number of iterations is reached.
In summary, the differential evolution algorithm needs OF (objective function), g (constraints), feasible region, NP (numbers of initial population), (numbers of iteration), (mutation constant), and (crossover factor) to do its duty.
The objective function of the current study is the deviation between experimental hydrogen solubility data and their associated predictions by the Arrhenius-shape correlation. The DE algorithm adjusts the unknown coefficients of the proposed model by minimizing this objective function.
Experimental measurement of alcohol/hydrogen binary mixtures
This study checks a broad range of alcohol/hydrogen binary mixtures to approve the generalization feature of the developed Arrhenius-shape correlation. To do so, a databank of laboratory measurements for hydrogen solubility in seventeen alcohols (i.e., methanol, ethanol, 1,2-ethanediol, 1-propanol, 2-propanol, 2-methoxy ethanol, allyl alcohol, 1-butanol, 2-butanol, isobutanol, 2-ethoxyethanol, furfuryl alcohol, 1-pentanol, 1-hexanol, 2-butoxyethanol, 1-octanol, and 2-ethyl hexanol-l) has been collected from eight different references22,24,31,36–40.
Table 1 reports the ranges of equilibrium conditions (pressure and temperature) and hydrogen solubility data reported in the literature22,24,31,36–40. This table also presents the sources of experimental data and the number of measurements for each alcohol/hydrogen binary mixture. Cumulatively, 285 laboratory measurements for hydrogen solubility in seventeen alcoholic solvents have been gathered. This experimental databank is used to adjust the unknown coefficient of the Arrhenius-shape correlation and compare its performance with the available equations of state and empirical correlations.
Table 1.
Summary of laboratory-measured phase equilibria of alcohol/hydrogen mixtures.
| H2 (2) + | Pressure range (MPa) | Temperature range (K) | Solubility range (mole fraction) | Number of data |
|---|---|---|---|---|
| Methanol24,36,37 | 0.0404–43.150 | 248.41–476.60 | 0.00004–0.06130 | 57 |
| Ethanol36 | 3.7000–9.0300 | 299.90–476.50 | 0.01320–0.07040 | 18 |
| 1,2-Ethanediol38 | 2.5300–8.9700 | 298.15–373.15 | 0.00100–0.00539 | 12 |
| 1-Propanol36 | 3.6400–10.190 | 299.90–513.60 | 0.01110–0.10520 | 25 |
| 2-Propanol39 | 5.3000–12.470 | 323.40–476.10 | 0.01390–0.06370 | 11 |
| 2-Methoxy ethanol38 | 2.7250–10.100 | 298.15–373.15 | 0.00490–0.02117 | 10 |
| Allyl alcohol40 | 4.4000–15.250 | 341.50–473.00 | 0.01430–0.06160 | 21 |
| 1-Butanol36 | 3.9100–8.8200 | 295.30–524.90 | 0.01370–0.10640 | 11 |
| 2-Butanol38 | 1.9450–9.9650 | 298.15–373.15 | 0.00750–0.04190 | 10 |
| Isobutanol38 | 2.6150–9.7200 | 298.15–373.15 | 0.00740–0.03540 | 7 |
| 2-Ethoxyethanol38 | 2.3900–10.820 | 298.15–373.15 | 0.00524–0.03260 | 12 |
| Furfuryl alcohol22 | 5.1970–26.348 | 323.15–423.15 | 0.00690–0.06170 | 39 |
| 1-Pentanol38 | 2.5400–9.8000 | 298.15–373.15 | 0.00800–0.03330 | 10 |
| 1-Hexanol38 | 3.0100–10.340 | 298.15–373.15 | 0.00995–0.04782 | 14 |
| 2-Butoxyethanol38 | 3.4400–10.270 | 298.15–373.15 | 0.01207–0.03815 | 12 |
| 1-Octanol31 | 0.6895–1.3790 | 295.15–295.15 | 0.00246–0.00541 | 5 |
| 2-Ethyl hexanol-l38 | 1.9720–9.7800 | 298.15–393.15 | 0.00758–0.05240 | 11 |
Model evaluation
Several visual and numerical analyses have been done to investigate the capability of the proposed Arrhenius-shape correlation for simulating the phase equilibrium of different alcohol/hydrogen binary systems (see “Assessment phase” section). The analyses are performed using six well-known statistical matrices, i.e., AARD%, average absolute errors (AAE), average square errors (ASE), relative absolute deviation (RAD%), relative deviation (RD%), and R2 (Eqs. 6–11).
| 6 |
| 7 |
| 8 |
| 9 |
| 10 |
| 11 |
The number of data (N), the actual value of hydrogen solubility (), its average value (), and predicted data () are required to quantize the model’s uncertainty. These statistical indices are applied over the predictions of the equations of state, the Arrhenius-shape model, and other empirical correlations suggested in the literature.
Results and discussion
This section introduces the final form of the Arrhenius-shape correlation and compares its prediction accuracy with the empirical correlations and equations of state available in the literature. Finally, the effect of equilibrium pressure, temperature, and alcohol type on hydrogen dissolution is investigated using the proposed correlation and from the experimental perspective.
Development phase
It is noted that this study aims to develop an Arrhenius-shape correlation for calculating the hydrogen solubility in a wide range of alcoholic solvents. The trial-and-error analysis approved that the pre-exponential term of the Arrhenius correlation is only a function of pressure (P), while its exponential part is temperature-dependent (T). The mathematical formulation of this statement is expressed by Eq. (12).
| 12 |
In the above equation, , , and are coefficients of the Arrhenius-shape correlation that adjust by the differential evolution optimization algorithm. The objective function is the absolute average relative deviation between experimental hydrogen solubility data and their prediction values by the Arrhenius-shape correlation (Eq. 6). The numerical values of user-entry parameters for the DE optimization algorithm have been reported in Table 2.
Table 2.
Entry parameters for the DE optimization algorithm.
| DE parameter | n | NP | |||
|---|---|---|---|---|---|
| Entry value | 1000 | 3 | 200 | 1 | 0.8 |
The adjusted coefficients of the Arrhenius-shape correlation for different alcohol/hydrogen mixtures have been reported in Table 3. The positive values of and for all binary mixtures approve that hydrogen solubility increases by increasing either pressure or temperature (or both).
Table 3.
Adjusted coefficients of Eq. (12) for different H2/alcohol binary mixtures.
| H2 (2) + | (1/MPa) | (–) | (K) |
|---|---|---|---|
| Methanol | 0.029876 | − 0.000180 | 856.1840 |
| Ethanol | 0.023976 | 0.256236 | 941.6110 |
| 1,2-Ethanediol | 0.004193 | − 0.000220 | 707.4406 |
| 1-Propanol | 0.047631 | 0.066003 | 917.3786 |
| 2-Propanol | 0.019380 | − 0.011430 | 608.6667 |
| 2-Methoxy ethanol | 0.020878 | − 0.000270 | 800.5288 |
| Allyl alcohol | 0.034288 | − 0.036260 | 917.2720 |
| 1-Butanol | 0.025247 | 0.409363 | 992.5810 |
| 2-Butanol | 0.026317 | 0.002606 | 688.0561 |
| Isobutanol | 0.018566 | 0.004370 | 582.8059 |
| 2-Ethoxyethanol | 0.020440 | 0.006338 | 701.9819 |
| Furfuryl alcohol | 0.016136 | 0.005666 | 823.8483 |
| 1-Pentanol | 0.019202 | 0.002633 | 574.0499 |
| 1-Hexanol | 0.020440 | 0.003970 | 564.4754 |
| 2-Butoxyethanol | 0.025400 | 0.001278 | 644.3644 |
| 1-Octanol | 0.080728 | − 0.009250 | 867.0004 |
| 2-Ethyl hexanol-l | 0.026627 | 0.007362 | 599.5861 |
Table 3 also states that the Arrhenius-shape correlation is applicable for modeling the phase equilibria of seventeen alcohol/hydrogen solutions. This is the most generalized empirical correlation developed for estimating phase equilibria of alcohol/hydrogen solutions up to now.
Assessment phase
This section focuses on validating the Arrhenius-shape model by laboratory-measured hydrogen solubility data, empirical correlations, and equations of state suggested in the literature. For doing so, 285 experimental data, three equations of state, and two empirical correlations have been checked.
Justification by equations of state
This section compares the accuracy of PC-SAFT, SRK, and PR equations of state and the Arrhenius-shape correlation. Literature reports the uncertainty level of these equations of state for monitoring the 2-propanol/hydrogen39, furfuryl alcohol/hydrogen22, and allyl alcohol/hydrogen40 phase equilibria. Table 4 compares the performance of the Arrhenius-shape correlation and equations of state available in the literature22,39,40. The bold cells indicate the highest prediction accuracy for each alcohol/hydrogen mixture.
Table 4.
Validation of the performance of the Arrhenius-shape correlation by PC-SAFT, PR, and SRK.
It can be seen that the Arrhenius-shape correlation has the most reliable results for all alcohol/hydrogen binary solutions. This three-parameter correlation has a simpler shape than the equations of state, needs lower computational effort, and enhances the previously achieved accuracy for hydrogen dissolution in allyl alcohol, furfuryl alcohol, and 2-propanol by at least 28.7%, 51.3%, and 51.5%, respectively. The overall uncertainty in the Arrhenius-shape correlation is also 50.5% lower than the best-obtained result by these equations of state.
Validation by previously proposed empirical correlation
There are a couple of empirical correlations for predicting the hydrogen dissolution in methanol, ethanol, 1-propanol, and 2-propanol in the literature41. The mathematical formulations of these empirical correlations are shown in Eqs. (13) and (14).
| 13 |
| 14 |
where , , , and are the constants of these correlations. The values of these constants for methanol/hydrogen, ethanol/hydrogen, 1-propanol/hydrogen, and 2-propanol/hydrogen are separately presented in Table 5.
Table 5.
Coefficients of available empirical correlations in the literature for calculating H2 solubility in the normal primary alcohols with up to four carbon atoms41.
The uncertainty in the Arrhenius-shape model predictions and the available empirical correlations in the literature for hydrogen dissolution in 1-butanol, 1-propanol, ethanol, and methanol alcohols are reported in Table 6 (the cells having the bold font show the lowest uncertainty).
Table 6.
Comparing the accuracy of the Arrhenius-shape model by available correlations in the literature for estimating the actual data36.
This table approves that the Arrhenius-shape model has the lowest uncertainty for three binary systems (i.e., 1-butanol/hydrogen, 1-propanol/hydrogen, and ethanol/hydrogen), while Eq. (14) presents the most accurate predictions for methanol/hydrogen system only. Indeed, the Arrhenius-shape model improves the previously achieved accuracy for hydrogen dissolution in ethanol, 1-butanol, and 1-propanol by more than 56.3%, 20.9%, and 19.8%, respectively. Furthermore, it is possible to decrease the cumulative prediction uncertainty of hydrogen dissolution in the methanol, ethanol, 1-butanol, and 1-propanol alcohols by at least 15.9%.
Before here, the reliability of the proposed Arrhenius-shape model has been validated by empirical correlations and equations of state available in the literature. The following section focuses on 285 experimental data for further investigating the reliability of the proposed three-parameter correlation.
Validation by laboratory-measurement data
The predicted values of hydrogen solubility in various alcohols by the Arrhenius-shape correlation versus their corresponding actual data are exhibited in Fig. 1. This figure displays predictions versus actual values for all binary alcohol/hydrogen systems. It is not hard to visually approve an excellent agreement between model predictions and experimental data. It is worth noting that the R2 of 0.99589 has been observed between the model predictions and laboratory measurements for all alcohol/hydrogen mixtures.
Figure 1.

Laboratory versus predicted values of hydrogen solubility in the considered alcohols.
Figure 2 displays the prediction uncertainty of the Arrhenius-shape correlation for hydrogen solubility in all of the alcohols separately. This figure states that the uncertainty level ranges from AARD = 0.68% (for 1-pentanol/hydrogen) to AARD = 6.67% (for 1-butanol/hydrogen). Furthermore, excluding the phase equilibria of H2/methanol and H2/1-butanol, all other binary mixtures are simulated with the AARD of lower than 4.19%.
Figure 2.

Uncertainty in the prediction of the Arrhenius-shape correlation for various H2/alcohol systems.
Table 7 utilizes four other statistical matrices (AAE, RAD%, ASE, and R2) to investigate the Arrhenius-shape model’s capability for estimating the phase equilibria of seventeen H2/alcohol mixtures. The last row of Table 7 presents numerical values of these statistical indices for all alcohol/hydrogen binary systems, i.e., 285 experimental data.
Table 7.
Assessment the reliability of the Arrhenius-shape correlation using the AAE, RAD%, ASE, and R2 indices.
| H2 (2)+ | AAE | RAD% | ASE | R2 |
|---|---|---|---|---|
| Methanol | 0.0012 | 8.37 | 5.44 × 10⁻⁶ | 0.99281 |
| Ethanol | 0.0014 | 10.61 | 3.74 × 10⁻⁶ | 0.99320 |
| 1,2-Ethanediol | 0.0000 | 4.28 | 3.52 × 10⁻⁹ | 0.99941 |
| 1-Propanol | 0.0018 | 8.59 | 9.58 × 10⁻⁶ | 0.99340 |
| 2-Propanol | 0.0008 | 7.12 | 1.80 × 10⁻⁶ | 0.99681 |
| 2-Methoxy ethanol | 0.0001 | 1.95 | 9.85 × 10⁻⁹ | 0.99995 |
| Allyl alcohol | 0.0007 | 6.58 | 1.05 × 10⁻⁶ | 0.99675 |
| 1-Butanol | 0.0031 | 12.51 | 1.91 × 10⁻⁵ | 0.99122 |
| 2-Butanol | 0.0003 | 3.18 | 1.95 × 10⁻⁷ | 0.99919 |
| Isobutanol | 0.0001 | 1.28 | 3.42 × 10⁻⁸ | 0.99984 |
| 2-Ethoxyethanol | 0.0002 | 2.69 | 7.50 × 10⁻⁸ | 0.99963 |
| Furfuryl alcohol | 0.0006 | 5.08 | 7.30 × 10⁻⁷ | 0.99809 |
| 1-Pentanol | 0.0002 | 2.21 | 6.43 × 10⁻⁸ | 0.99952 |
| 1-Hexanol | 0.0004 | 3.95 | 3.06 × 10⁻⁷ | 0.99894 |
| 2-Butoxyethanol | 0.0004 | 5.41 | 4.36 × 10⁻⁷ | 0.99768 |
| 1-Octanol | 0.0001 | 18.11 | 4.39 × 10⁻⁸ | 0.98054 |
| 2-Ethyl hexanol-l | 0.0003 | 3.07 | 1.76 × 10⁻⁷ | 0.99958 |
| Whole the data | 0.0008 | 5.51 | 3.20 × 10⁻⁶ | 0.99589 |
Monitoring the effect of equilibrium conditions on hydrogen solubility
It is previously explained that the Arrhenius-shape correlation has the highest uncertainty for H2/1-butanol and H2/methanol (see Fig. 2). To demonstrate that this level of uncertainty is entirely unimportant, the experimental and modeling results for these two mixtures have been shown in Fig. 3a,b.
Figure 3.
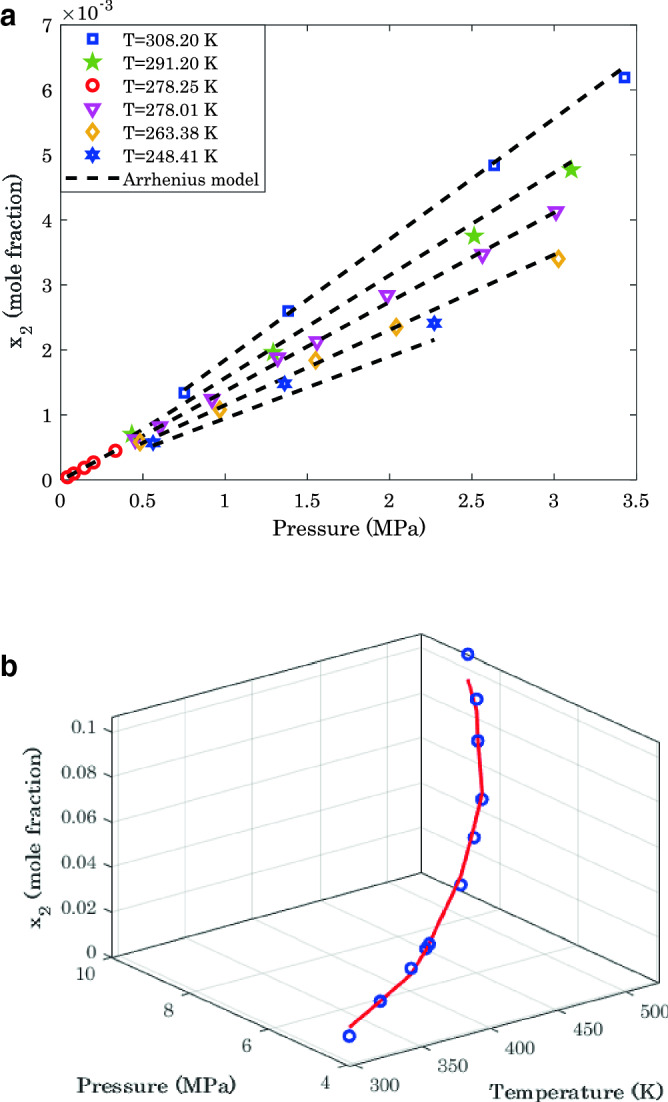
(a) Laboratory and modeling results for phase equilibria of methanol/hydrogen. (b) Phase equilibria of 1-butanol/hydrogen: laboratory data (o) and model prediction (—).
Figure 3a represents the effect of pressure on the hydrogen solubility in methanol for six temperature levels. It can be seen that an excellent agreement exists between experimental measurements and predicted values by the Arrhenius-shape correlation. The proposed model correctly persuades the experimental trend and anticipates all individual data points precisely.
Moreover, experimental data and modeling predictions show that the hydrogen absorption capacity of the methanol increases by an increase in either pressure or temperature. This observation was also previously anticipated by the positive values of the Arrhenius correlation ( and ). The positive effect of the pressure on the hydrogen solubility may be related to enhancing the mass transfer driving force by increasing the pressure. Therefore, the solubility of gases in liquids (hydrogen solubility in methanol) improves by increasing the pressure. On the other hand, the literature states that increasing the temperature increases the dissolution tendency of a low-soluble gas in the liquids23.
Experimental measurements of H2 solubility in 1-butanol and their related predictions by the proposed three-parameter model have been presented in Fig. 3b.
Since the experimental measurements for this binary mixture are fully scattered, it is impossible to depict this graph on a two-dimensional scale. Meanwhile, excellent compatibility can be understood between experimental and modeling findings. Furthermore, like the H2/methanol mixture, the pressure and temperature positively affect the hydrogen absorption capacity of 1-butanol. All reasons for explaining the impact of temperature and pressure on the H2/methanol phase equilibria may also be referred to here.
Monitoring the effect of alcohol type on the hydrogen solubility
Figure 4 is plotted to check the hydrogen capture capacity of the investigated alcohols. Since the reported equilibrium conditions for some of the H2/alcohol systems are fully scattered, it is impossible to compare all seventeen binary mixtures. Therefore, Fig. 4 only compares the hydrogen absorption capacity of ten alcohol/hydrogen mixtures using experimental data and modeling predictions. Visual inspection can easily approve the excellent compatibility between experimental and modeling data. Moreover, the AARDs between actual data and modeling results for all cases are lower than 1.27%.
Figure 4.
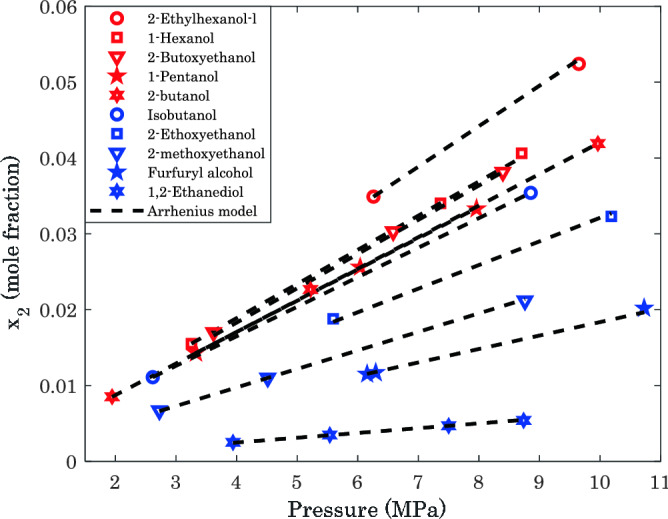
Comparing the H2 capture capacity of several alcohols at T = 373.15 K.
The positive impact of temperature and pressure on the H2 absorption tendency of these alcohols is also quite clear. Moreover, this analysis approves that 2-ethyl hexanol has the highest hydrogen absorption capacity among the ten investigated alcoholic media at T = 373.15 K.
Pure simulation results
Since the actual measurements of phase equilibria of some alcohol/hydrogen systems are fully scattered, and their temperature and pressure are different, it is impossible to make a comparison only using the experimental data. Therefore, this section relies on the Arrhenius-shape correlation to make the comparison on an identical basis. The comparisons are made on the average hydrogen capture capacity of the investigated alcohols and the impact of operating conditions on hydrogen dissolution. This comparison analysis helps find the alcohol with the maximum ability to capture H2 molecules.
Tracking the effect of alcohol types
Investigating the experimental databank (see Table 1) indicates that 5.197 < P < 8.82 MPa and 341.5 < T < 373.15 K is utilized for measuring the hydrogen dissolution in all seventeen checked alcohols. For comparison on the same basis, this joint operating range is fed into the Arrhenius-shape correlation to calculate the average values of hydrogen dissolution in various alcohols (Fig. 5). It can be readily observed that 1-octanol and 1,2-ethanediol have the highest and lowest tendency to absorb hydrogen molecules, respectively.
Figure 5.
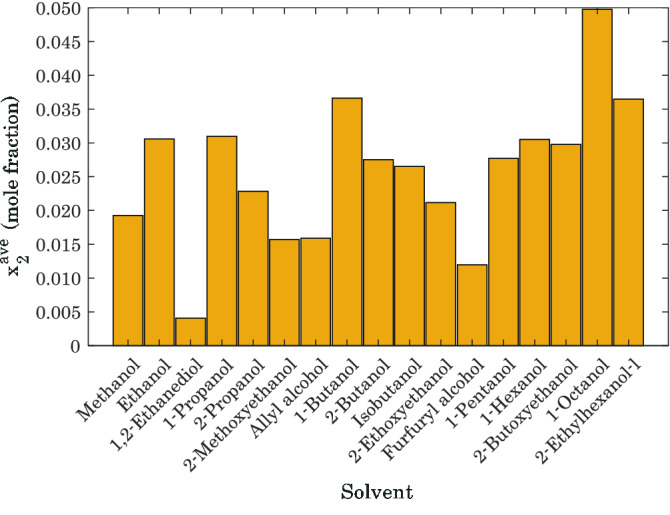
Average values of hydrogen absorption capacity of seventeen alcohols in the range of 5.197 < P < 8.82 and 341.5 < T < 373.15: pure simulation results.
Monitoring the effect of operating conditions
Simulation profiles for hydrogen dissolution in different alcohols versus temperature at P = 5.197 MPa have been shown in Fig. 6. This figure also approves that 1-octanol and 1,2-ethanediol have the highest and lowest tendency for hydrogen absorption in a wide range of temperatures.
Figure 6.

Comparing the H2 capturing ability of the considered alcohols at P = 5.197 MPa: pure simulation results.
The prediction results for hydrogen dissolution in different alcohols versus pressure at T = 373.15 K have been presented in Fig. 7. Like the previous findings, it is clear that 1-octanol and 1,2-ethanediol have the highest and lowest ability to absorb H2 molecules from a gas stream.
Figure 7.

Investigating the H2 capturing ability of the considered alcohols at T = 373.15 K: pure simulation results.
A deep investigation of the experimental and simulation results in Figs. 4 and 7 justifies that the phase equilibria of all H2/alcohol solutions obey Henry’s law (Eq. 15) for almost all pressure and temperature conditions.
| 15 |
In Eq. (15), is the H2 partial pressure in gas phase, shows H2 mole fraction in alcohols, and HL indicates Henry’s law constant.
Graphical analysis for maximizing hydrogen solubility in 1-octanol
Three previous simulation graphs predicted that 1-octanol has the maximum ability to capture H2 molecules. Therefore, the surface (3D) profile of hydrogen dissolution in 1-octanol versus temperature and pressure is simulated using the Arrhenius-shape correlation (Fig. 8). This type of simulation graph helps determine equilibrium conditions that maximize H2 dissolution in alcohol. Figure 8 states that the highest hydrogen dissolution of 0.06883 can be achieved at the maximum allowable operating conditions (T = 373.1 K and P = 8.82 MPa). This figure also shows that it is possible to double hydrogen solubility in 1-octanol by increasing temperature from 341.5 K to 373.1 K (~ 32 K) and pressure from 5.197 MPa to 8.82 MPa (~ 3.6 MPa).
Figure 8.

Three-dimensional profile for phase equilibria of 1-octanol/hydrogen binary mixture.
Conclusion
This study established a general three-parameter correlation for accurately predicting the hydrogen dissolution in seventeen alcohols (i.e., methanol, ethanol, 1,2-ethanediol, 1-propanol, 2-propanol, 2-methoxy ethanol, allyl alcohol, 1-butanol, 2-butanol, isobutanol, 2-ethoxyethanol, furfuryl alcohol, 1-pentanol, 1-hexanol, 2-butoxyethanol, 1-octanol, and 2-ethyl hexanol-l.). Indeed, the pre-exponential and exponential parts of this Arrhenius-shape correlation were related to the pressure and temperature, respectively. This model not only has the simplest possible form, but it is also the most generalized/accurate correlation for phase equilibrium monitoring of alcohol/hydrogen binary systems. Only the phase equilibria of methanol/hydrogen and 1-butanol/hydrogen have been simulated with the AARD of higher than 6%, and all other binary mixtures have the AARD of lower than 4.2%. The proposed correlation estimates whole of the experimental solubility data with the AARD = 3.28%, AAE = 8 × 10⁻⁴, RAD = 5.51%, ASE = 3.20 × 10⁻⁶, and R2 = 0.99589. Moreover, the Arrhenius-shape model has more accurate predictions than the equations of state and empirical correlations in the literature. The pure simulation analysis exhibited that 1-octanol and 1,2-ethanediol have the highest and lowest tendency to absorb the hydrogen molecules. Furthermore, it was also observed that all alcohol/hydrogen binary mixtures thermodynamically obey Henry’s law. The maximum hydrogen dissolution of 0.06883 can be reached at the maximum allowable operating pressure and temperature (T = 373.1 K and P = 8.82 MPa).
Author contributions
S.H. prepared all parts of the manuscript (SH the sole author of the manuscript).
Data availability
All data generated or analyzed during this study are available on reasonable request from the corresponding author.
Competing interests
The author declares no competing interests.
Footnotes
Publisher's note
Springer Nature remains neutral with regard to jurisdictional claims in published maps and institutional affiliations.
References
- 1.Vaferi B, Eslamloueyan R, Ayatollahi S. Application of recurrent networks to classification of oil reservoir models in well-testing analysis. Energy Sources Part A Recover Util. Environ. Eff. 2015;37:174–180. doi: 10.1080/15567036.2011.582610. [DOI] [Google Scholar]
- 2.Qiao W, Li Z, Liu W, Liu E. Fastest-growing source prediction of US electricity production based on a novel hybrid model using wavelet transform. Int. J. Energy Res. 2022;46:1766–1788. doi: 10.1002/er.7293. [DOI] [Google Scholar]
- 3.Qiao, W., Liu, W. & Liu, E. A combination model based on wavelet transform for predicting the difference between monthly natural gas production and consumption of US. Energy, 235, 121216 (2021).
- 4.Höök M, Tang X. Depletion of fossil fuels and anthropogenic climate change—A review. Energy Policy. 2013;52:797–809. doi: 10.1016/j.enpol.2012.10.046. [DOI] [Google Scholar]
- 5.Vaferi B, Eslamloueyan R, Ghaffarian N. Hydrocarbon reservoir model detection from pressure transient data using coupled artificial neural network-Wavelet transform approach. Appl. Soft Comput. J. 2016;47:63–75. doi: 10.1016/j.asoc.2016.05.052. [DOI] [Google Scholar]
- 6.Zhang SW, Shang LY, Zhou L, Lv ZB. Hydrate deposition model and flow assurance technology in gas-dominant pipeline transportation systems: A review. Energy Fuels. 2022;36:1747–1775. doi: 10.1021/acs.energyfuels.1c03812. [DOI] [Google Scholar]
- 7.Liu, J. et al. Highly efficient photocatalytic degradation of oil pollutants by oxygen deficient SnO2 quantum dots for water remediation. Chem. Eng. J., 404, 127146 (2021).
- 8.Rahimpour MR, Mazinani S, Vaferi B, Baktash MS. Comparison of two different flow types on CO removal along a two-stage hydrogen permselective membrane reactor for methanol synthesis. Appl. Energy. 2011;88:41–51. doi: 10.1016/j.apenergy.2010.04.022. [DOI] [Google Scholar]
- 9.Esmaeili-Faraj SH, Hassanzadeh A, Shakeriankhoo F, Hosseini S, Vaferi B. Diesel fuel desulfurization by alumina/polymer nanocomposite membrane: Experimental analysis and modeling by the response surface methodology. Chem. Eng. Process. - Process Intensif. 2021;164:108396. doi: 10.1016/j.cep.2021.108396. [DOI] [Google Scholar]
- 10.Daryayehsalameh B, Nabavi M, Vaferi B. Modeling of CO2 capture ability of [Bmim][BF4] ionic liquid using connectionist smart paradigms. Environ. Technol. Innov. 2021;22:101484. doi: 10.1016/j.eti.2021.101484. [DOI] [Google Scholar]
- 11.Zhang Y, Gerdroodbary MB, Hosseini S, Abazari AM, Li Z. Effect of hybrid coaxial air and hydrogen jets on fuel mixing at supersonic crossflow. Int. J. Hydrogen Energy. 2021;46:16048–16062. doi: 10.1016/j.ijhydene.2021.02.070. [DOI] [Google Scholar]
- 12.Balat M, Balat H. Recent trends in global production and utilization of bio-ethanol fuel. Appl. Energy. 2009;86:2273–2282. doi: 10.1016/j.apenergy.2009.03.015. [DOI] [Google Scholar]
- 13.Cao Y, Kamrani E, Mirzaei S, Khandakar A, Vaferi B. Electrical efficiency of the photovoltaic/thermal collectors cooled by nanofluids: Machine learning simulation and optimization by evolutionary algorithm. Energy Rep. 2022;8:24–36. doi: 10.1016/j.egyr.2021.11.252. [DOI] [Google Scholar]
- 14.Ejaz A, et al. Concentrated photovoltaics as light harvesters: Outlook, recent progress, and challenges. Sustain. Energy Technol. Assessments. 2021;46:101199. doi: 10.1016/j.seta.2021.101199. [DOI] [Google Scholar]
- 15.Karimi M, Hosin Alibak A, Seyed Alizadeh SM, Sharif M, Vaferi B. Intelligent modeling for considering the effect of bio-source type and appearance shape on the biomass heat capacity. Meas. J. Int. Meas. Confed. 2022;189:110529. doi: 10.1016/j.measurement.2021.110529. [DOI] [Google Scholar]
- 16.Karimi M, Khosravi M, Fathollahi R, Khandakar A, Vaferi B. Determination of the heat capacity of cellulosic biosamples employing diverse machine learning approaches. Energy Sci. Eng. 2022 doi: 10.1002/ese3.1155. [DOI] [Google Scholar]
- 17.Liu, W. Biofuels (Hydrogen and Ethanol) Production of Clostridium by Cellulose Bioconversion. (PhD dissertation, University of Oklahoma, Oklahoma, USA, 2018).
- 18.Vaferi B, Eslamloueyan R. Hydrocarbon reservoirs characterization by co-interpretation of pressure and flow rate data of the multi-rate well testing. J. Pet. Sci. Eng. 2015;135:59–72. doi: 10.1016/j.petrol.2015.08.016. [DOI] [Google Scholar]
- 19.Sharma N, et al. Effect of catalyst and temperature on the quality and productivity of HTL bio-oil from microalgae: A review. Renew. Energy. 2021;174:810–822. doi: 10.1016/j.renene.2021.04.147. [DOI] [Google Scholar]
- 20.Trinh TKH, de Hemptinne JC, Lugo R, Ferrando N, Passarello JP. Hydrogen solubility in hydrocarbon and oxygenated organic compounds. J. Chem. Eng. Data. 2016;61:19–34. doi: 10.1021/acs.jced.5b00119. [DOI] [Google Scholar]
- 21.Gandarias I, et al. From biomass to fuels: Hydrotreating of oxygenated compounds. Int. J. Hydrogen Energy. 2008;33:3485–3488. doi: 10.1016/j.ijhydene.2007.12.070. [DOI] [Google Scholar]
- 22.Ivaniš G, Žilnik LF, Likozar B, Grilc M. Hydrogen solubility in bio-based furfural and furfuryl alcohol at elevated temperatures and pressures relevant for hydrodeoxygenation. Fuel. 2021;290:120021. doi: 10.1016/j.fuel.2020.120021. [DOI] [Google Scholar]
- 23.Xie J, Liu X, Lao X, Vaferi B. Hydrogen solubility in furfural and furfuryl bio-alcohol: Comparison between the reliability of intelligent and thermodynamic models. Int. J. Hydrogen Energy. 2021;46:36056–36068. doi: 10.1016/j.ijhydene.2021.08.166. [DOI] [Google Scholar]
- 24.Descamps, C., Coquelet, C., Bouallou, C. & Richon, D. Solubility of hydrogen in methanol at temperatures from 248.41 to 308.20 K. Thermochim. Acta430, 1–7 (2005).
- 25.Majeed I, et al. Controlled Synthesis of TiO2 Nanostructures: Exceptional hydrogen production in alcohol-water mixtures over Cu(OH)2–Ni(OH)2/TiO2 nanorods. ChemistrySelect. 2017;2:7497–7507. doi: 10.1002/slct.201701080. [DOI] [Google Scholar]
- 26.Gęca M, Litak G. Mean effective pressure oscillations in an IC-SI engine after the addition of hydrogen-rich gas. Measurement. 2017;108:18–25. doi: 10.1016/j.measurement.2017.05.025. [DOI] [Google Scholar]
- 27.Trincado M, Banerjee D, Gruetzmacher H. Molecular catalysts for hydrogen production from alcohols. Energy Environ. Sci. 2014;7:2464–2503. doi: 10.1039/C4EE00389F. [DOI] [Google Scholar]
- 28.Collins-Martinez V, Bretado ME, Zaragoza MM, Gutiérrez JS, Ortiz AL. Absorption enhanced reforming of light alcohols (methanol and ethanol) for the production of hydrogen: thermodynamic modeling. Int. J. Hydrogen Energy. 2013;38:12539–12553. doi: 10.1016/j.ijhydene.2012.11.146. [DOI] [Google Scholar]
- 29.Umegaki T, Yamada Y, Ueda A, Kuriyama N, Xu Q. Hydrogen production via steam reforming of ethyl alcohol over palladium/indium oxide catalyst. Res. Lett. Phys. Chem. 2009;2009:1–4. doi: 10.1155/2009/631815. [DOI] [Google Scholar]
- 30.López-Tenllado FJ, et al. Photocatalytic production of hydrogen from binary mixtures of C-3 alcohols on Pt/TiO2: Influence of alcohol structure. Catal. Today. 2019;328:2–7. doi: 10.1016/j.cattod.2018.10.001. [DOI] [Google Scholar]
- 31.Kim KJ, Way TR, Feldman KT, Razani A. Solubility of hydrogen in octane, 1-octanol, and squalane. J. Chem. Eng. Data. 1997;42:214–215. doi: 10.1021/je960268z. [DOI] [Google Scholar]
- 32.Trincado M, Vogt M. CO2-based hydrogen storage–hydrogen liberation from methanol/water mixtures and from anhydrous methanol. Phys. Sci. Rev. 2018;3:20170014. [Google Scholar]
- 33.Campos J. Dehydrogenation of alcohols and polyols from a hydrogen production perspective: Phys. Sci. Rev. 2018;3:20170017. [Google Scholar]
- 34.Khamhaeng P, Laosiripojana N, Assabumrungrat S, Kim-Lohsoontorn P. Techno-economic analysis of hydrogen production from dehydrogenation and steam reforming of ethanol for carbon dioxide conversion to methanol. Int. J. Hydrogen Energy. 2021;46:30891–30902. doi: 10.1016/j.ijhydene.2021.04.048. [DOI] [Google Scholar]
- 35.d’Angelo JVH, Francesconi AZ. Salt effect in the solubility of hydrogen in n-alcohols at pressures up to 10 MPa and temperatures up to 498.15 K. Braz. J. Chem. Eng. 2000;17:497–506. doi: 10.1590/S0104-66322000000400014. [DOI] [Google Scholar]
- 36.d’Angelo JVH, Francesconi AZ. Gas-liquid solubility of hydrogen in n-alcohols (1< n< 4) at pressures from 3.6 MPa to 10 MPa and temperatures from 298.15 K to 525.15 K. J. Chem. Eng. Data. 2001;46:671–674. doi: 10.1021/je000189u. [DOI] [Google Scholar]
- 37.Brunner E, Hültenschmidt W, Schlichthärle G. Fluid mixtures at high pressures IV. Isothermal phase equilibria in binary mixtures consisting of (methanol+ hydrogen or nitrogen or methane or carbon monoxide or carbon dioxide) J. Chem. Thermodyn. 1987;19:273–291. doi: 10.1016/0021-9614(87)90135-2. [DOI] [Google Scholar]
- 38.Brunner E. Solubility of hydrogen in alcohols. Berichte der Bunsengesellschaft für Phys. Chemie. 1979;83:715–721. doi: 10.1002/bbpc.19790830715. [DOI] [Google Scholar]
- 39.Jaatinen S, Touronen J, Karinen R, Uusi-Kyyny P, Alopaeus V. Hydrogen solubility in furfural and 2-propanol: Experiments and modeling. J. Chem. Thermodyn. 2017;112:1–6. doi: 10.1016/j.jct.2017.04.004. [DOI] [Google Scholar]
- 40.Qureshi MS, Touronen J, Uusi-Kyyny P, Richon D, Alopaeus V. Solubility of hydrogen in bio-oil compounds. J. Chem. Thermodyn. 2016;102:406–412. doi: 10.1016/j.jct.2016.07.010. [DOI] [Google Scholar]
- 41.Safamirzaei M, Modarress H, Mohsen-Nia M. Modeling the hydrogen solubility in methanol, ethanol, 1-propanol and 1-butanol. Fluid Phase Equilib. 2010;289:32–39. doi: 10.1016/j.fluid.2009.10.012. [DOI] [Google Scholar]
- 42.Jiang Y, Zhang G, Wang J, Vaferi B. Hydrogen solubility in aromatic/cyclic compounds: Prediction by different machine learning techniques. Int. J. Hydrogen Energy. 2021;46:23591–23602. doi: 10.1016/j.ijhydene.2021.04.148. [DOI] [Google Scholar]
- 43.Akpan Emmanuel, F., Akpan Veronica, M. & Inyang Udeme, U. Geoelectrical Investigation Of Groundwater Quality Through Estimates Of Total Dissolved Solids And Electrical Conductivity In Parts Of Akwa Ibom State, Southern Nigeria. Malaysian J. G.4(1), 32–37 (2020).
- 44.Chu YM, Bashir S, Ramzan M, Malik MY. Model-based comparative study of magnetohydrodynamics unsteady hybrid nanofluid flow between two infinite parallel plates with particle shape effects. Math. Methods Appl. Sci. 2022 doi: 10.1002/mma.8234. [DOI] [Google Scholar]
- 45.Zhang Y, et al. Analysis of grinding mechanics and improved predictive force model based on material-removal and plastic-stacking mechanisms. Int. J. Mach. Tools Manuf. 2017;122:81–97. doi: 10.1016/j.ijmachtools.2017.06.002. [DOI] [Google Scholar]
- 46.Yang M, et al. Predictive model for minimum chip thickness and size effect in single diamond grain grinding of zirconia ceramics under different lubricating conditions. Ceram. Int. 2019;45:14908–14920. doi: 10.1016/j.ceramint.2019.04.226. [DOI] [Google Scholar]
- 47.Yang M, Li C, Luo L, Li R, Long Y. Predictive model of convective heat transfer coefficient in bone micro-grinding using nanofluid aerosol cooling. Int. Commun. Heat Mass Transf. 2021;125:105317. doi: 10.1016/j.icheatmasstransfer.2021.105317. [DOI] [Google Scholar]
- 48.Gao T, et al. Mechanics analysis and predictive force models for the single-diamond grain grinding of carbon fiber reinforced polymers using CNT nano-lubricant. J. Mater. Process. Technol. 2021;290:116976. doi: 10.1016/j.jmatprotec.2020.116976. [DOI] [Google Scholar]
- 49.Duan Z, et al. Milling force model for aviation aluminum alloy: academic insight and perspective analysis. Chin. J. Mech. Eng. 2021;34:1–35. doi: 10.1186/s10033-021-00536-9. [DOI] [Google Scholar]
- 50.Yang M, et al. Semiempirical heat flux model of hard-brittle bone material in ductile microgrinding. J. Manuf. Process. 2021;71:501–514. doi: 10.1016/j.jmapro.2021.09.053. [DOI] [Google Scholar]
- 51.Qiao W, et al. An innovative coupled model in view of wavelet transform for predicting short-term PM10 concentration. J. Environ. Manage. 2021;289:112438. doi: 10.1016/j.jenvman.2021.112438. [DOI] [PubMed] [Google Scholar]
- 52.Zha TH, et al. A fuzzy-based strategy to suppress the novel coronavirus (2019-NCOV) massive outbreak. Appl. Comput. Math. 2021;20:160–176. [Google Scholar]
- 53.Moosavi, S. R., Vaferi, B. & Wood, D. A. Auto-characterization of naturally fractured reservoirs drilled by horizontal well using multi-output least squares support vector regression. Arab. J. G.14(7), 1–12 (2021).
- 54.Karimi, M., Vaferi, B., Hosseini, S. H., Olazar, M. & Rashidi, S. Smart computing approach for design and scale-up of conical spouted beds with open-sided draft tubes. Particuology, 55, 179–190 (2021).
- 55.Zhao TH, Khan MI, Chu YM. Artificial neural networking (ANN) analysis for heat and entropy generation in flow of non-Newtonian fluid between two rotating disks. Math. Methods Appl. Sci. 2021 doi: 10.1002/mma.7310. [DOI] [Google Scholar]
- 56.Karimi M, Vaferi B, Hosseini SH, Rasteh M. Designing an efficient artificial intelligent approach for estimation of hydrodynamic characteristics of tapered fluidized bed from its design and operating parameters. Ind. Eng. Chem. Res. 2018;57:259–267. doi: 10.1021/acs.iecr.7b02869. [DOI] [Google Scholar]
- 57.Mahmoodi F, Darvishi P, Vaferi B. Prediction of coefficients of the Langmuir adsorption isotherm using various artificial intelligence (AI) techniques. J. Iran. Chem. Soc. 2018;15:2747–2757. doi: 10.1007/s13738-018-1462-4. [DOI] [Google Scholar]
- 58.Iqbal, S. A., Hafez, M. G., Chu, Y. M. & Park, C. Dynamical Analysis of nonautonomous RLC circuit with the absence and presence of Atangana-Baleanu fractional derivative. J.Appl. Anal. Comput.12(2), 770–789 (2022).
- 59.Chu, Y. M. et al. Combined impact of Cattaneo-Christov double diffusion and radiative heat flux on bio-convective flow of Maxwell liquid configured by a stretched nano-material surface. Appl. Math. Comput.419, 126883 (2022).
- 60.Nazeer, M. et al. Theoretical study of MHD electroosmotically flow of third-grade fluid in micro channel. Appl. Math. Comput.420, 126868 (2022).
- 61.Li CH, Li JY, Wang S, Zhang Q. Modeling and numerical simulation of the grinding temperature field with nanoparticle jet of MQL. Adv. Mech. Eng. 2013;5:986984. doi: 10.1155/2013/986984. [DOI] [Google Scholar]
- 62.Wang F, et al. Numerical solution of traveling waves in chemical kinetics: Time-fractional fishers equations. Fractals. 2022;30:2240051. doi: 10.1142/S0218348X22400515. [DOI] [Google Scholar]
- 63.Logan SR. The origin and status of the Arrhenius equation. J. Chem. Educ. 1982;59:279. doi: 10.1021/ed059p279. [DOI] [Google Scholar]
- 64.Storn R, Price K. Differential Evolution - A simple and efficient heuristic for global optimization over continuous spaces. J. Glob. Optim. 1997;11:341–359. doi: 10.1023/A:1008202821328. [DOI] [Google Scholar]
Associated Data
This section collects any data citations, data availability statements, or supplementary materials included in this article.
Data Availability Statement
All data generated or analyzed during this study are available on reasonable request from the corresponding author.