

Abstract
The interrelation of cancer and Alzheimer's disorder (AD)-associated molecular mechanisms, reported last decade, paved the path for drug discoveries. In this direction, while chemotherapy is well established for breast cancer (BC), the detection and targeted therapy for AD is not advanced due to a lack of recognized peripheral biomarkers. The present study aimed to find diagnostic and prognostic molecular signature markers common to both BC and AD for possible drug targeting and repurposing. For these disorders, two corresponding microarray datasets (GSE42568, GSE33000) were used for identifying the differentially expressed genes (DEGs), resulting in recognition of CD209 and MCM7 as the two common players. While the CD209 gene was upregulated in both disorders and has been studied vastly, the MCM7 gene showed a strikingly reverse pattern of expression level, downregulated in the case of BC while upregulated in the case of AD. Thus, the MCM7 gene was further analyzed for expression, predictions, and validations of its structure and protein–protein interaction (PPI) for the possible development of new treatment methods for AD. The study concluded with indicative drug repurposing studies to check the effect of existing clinically approved drugs for BC for rectifying the expression levels of the mutated MCM7 gene in AD.
Supplementary Information
The online version contains supplementary material available at 10.1007/s13205-022-03207-1.
Keywords: Breast cancer, Alzheimer's disorder, CD209, MCM7, Gene annotation, Pathway analysis
Introduction
A mass of people around the globe suffer from cancer and neurodegenerative disorder; thus deciphering molecular cues, and their role becomes pivotal for therapy. The advancement in modern technologies implemented to diagnose and treat these disorders has imparted its effectiveness and personalization. The findings based on the in silico studies have revolutionized the pace and efficacy of new treatment methods (Paryan et al. 2016; Chase et al. 2018) for such disorders. Among the cancers, breast cancer (BC) is the most common in mortality rates. WHO reported that BC surpassed lung cancer cases with 2.3 million new cases and is fifth in a row as the leading cause of cancer deaths in 2020 (Sung et al. 2021). Among different subtypes of BC, the common examples are ductal and lobular carcinoma, estrogen receptor-positive (luminal A), HER2 + (Human Epidermal Growth Factor Receptor 2), triple-negative, and basal-like (Park et al. 2016). Based on the progression, BC could be either grade 1 (well-differentiated cancer cells), grade 2 (moderately differentiated cancer cells), or grade 3 (poorly differentiated cancer cells growing faster) (Olsson et al. 2013). For the drug discovery of BC, the gene expression, pathogenesis, and prognostic markers can all be assessed using microarray and sequencing-based methods (Van De Vijver et al. 2002). The gene-expression profiling data from breast tumors can generate further molecular interaction networks, which can then be used to identify hubs (genes or proteins with a high degree of connectivity to other genes or proteins). As a result, these nodes can be used for cancer detection and optimization of therapy protocol. Metastasis events can also be predicted using these biomarkers (Hosseinalizadeh et al. 2021). Despite so much research aimed at identifying the various processes and crucial biological interactions involved in the evolution of BC, the exact mechanism remains a mystery (Kumar et al. 2021). Since the number of genes significantly exceeds the number of functional pathways, the pathway analysis can significantly improve the stability of prognostic cancer models. The functions of most of these pathways may be found in various databases. As a result, the simulated models can be better understood, and treatment methods can be developed that are more effective (Ansari et al. 2021). Alternatively, the discovery of rendezvous common nodes in molecular pathways of different disorders can guide the repurposing of drugs or therapeutic methods for the linked disorder.
AD, a progressive neurodegenerative disorder and the most common cause of dementia, has affected a large older age population in developed countries. As per the 2019 official record of the US, 121,499 deaths were reported from AD, making it the sixth-leading cause of death in the US and the fifth-leading cause of death among those aged 65 and older in the US (Wiley 2021). AD is primarily detected by the formation of amyloid plaques, NFTs (Neurofibrillary Tangles), and the neurites in the neuron cells with hyperphosphorylated tau protein (Dhanavade and Sonawane 2020; Siano et al. 2020). This further leads to neuron cell death, atrophy, and/or inflammation within the hippocampal area of the brain (Rao et al. 2022). Mutations in the APP (Amyloid Precursor Protein), PS-1 (Presenilin-1), and PS-2 (Presenilin-2) genes are among the most common causes of increased risk for Alzheimer's disease (AD) (Dhanavade and Sonawane 2020). Clusterin (CLU), complement receptor 1 (CR1), phosphatidylinositol-binding clathrin assembly protein (PICALM), and sortilin-related receptor (SORL1) have all been identified as potential risk factors for AD (Bagyinszky et al. 2014). The most recent additions are new genes that may have a role in the formation of late-onset AD, such as TREM2 (triggering receptor expressed on myeloid cells 2) and Cluster of Differentiation (CD33) (Bagyinszky et al. 2014). To better understand how AD develops and how it might be treated, finding additional genes associated with the disease is critical.
AD has common mechanisms with other human diseases and comorbidity with diabetes and other severe disorders (Surguchov 2020). On the other hand, cancer and AD are reported to have inverted dynamics at the cellular level. It has been previously established that cancer cells are in a constant state of proliferative signaling, while in AD, this signaling is disrupted (Hanahan and Weinberg 2011). The growth suppressors tend to elude cancer cells, but they significantly impact neurons affected by AD (Hanahan and Weinberg 2011). Cancer suppresses apoptosis, while AD increases it (Nudelman et al. 2019). According to Lanni and colleagues' comprehensive research, the inverse association is caused by a nucleotide replacement in the PIN1 gene's single-nucleotide polymorphisms. Two SNPs, rs2233678 and rs2287839, have been linked to an increased risk of cancer and AD. When SNP rs2233678 is overexpressed, it increases cancer risk, while SNP rs2287839 is underexpressed, it increases MCI (Mild Cognitive Impairment) and AD risk (Lanni et al. 2021). As a result of such indicative reports, anti-cancer medications are being repurposed to tackle both illnesses (Snyder et al. 2017). Presently, in vitro studies have reported ciprofloxacin (antibiotic), heliquinomycin (antibiotic), and simvastatin (anti-cholesterol drug) as MCM7 inhibitors for cancer therapy. However, these have not been evaluated for the treatment of AD (Ishimi et al., 2009; Liang et al., 2017; Simon et al. 2013; Toyokawa et al. 2011). According to the research, people who took chemotherapy had a decreased chance of AD than those who did not (Frain et al. 2017). However, the molecular cues behind this are still unsolved, and these require to be more specifically analyzed to find an improved and effective treatment method. The present in silico study aimed to decode the rendezvous pathway nodes and linked genes between BC and AD that could be further studied for drug repurposing. As the BC medications could be repurposed to treat AD by examining the genes in common pathways of these two disorders, the prognostic factors and related proteins are examined in detail to determine the regulatory effect on AD.
Experimental design
The GEO database of NCBI (https://www.ncbi.nlm.nih.gov/geo/) was used to collect the datasets for cancer and AD (Barrett et al. 2013). Based on healthy versus subjects with the disease, these datasets were compared. The data were standardized, and a log transformation was used to perform statistical analysis. Benjamini–Hochberg correction was also employed to reduce the number of false positives. Padj < 0.01 was used to download the results and the list of significant differentially expressed genes (DEGs). VENNY 2.1.0, a Venn diagram generating tool (https://bioinfogp.cnb.csic.es/tools/VENNY 2.1.0/), was used to identify the genes in common. Gene Ontology Resource (http://geneontology.org/) (The Gene Ontology Consortium 2021) and ENRICHR (Kuleshov et al. 2016) were used for the gene ontology and gene enrichment research, respectively. An investigation into protein–protein interactions and subcellular localization of the target protein was also conducted. The target protein under study was subjected to domain analysis, a structure prediction, and a confirmation of the results. Figure 1 depicts the workflow for the current methodology.
Fig. 1.
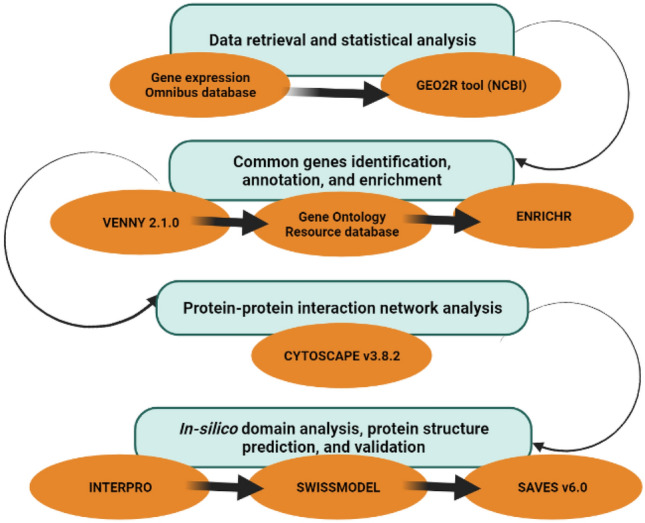
Flowsheet of methodology for the identification of common genes associated with BC and AD
Datasets and identification of DEGs from microarray datasets
The gene-expression patterns of BC patients were analyzed to identify DEGs (GSE42568) (Clarke et al. 2013). Samples from individuals with AD accounted for 467 of the total count, with the remaining 154 coming from HD (Huntington's disease) patients. There were 467 people; 135 were male AD sufferers, 123 male controls, 175 female AD sufferers, and 34 female controls. A total of 467 of these samples were subjected to examination as part of the research.
These data were analyzed using the GEO2R program, which was initially used to select the samples and assign them to a group. Benjamini–Hochberg correction was used on the analyzed data to eliminate the false discovery and then normalized using log transformation. LIMMA precision weights (Linear Models for Microarray Analysis) were also used further to evaluate the data (P < 0.01). The data were evaluated after all of these changes were made. BC control versus BC Grade 1; BC Control vs. BC Grade 2, BC Control vs. BC Grade 3, Female AD vs. Female Control, and Male AD vs. Male Control, respectively, were likewise selected as the plot presentations for these datasets to determine the DEGs for each dataset.
Gene ontology and enrichment study
The web tool Gene Ontology Resource (http://www.geneontological.org/) was utilized to undertake gene ontology research. Using VENNY 2.1.0, a program for producing Venn Diagrams, those genes were identified that were present in both sets of data and could be used to compare the two sets of data. The ENRICHR online tool was used to look for and assess enrichment in the identified common genes.
Protein–protein interaction analysis
Cytoscape v3.8.2 was used to examine the Protein–Protein Interaction (PPI) network of the target protein, MCM7, which was discovered using enrichment analysis (Otasek et al. 2019; Sriram and Sah 2021). The STRING plug-in of Cytoscape v3.8.2 was used to perform an automatic search for known interacting partners of the target protein under study using data from the STRING network database (Szklarczyk et al. 2019). Search parameters were configured as follows: confidence score (0.99), extra interactors (100), and smart delimiters (100) were used. The interactions between proteins were depicted using a network of nodes and edges. After importing the network into Cytoscape, each interacting node was visualized and exported as an image for further analysis.
In silico domain analysis and structure prediction of the target protein
The European Bioinformatics Institute (EBI) INTERPRO was used to conduct the protein domain analysis (Blum et al. 2021) after the extraction of the FASTA sequence from UniProt. The secondary structure of the protein was analyzed using PSIPRED (Buchan and Jones 2019) from the FASTA sequence to observe properties such as α-helix, β-sheet, turns, and coils (Buchan and Jones 2019), followed by the prediction of phosphorylation sites using the NetPhos 3.1 webserver (https://www.cbs.dtu.dk/services/NetPhos/). 3D homology modeling was performed using SWISS-MODEL (Adamus et al. 2020) to validate pre-existing structures from RCSB PDB (Berman et al. 2000) and to observe various reactive amino acid groups. The predicted model was validated using the MolProbity tool of SWISS-MODEL (Adamus et al. 2020).
Results and discussion
Identification of DEGs
Understanding the biological variations between healthy and diseased states requires understanding the differential gene expression. Microarray experimental data and biological literature are two significant differential gene-expression data sources. According to the microarray results, there were 4091 significant DEGs in BC Grade 1, 6548 significant DEGs in BC Grade 2, and 7081 significant DEGs in BC Grade 3, as well as only 5 significant DEGs in the AD dataset. The volcano plots of these four conditions vs. their corresponding controls were generated after the statistical analysis using NCBI's GEO2R tools (Fig. 2).
Fig. 2.

Volcano plots of DEGs between BC grade 1 (A), grade 2 (B), grade 3, and (C) normal BC tissue. Volcano plot of DEGs between AD and normal brain tissues (D). Red dots signify upregulated genes in BC tissues; blue dots signify downregulated genes in BC tissues; gray dots depict not significantly expressed genes. Adj. P < 0.01 was considered to indicate a statistically significant difference
After obtaining the list of various DEGs either upregulating or downregulating, screening out those genes specific to the diseases under study is imperative. The genes of interest were retrieved and analyzed from the volcano plot using Venny 2.1.0 to identify the common genes in all selected disease conditions (Fig. 3, Table 1). The results of Venny concluded with only two common genes (CD209 and MCM7) overlapping in both the selected diseased states. For CD209, previous reports are available for its role in AD (Walker and Lue 2015) as well as in BC (Szpor et al. 2021). However, for MCM7, there are only a few recent reports associating it with BC (Zhang and Yan 2015; Liang et al. 2017). There are no reports on MCM7 links with AD that could have provided the key for drug targeting and repurposing.
Fig. 3.
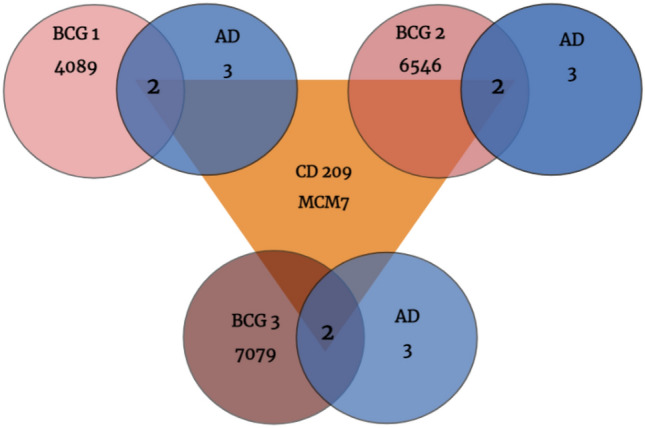
Venn diagram of overlapping DEGs from the GSE42568 (BC grade 1, grade 2, and grade 3) and GSE330000 datasets (AD)
Table 1.
Fold change and F value of common genes
| Gene symbol | Gene title | Log2(fold change) | F value | ||||||
|---|---|---|---|---|---|---|---|---|---|
| BCG1 | BCG2 | BCG3 | AD | BCG1 | BCG2 | BCG3 | AD | ||
| MCM7 | Minichromosome Maintenance Complex Component 7 | − 0.176 | − 0.149 | − 0.207 | 0.399 | 3.471 | 3.908 | 7.155 | 6.407 |
| CD209 | CD209 molecule | 0.917 | 0.862 | 0.844 | 0.366 | 16.766 | 23.925 | 24.647 | 9.523 |
Gene enrichment analysis was performed to identify classes of genes over-represented in a large set of genes associated with the characteristics of diseases under study. MCM7 enrichment analysis with pathway databases (Table 2) revealed the initiation of DNA replication with both the R-HSA-176974 and R-HSA-69306 pathways associated with the expression of the MCM7 gene. Similarly, the investigation into the network pathways of S-phase transitions (R-HSA-69242), G2/M checkpoints (R-HSA-69481), and G1/S transitions (R-HSA-69206) corroborated with the previous findings mentioned above. Thus, after establishing the gene enrichment, it was necessary to analyze the gene annotation to correctly identify its structural and functional aspects before further investigating and analyzing the translated protein.
Table 2.
Gene annotation for biological process of MCM7 (Gene Ontology Resource)
| Category | GO ID | Term | P value |
|---|---|---|---|
| Biological process | GO:1902299 | Pre-replicative complex assembly involved in cell cycle DNA replication | 0.000437 |
| GO:0006267 | Pre-replicative complex assembly involved in nuclear cell cycle DNA replication | 0.000437 | |
| GO:0000727 | Double-strand break repair via break-induced replication | 0.000631 | |
| GO:0006268 | DNA unwinding is involved in DNA replication | 0.000825 | |
| GO:0006271 | DNA strand elongation involved in DNA replication | 0.000971 | |
| GO:0022616 | DNA strand elongation | 0.00121 | |
| GO:0006270 | DNA replication initiation | 0.00214 | |
| GO:0071364 | Cellular response to epidermal growth factor stimulus | 0.00223 | |
| GO:0070849 | Response to epidermal growth factor | 0.00243 | |
| GO:0033260 | Nuclear DNA replication | 0.00286 | |
| GO:0044786 | Cell cycle DNA replication | 0.00291 | |
| GO:0036388 | Pre-replicative complex assembly | 0.0032 | |
| GO:0000724 | Double-strand break repair via homologous recombination | 0.00495 | |
| GO:0000725 | recOmbinational repair | 0.00505 | |
| GO:0032508 | DNA duplex unwinding | 0.0052 | |
| GO:0032392 | DNA geometric change | 0.00554 | |
| GO:0000082 | G1/S transition of mitotic cell cycle | 0.00612 | |
| GO:0044843 | Cell cycle G1/S-phase transition | 0.00621 | |
| GO:0071466 | Cellular response to xenobiotic stimulus | 0.00631 | |
| GO:0009410 | Response to xenobiotic stimulus | 0.00665 | |
| GO:0006261 | DNA-dependent DNA replication | 0.00947 | |
| GO:0006302 | Double-strand break repair | 0.00986 | |
| GO:0006310 | DNA recombination | 0.0109 | |
| GO:0065004 | Protein-DNA complex assembly | 0.0124 | |
| GO:0006260 | DNA replication | 0.0132 | |
| GO:0044772 | Mitotic cell cycle phase transition | 0.0139 | |
| GO:0044770 | Cell cycle phase transition | 0.0143 | |
| GO:0071824 | Protein-DNA complex subunit organization | 0.0143 | |
| GO:0071103 | DNA conformation change | 0.0152 | |
| GO:0042493 | Response to drug | 0.0186 | |
| GO:0008283 | Cell population proliferation | 0.0232 | |
| GO:0071363 | Cellular response to growth factor stimulus | 0.0245 | |
| GO:0006281 | DNA repair | 0.0258 | |
| GO:0070848 | Response to growth factor | 0.0259 | |
| GO:1903047 | Mitotic cell cycle process | 0.0333 | |
| GO:0000278 | Mitotic cell cycle | 0.037 | |
| GO:0006259 | DNA metabolic process | 0.038 | |
| GO:0006974 | Cellular response to DNA damage stimulus | 0.0383 | |
| GO:0034622 | Cellular protein-containing complex assembly | 0.0418 | |
| Molecular function | GO:1990518 | Single-stranded 3'–5' DNA helicase activity | 0.000243 |
| GO:0043138 | 3'–5' DNA helicase activity | 0.000874 | |
| GO:0017116 | Single-stranded DNA helicase activity | 0.000971 | |
| GO:0003688 | DNA replication origin binding | 0.00117 | |
| GO:0003678 | DNA helicase activity | 0.00369 | |
| GO:0003697 | Single-stranded DNA binding | 0.00578 | |
| GO:0004386 | Helicase activity | 0.00777 | |
| GO:0140097 | Catalytic activity, acting on DNA | 0.0103 | |
| GO:0016887 | ATPase activity | 0.0237 | |
| GO:0017111 | Nucleoside-triphosphatase activity | 0.042 | |
| GO:0016462 | Pyrophosphatase activity | 0.0447 | |
| GO:0016818 | Hydrolase activity, acting on acid anhydrides, in phosphorus-containing anhydrides | 0.0448 | |
| GO:0016817 | Hydrolase activity, acting on acid anhydrides | 0.0448 | |
| Cellular component | GO:0071162 | CMG complex | 0.000534 |
| GO:0031261 | DNA replication pre-initiation complex | 0.000631 | |
| GO:0042555 | MCM complex | 0.000631 | |
| GO:0000781 | Chromosome, telomeric region | 0.00728 | |
| GO:0032993 | Protein-DNA complex | 0.00869 | |
| GO:0000228 | Nuclear chromosome | 0.0111 | |
| GO:0098687 | Chromosomal region | 0.0163 |
Gene annotation for identifying gene location and coding sections provides insight into genes' accomplishment in cellular and body functions by establishing proteins' structural and functional roles. An analysis of the annotations for MCM7 revealed its involvement in biological processes such as cell division (GO:0000278) and DNA replication (GO:0006260); molecular functions such as DNA replication initiation (GO:1990518); and cellular compartments as the protein–DNA complex (GO:0032993), DNA replication pre-initiation complex (GO: 0031261), and a component of nuclear chromosomes (GO:0000228) (Table 3). The annotation result concluded that MCM7 appears to have a ubiquitous role in maintaining DNA replication and other significant cellular processes.
Table 3.
Gene enrichment analysis of MCM7
| Term | Adjusted p value | Associated genes |
|---|---|---|
| DNA Replication (hsa03030) | 5.68 × 10–43 | RFC5;PRIM2;FEN1;RFC3;PCNA;RFC4;MCM7;PRIM1;RPA1;RPA2;POLA1;POLA2;RPA3;POLE2;MCM3;MCM4;MCM5;MCM6;POLE;MCM2 |
| Cell Cycle (hsa04110) | 4.31 × 10–39 | PCNA;MCM7;CDC7;CDC6;CCNA2;ORC5;CCNA1;ORC4;DBF4;ORC6;CDC45;ORC1;CCNE1;ORC3;CHEK1;ORC2;CDK2;MCM3;E2F1;CDK1;MCM4;MCM5;MCM6;MCM2 |
| Nucleotide excision repair (hsa03420) | 4.02 × 10⁻¹⁴ | RFC5;RFC3;PCNA;RFC4;RPA3;POLE2;RPA1;RPA2;POLE |
| Mismatch repair (hsa03430) | 1.19 × 10⁻¹² | RFC5;RFC3;PCNA;RFC4;RPA3;RPA1;RPA2 |
| Cellular Senescence (hsa04218) | 1.39 × 10⁻⁶ | CCNA2;CCNA1;CCNE1;CHEK1;CDK2;E2F1;CDK1 |
| Base Excision Repair (hsa03410) | 1.07 × 10⁻⁵ | FEN1;PCNA;POLE2;POLE |
| Homologous Recombination (hsa03440) | 1.95 × 10⁻⁵ | RPA3;RPA1;RPA2;TOPBP1 |
| Hepatitis B (hsa05161) | 1.95 × 10⁻⁵ | CCNA2;CCNA1;PCNA;CCNE1;CDK2;E2F1 |
| Viral Carcinogenesis (hsa05203) | 5.78 × 10⁻⁵ | CCNA2;CCNA1;CCNE1;CHEK1;CDK2;CDK1 |
| Human T-Cell Leukemia Virus 1 infection (hsa05166) | 8.45 × 10⁻⁵ | CCNA2;CCNA1;CCNE1;CHEK1;CDK2;E2F1 |
| DNA Replication R-HSA-69306 | 6.98 × 10–89 | PRIM2;FEN1;PCNA;MCM7;MCM8;PRIM1;GMNN;MCM10;ORC5;ORC4;ORC6;CDC45;ORC1;ORC3;ORC2;E2F1;POLE;RFC5;GINS1;GINS2;CDT1;RFC3;RFC4;GINS3;GINS4;RPA1;RPA2;CDC7;CDC6;CCNA2;CCNA1;POLA1;POLA2;DBF4;POLE2;RPA3;CDK2;MCM3;MCM4;MCM5;MCM6;MCM2 |
| Activation of the pre-replicative complex R-HSA-68962 | 7.20 × 10–77 | PRIM2;MCM7;MCM8;PRIM1;MCM10;ORC5;ORC4;ORC6;CDC45;ORC1;ORC3;ORC2;POLE;CDT1;RPA1;RPA2;CDC7;CDC6;POLA1;POLA2;DBF4;RPA3;POLE2;CDK2;MCM3;MCM4;MCM5;MCM6;MCM2 |
| Synthesis of DNA R-HSA-69239 | 6.59 × 10–76 | PRIM2;FEN1;PCNA;MCM7;MCM8;PRIM1;ORC5;ORC4;ORC6;CDC45;ORC1;ORC3;ORC2;POLE;RFC5;GINS1;GINS2;CDT1;RFC3;RFC4;GINS3;GINS4;RPA1;RPA2;CDC6;CCNA2;CCNA1;POLA1;POLA2;POLE2;RPA3;CDK2;MCM3;MCM4;MCM5;MCM6;MCM2 |
| S-phase R-HSA-69242 | 4.84 × 10–74 | PRIM2;FEN1;PCNA;MCM7;MCM8;PRIM1;ORC5;ORC4;ORC6;CDC45;ORC1;ORC3;ORC2;POLE;RFC5;GINS1;GINS2;CDT1;RFC3;RFC4;GINS3;GINS4;RPA1;RPA2;CDC6;CCNA2;CCNA1;POLA1;POLA2;CCNE1;POLE2;RPA3;CDK2;MCM3;MCM4;MCM5;MCM6;MCM2 |
| G1/S Transition R-HSA-69206 | 1.01 × 10–67 | PRIM2;PCNA;MCM7;MCM8;PRIM1;MCM10;ORC5;ORC4;ORC6;CDC45;ORC1;ORC3;ORC2;E2F1;POLE;CDT1;RPA1;RPA2;CDC7;CDC6;CCNA2;CCNA1;POLA1;POLA2;DBF4;CCNE1;POLE2;RPA3;CDK2;MCM3;CDK1;MCM4;MCM5;MCM6;MCM2 |
| Cell Cycle R-HSA-1640170 | 6.16 × 10–65 | PRIM2;FEN1;PCNA;MCM7;MCM8;PRIM1;GMNN;MCM10;ORC5;ORC4;ORC6;CDC45;ORC1;ORC3;CHEK1;ORC2;E2F1;TOPBP1;POLE;RFC5;GINS1;GINS2;CDT1;RFC3;RFC4;GINS3;GINS4;RPA1;RPA2;CDC7;CDC6;CCNA2;CCNA1;POLA1;POLA2;DBF4;CCNE1;POLE2;RPA3;CDK2;MCM3;CDK1;MCM4;MCM5;MCM6;MCM2 |
| Mitotic G1-G1/S phases R-HSA-453579 | 2.03 × 10–64 | PRIM2;PCNA;MCM7;MCM8;PRIM1;MCM10;ORC5;ORC4;ORC6;CDC45;ORC1;ORC3;ORC2;E2F1;POLE;CDT1;RPA1;RPA2;CDC7;CDC6;CCNA2;CCNA1;POLA1;POLA2;DBF4;CCNE1;POLE2;RPA3;CDK2;MCM3;CDK1;MCM4;MCM5;MCM6;MCM2 |
| Cell Cycle, Mitotic R-HSA-69278 | 2.91 × 10–64 | PRIM2;FEN1;PCNA;MCM7;MCM8;PRIM1;GMNN;MCM10;ORC5;ORC4;ORC6;CDC45;ORC1;ORC3;ORC2;E2F1;POLE;RFC5;GINS1;GINS2;CDT1;RFC3;RFC4;GINS3;GINS4;RPA1;RPA2;CDC7;CDC6;CCNA2;CCNA1;POLA1;POLA2;DBF4;CCNE1;POLE2;RPA3;CDK2;MCM3;CDK1;MCM4;MCM5;MCM6;MCM2 |
| DNA Replication pre-initiation R-HSA-69002 | 1.98 × 10–62 | PRIM2;MCM7;MCM8;PRIM1;GMNN;MCM10;ORC5;ORC4;ORC6;CDC45;ORC1;ORC3;ORC2;E2F1;POLE;CDT1;RPA1;RPA2;CDC7;CDC6;POLA1;POLA2;DBF4;POLE2;RPA3;CDK2;MCM3;MCM4;MCM5;MCM6;MCM2 |
| M/G1 Transition R-HSA-68874 | 1.98 × 10–62 | PRIM2;MCM7;MCM8;PRIM1;GMNN;MCM10;ORC5;ORC4;ORC6;CDC45;ORC1;ORC3;ORC2;E2F1;POLE;CDT1;RPA1;RPA2;CDC7;CDC6;POLA1;POLA2;DBF4;POLE2;RPA3;CDK2;MCM3;MCM4;MCM5;MCM6;MCM2 |
Protein–protein interaction analysis
Regulating the erroneous expression at the genetic level is impossible without using advanced tools such as CRISPR. However, the regulation of the protein expression using modern small molecule inhibitors or designer peptides is possible directly (Nagamalla and Kumar 2021). Thus, it is more practical to establish a protein as a drug target rather than a gene. Hence, the present study attempted a comprehensive bioinformatics approach for establishing MCM7 as a potential drug target for AD. In biological systems, metabolic or biochemical processes are seldom regulated by a solo protein and instead are regulated by a cascade of effector molecules working in tandem with each other. The analysis of the network cascade further indicates various primary and secondary interactions of MCM7 with other effector molecules and can provide suitable therapeutic alternatives if MCM7 is undruggable. CYTOSCAPEv3.8.2 was used to create this network, which was imported from the STRING database after identifying the common genes. The network was constructed with high confidence (> 90%). Cytoscape's investigation of the MCM7 PPI network revealed 51 nodes and 363 edges. Each node represents a single protein in this network diagram, and the edges show interactions among those proteins. The lookout for theMCM7's interacting proteins in Fig. 4A settled with direct interaction with 35 other proteins and 15 proteins indirectly. Table 4 elucidates the cellular roles of the MCM7 protein's interacting partners along with disease prognosis in AD. Figure 4B visualizes the protein–protein interaction (PPI) network of MCM7 obtained using Cytoscape v3.8.2. Nodes represent the proteins, and the edges represent the interactions among them. The orange octagonal node illustrates the protein of interest selected as the central hub. Green nodes portray the closely associated proteins (undirected) of MCM7 protein. The parameters used for constructing this PPI network were the highest confidence score (0.99), maximum additional interactors (100), and smart delimiters.
Fig. 4.

A Protein–protein interaction (PPI) network of MCM7 obtained using Cytoscape v3.8.2. Purple nodes signify the proteins interacting indirectly with MCM7 B PPI network between MCM7 and its first neighbors (undirected)
Table 4.
Description of cellular functions of all the proteins associated with the PPI network of MCM7
| Gene | Function | References |
|---|---|---|
| GINS complex (GINS1,GINS2, GINS3,GINS4) |
Composed of four genes, GINS1-4 involved in initiation of DNA replication and progression of replication forks CIZ1 (CDKN1A-interacting zinc-finger protein 1), a downstream target for the GINS complex during the pre-replication complex formation highly expressed in AD tissues |
Kamada et al. (2007) |
| CDT1 (DNA replication factor Cdt1) | Cooperates with CDC6 and origin recognition complexes during G1 phase to load MCMs onto DNA to give pre-replication complex | Cook et al. (2004) |
| Replication Factor C (RFC3,RFC4, RFC5) | Replication factor C (RFC), a pentameric AAA + ATPase complex made up of RFC1–5, transports PCNA to primer–template junctions | Yao and O'Donnell (2012) |
| Replication protein A (RPA1,RPA2, RPA3) |
Binds and stabilizes single-stranded DNA intermediates formed during DNA replication or stress as part of the heterotrimeric replication protein A complex (RPA/RP-A) Prevents reannealing while also recruiting and activating various proteins and complexes involved in DNA metabolism |
(Bass et al. 2016) |
| Minichromosome Maintenance Complex (MCM2,MCM3,MCM4,MCM5,MCM6,MCM7,MCM8,MCM10,MCMBP) |
Hexameric helicase MCM2-7 required to unwind dsDNA to generate the ssDNA template for DNA replication MCM8 and MCM10 not part of the hexameric complex, and MCMBP is the binding protein Phosphorylated MCM2 protein reported being associated with neurofibrillary tangles in AD |
Chang et al. (2019) Bonda et al. (2009) |
| Origin Recognition Complex (ORC1,ORC2,ORC3,ORC4,ORC5,ORC6) |
In eukaryotes, the six-subunit origin recognition complex (ORC) binds to DNA to mark the site for replication initiation ORC subunits take part in the regulation of cognitive functions and neuronal plasticity |
Li et al. (2018) Arendt and Brückner (2007) |
| Cyclin A1 and Cyclin A2 (CCNA1,CCNA2) | The canonical cyclin A, known as cyclin A2, required for DNA replication and mitosis, found in almost all cell types. Cyclin A1, the second A cyclin family member, is only expressed in germline cells | Radonova et al. (2020) |
| Cell Division Control proteins (CDC6, CDC7,CDC45) | Code for the proteins required for initiation of DNA replication | Carbon et al. (2021) |
| Cyclin dependent Kinases (CDK1, CDK2) | Modulating the centrosome cycle and mitotic onset controls the eukaryotic cell cycle, promotes G2–M transition, and regulates G1 progress and G1-S transition via association with multiple interphase cyclins. Higher cells require it to enter S-phase and mitosis. CDK1 acts at the G1–S transition to promote the E2F transcriptional program and the start of DNA synthesis, and modulates G2 progression; controls the timing of mitosis/meiosis entry by controlling the subsequent activation of cyclin B/CDK1 by phosphorylation, and coordinates cyclin B/CDK1 activation at the centrosome and in the nucleus | Mori et al. (2015), Jassal et al. )2020) |
| DNA Primase (PRIM1, PRIM2) | Catalytic PRIM1 and regulatory PRIM2 subunits of DNA primase complex and also part of DNA polymerase Alpha complex. Key role in the initiation of synthesis of DNA | Weiner et al. (2007) |
| DNA Polymerase (POLA1, POLA2, POLE, POLE2) |
POLA1 and POLA2 are the catalytic and accessory subunits of DNA polymerase alpha complex, whereas POLE and POLE2 are the catalytic and accessory components of DNA polymerase epsilon. POLA1 and POLA2 involved in DNA replication; POLE and POLE2 involved in DNA repair Deficiency in DNA polymerase leads to reduced synaptic elasticity and neuronal degeneration resulting in AD |
Starokadomskyy et al. (2016), Taylor and Yeeles (2019), Dodd et al. (2020) Sykora et al. (2015) |
| Protein DBF4 homolog A (DBF4) | Involved in S-phase progression and regulation of DNA replication initiation | Almawi et al. (2020) |
| Proliferating Cell Nuclear Antigen (PCNA) |
Codes for the auxiliary protein of DNA polymerase delta regulate eukaryotic DNA replication by increasing the polymerase's processability during leading-strand elongation PCNA expression levels elevate and decline sequentially in response to AD stimuli in vitro |
Kulkarni et al. (2020) Hernández-Ortega et al. (2007) |
| TIMELESS- interacting protein (TIPIN) | Plays an essential role in regulating DNA replication and the stability of replication forks. It is critical for cell survival following DNA damage or replication stress | Rageul et al. (2020) |
| G1/S-specific Cyclin E1(CCNE1) | Involved in the control of cell cycle during G1/S transition | Lepage et al. (2021) |
| Microtubule associated protein RP/EB family member 2(MAPRE2) | Key role in the progression of mitosis and regulation of cell adhesion | Thues et al. (2021) |
| Leucine-rich repeat and WD repeat-containing protein 1(LRWD1) | Involved in G1/S transition. Recruits and stabilizes the ORC onto chromatin during G1 to establish the pre-replication complex (preRC) and to heterochromatic sites in post-replicated cells | Chan and Zhang (2012) |
| Transcription Factor E2F1 (E2F1) | Found in promoter regions of most of the genes involved in cell cycle regulation or DNA replication | Manickavinayaham et al. (2019) |
| Geminin (GMNN) | Inhibits DNA replication by not allowing the MCM complex to incorporate into the pre-replication complex | Sami et al. (2021) |
| DNA topoisomerase 2-binding protein 1(TOPBP1) | Role in the resumption of stalled replication forks and the control of checkpoints, Binds both dsDNA and ssDNA breaks and nicks | Mooser et al. (2020) |
| Serine/threonine-protein kinase Chk1(CHEK1) | Involved in checkpoint-mediated cell cycle arrest and activating DNA repair in response to DNA damage or unreplicated DNA | Chao et al. (2020) |
| Cyclin-L1(CCNL1) | Involved in splicing of pre-mRNA and acts in association with cyclin-dependent kinases | Ameur et al. (2020) |
| Flap endonuclease 1 (FEN1) | Possesses both exonuclease and endonuclease activity and is involved in DNA replication and repair | Williams et al. (2021) |
In silico domain analysis and secondary structure prediction of MCM7
After successfully validating MCM7 as a genetic component with an aberrant expression profile responsible for the occurrence of cancer and Alzheimer's, it is important to evaluate its structure and physicochemical properties to propose its viability as a potential drug target. To that end, MCM7's FASTA sequence was first extracted from UniProt for an in silico proteomic study of MCM7 (The UniProt Consortium 2021). This FASTA sequence was then sent into the EBI INTERPRO as a query to look for any recognized domains, conserved sites, or motifs (Blum et al. 2021). From the data obtained through InterPro, the major domains and their positions in the protein sequence are as follows: MCM_N (MCM-N-terminal domain) (10–139), MCM_OB (oligonucleotide/oligosaccharide binding fold) (149–278), MCM_dom (322–541), MCM_2 (332–537), AAA + _ATPase (373–526) (ATPases associated with diverse cellular activities) (Abid Ali and Costa 2016), and MCM_lid (558–640) (Mistry et al. 2021). The protein's secondary structure was analyzed using PSIPRED (Buchan and Jones 2019) from the FASTA sequence to observe properties such as α-helix, β-sheet, turns, and coils (Fig. 5). Figure S1A–C of the supplemental datasheet includes results from further analysis of data collected from PSIPRED on the reactive nature of the constituent amino acids and their unique characteristics. These data when collectively taken into account help to determine protein secondary structure, detailing physicochemical nature, and guide for the next step for building a computational three-dimensional model of the MCM7.
Fig. 5.

Secondary structure prediction of MCM7 protein. The pink band shows the positioning of the helix, and the yellow band indicates the strand
Furthermore, NetPhos 3.1, a web server, predicted phosphorylation sites on MCM7 based on its amino acid sequence. Phosphorylation is known to change the conformation of the protein’s binding site, which can severely impede ligand interactions (Smith et al. 2015). It guides the researcher to avoid these sites while creating ligand-binding pockets for virtual screening. Furthermore, the mapping of phosphorylation sites is a crucial step in identifying signaling pathways and developing kinase inhibitors as anti-cancer agents (Gagic et al. 2020). There is currently no evidence for the MCM7 phosphorylation affecting disease prognosis; however, the reports on MCM2 phosphorylation (subunit of hexameric MCM complex) induce neurofibrillary tangles in AD tissues (Bonda et al. 2009) are available. The confidence score was set to 0.9 out of 1 to only obtain results with the highest probability of occurrence. The result is represented as Fig. 6. The fragments highlighted in yellow represent individual phosphorylation sites, while the peaks in the graph represent the probability of occurrence of phosphorylation sites as compared to the threshold value (0.9).
Fig. 6.

Position-dependent feature predictions mapping. A Each phosphorylation site on the MCM7 proteins and its corresponding amino acid sequence along with statistical significance. B Highlighted sections indicate the phosphorylation sites present in the target protein sequence. Note that specific phosphorylation sites overlap with one another. C The peak height of the phosphorylation features reflects the confidence of the residue prediction
Protein modeling and validation of predicted structures
After the characterization of MCM7 using the parameter of secondary structure, the next step involved the prediction of its three-dimensional model. This 3D model could be utilized to test the small molecule compounds as inhibitors or design-specific peptide sequences. Structurally similar proteins were investigated using BLASTp with a database from Protein Data Bank (PDB) as the search set for homology modeling. Only those proteins with sequence similarity over the 80% threshold as the minimum requirement for homology modeling were selected from the BLAST search results. One crystal structure present in PDB (PDB ID: 6XTX) demonstrated 100% similarity with the input FASTA sequence of MCM7 protein. The previous research on MCM7, which exists in the MCM-CMG complex, has not accounted for the missing residues in the isolated MCM7 3D structure from PDB (Ahammad et al. 2021; Alshahrani et al. 2021). Here, an attempt further to provide a more accurate model of the same with SWISS MODEL's homology protein modeling service using the crystal structure 6XTX as a template. The “degree of nativeness” of the model's structural characteristics is estimated using the QMEAN Z-score globally. It is used to evaluate whether the model's QMEAN score obtained is in support of experimental structures of similar sizes of proteins. GMQE (Global Model Quality Estimate) is a quality estimate which combines properties from the target-template alignment and the template structure. The average per-residue score has been found to correlate well with the LDDT (Local Distance Difference Test) score. This superposition-free score evaluates the local distance of all atoms in a model, including validation of stereochemical probability. The provided error estimate (Fig. 7A) is based on QMEANDisCo global scores calculated for a diverse set of similar models and represents the standard deviation from the respective LDDT scores (Benkert et al. 2008). A QMEAN Z-score of nearly zero indicates that the modeled structure outperforms the experimental structure in terms of quality. At the same time, a score of − 4.0 or below is considered a poor quality of the predicted model. For the present study, the QMEAN Z-score of the MCM7 predicted model was -2.46, suggesting that the homology model is reliable and close to fact. Figure 7A, B shows the homolog model that was expected. Figure S2A–C in the supplemental datasheet shows the results of further analyses of the protein model's characteristics. To verify the MCM7 protein 3D model obtained, the Ramachandran plot was generated with the MolProbity tool. The model was validated with the occurrence of almost all the amino acid residues within the confinement of permissible regions (Fig. 8). The MolProbity score of the MCM7 protein was 99.22% of the residues were in the permissible region, while only 0.78% of the residues lay in the outlier regions. The scores obtained satisfactorily validated the predicted model.
Fig. 7.

A Illustration of “degree of nativeness” of the model's structural characteristics using the QMEAN Z-score on a global scale. Cβ describes the confidence score for predicting beta carbons orientation in the side chains of the MCM7 protein. Solvation potential describes the burial status of the residues. Torsion describes the confidence score for predicting torsion angles in the protein structure. B, C 3D representation of predicted MCM7 protein model based on QMEAN parameter generated using SWISS-MODEL. B represents the molecular surface structure, and C represents the thread-ribbon structure. The color depiction is as follows: Orange = low confidence prediction/low QMEAN score/low sequence similarity with template structure, Purple = moderate confidence prediction/moderate QMEAN score/moderate sequence similarity with template structure, Blue = high confidence prediction/high QMEAN score/high sequence similarity with template structure
Fig. 8.
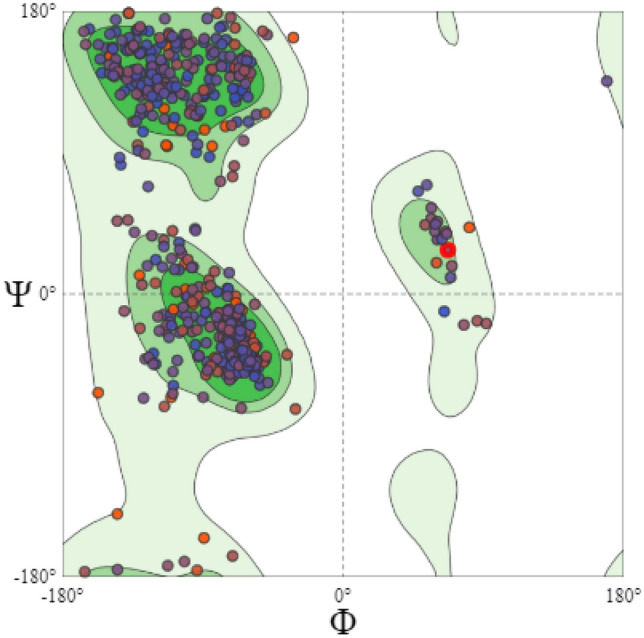
Validation of predicted structure of MCM7 protein with Ramachandran Plot using SWISS-MODEL MolProbity Tool. The colored dots confined within the bright green, light green, and pale green areas represent the presence of all residues of the predicted MCM7 model in allowed regions, and no residues present in the disallowed region are represented as blank areas
Conclusion and future prospects
The study reveals the elevated expression of MCM7 in AD which is downregulated in all the three grades of BC. The role of this gene in DNA replication and the advancement of the cell cycle is altered in diseased conditions under study. A change in the structure or folding of a subsequently translated MCM7 protein due to a mutation in its genetic code might influence DNA replication and cell cycle progression. This subsequently increases the likelihood of cellular aberrations such as the incidence of cancer and changes in protein structure or folding in AD. Upon reviewing the PDB structure, there appear to be several gaps or incomplete sites in the protein structure with unmodelled residues between them. Therefore, this present study will help bridge the gap between this structure inconsistencies and motivate future attempts to ensure complete modeling of MCM7 for aid in drug design and other therapeutic purposes. This would lead to widening of chemotherapy for AD, shortening/lessening the time, effort, and cost involved for novel drugs and toxicological research. These findings further pave the way for drug repurposing studies to check the effect of pre-existing FDA-approved drugs for BC used for rectifying the expression levels of the mutated MCM7 gene in AD.
Supplementary Information
Below is the link to the electronic supplementary material.
Acknowledgements
The authors extend gratitude toward the MHRD (Govt. of India) for the financial support to the first and second author.
Author contributions
All authors contributed to the study conception and design. Experimental design, data collection, and analysis were performed by NS, SM, and MKS. The first draft of the manuscript was written by NS and completed with SM. All co-authors commented on the previous version of the manuscript for the revisions. Finally, all authors read and approved the manuscript for the revisions.
Funding
The authors declare that no funds, grants, or other financial support were received for the preparation of this manuscript.
Declarations
Conflict of interest
The authors have no relevant financial or non-financial interests to disclose.
Ethics approval
No ethical approval is required.
Footnotes
Navneeth Sriram and Sunny Mukherjee have contributed equally.
Contributor Information
Navneeth Sriram, Email: navneeths.bt.19@nitj.ac.in.
Sunny Mukherjee, Email: sunnym.bt.20@nitj.ac.in.
Mahesh Kumar Sah, Email: sahmk@nitj.ac.in.
References
- Abid Ali F, Costa A. The MCM helicase motor of the eukaryotic replisome. J Mol Biol. 2016;428:1822–1832. doi: 10.1016/j.jmb.2016.01.024. [DOI] [PubMed] [Google Scholar]
- Adamus M, Lelkes E, Potesil D, et al. Molecular Insights into the Architecture of the Human SMC5/6 Complex. J Mol Biol. 2020;432:3820–3837. doi: 10.1016/j.jmb.2020.04.024. [DOI] [PubMed] [Google Scholar]
- Ahammad F, Alam R, Mahmud R, et al. Pharmacoinformatics and molecular dynamics simulation-based phytochemical screening of neem plant (Azadiractha indica) against human cancer by targeting MCM7 protein. Briefings Bioinform. 2021;22:bbab098. doi: 10.1093/bib/bbab098. [DOI] [PubMed] [Google Scholar]
- Almawi AW, Langlois-Lemay L, Boulton S, et al. Distinct surfaces on Cdc5/PLK Polo-box domain orchestrate combinatorial substrate recognition during cell division. Sci Rep. 2020;10:3379. doi: 10.1038/s41598-020-60344-4. [DOI] [PMC free article] [PubMed] [Google Scholar]
- Alshahrani MY, Alshahrani KM, Tasleem M, et al. Computational Screening of natural compounds for identification of potential anti-cancer agents targeting MCM7 protein. Molecules. 2021;26:5878. doi: 10.3390/molecules26195878. [DOI] [PMC free article] [PubMed] [Google Scholar]
- Ameur LB, Marie P, Thenoz M, et al. Intragenic recruitment of NF-κB drives splicing modifications upon activation by the oncogene Tax of HTLV-1. Nat Commun. 2020;11:3045. doi: 10.1038/s41467-020-16853-x. [DOI] [PMC free article] [PubMed] [Google Scholar]
- Ansari SMR, Hijazi FS, Souchelnytskyi S. Targeted and systemic insights into the crosstalk between DNA-dependent protein kinase catalytic subunit and receptors of estrogen, progesterone and epidermal growth factor in the context of cancer. Mol Biol Rep. 2021 doi: 10.1007/s11033-021-06797-w. [DOI] [PubMed] [Google Scholar]
- Arendt T, Brückner MK. Linking cell-cycle dysfunction in Alzheimer’s disease to a failure of synaptic plasticity. Biochimica et Biophysica Acta (BBA) Mol Basis Dis. 2007;1772:413–421. doi: 10.1016/j.bbadis.2006.12.005. [DOI] [PubMed] [Google Scholar]
- Bagyinszky E, Youn YC, An SSA, Kim S. The genetics of Alzheimer’s disease. Clin Interv Aging. 2014;9:535–551. doi: 10.2147/CIA.S51571. [DOI] [PMC free article] [PubMed] [Google Scholar]
- Barrett T, Wilhite SE, Ledoux P, et al. NCBI GEO: archive for functional genomics data sets—update. Nucleic Acids Res. 2013;41:D991–D995. doi: 10.1093/nar/gks1193. [DOI] [PMC free article] [PubMed] [Google Scholar]
- Bass TE, Luzwick JW, Kavanaugh G, et al. ETAA1 acts at stalled replication forks to maintain genome integrity. Nat Cell Biol. 2016;18:1185–1195. doi: 10.1038/ncb3415. [DOI] [PMC free article] [PubMed] [Google Scholar]
- Benkert P, Tosatto SCE, Schomburg D. QMEAN: a comprehensive scoring function for model quality assessment. Proteins. 2008;71:261–277. doi: 10.1002/prot.21715. [DOI] [PubMed] [Google Scholar]
- Blum M, Chang H-Y, Chuguransky S, et al. The InterPro protein families and domains database: 20 years on. Nucleic Acids Res. 2021;49:D344–D354. doi: 10.1093/nar/gkaa977. [DOI] [PMC free article] [PubMed] [Google Scholar]
- Bonda DJ, Evans TA, Santocanale C, et al. Evidence for the progression through S-phase in the ectopic cell cycle re-entry of neurons in Alzheimer disease. Aging (Albany NY) 2009;1:382–388. doi: 10.18632/aging.100044. [DOI] [PMC free article] [PubMed] [Google Scholar]
- Buchan DWA, Jones DT. The PSIPRED protein analysis workbench: 20 years on. Nucleic Acids Res. 2019;47:W402–W407. doi: 10.1093/nar/gkz297. [DOI] [PMC free article] [PubMed] [Google Scholar]
- Carbon S, Douglass E, Good BM, et al. The Gene Ontology resource: enriching a GOld mine. Nucleic Acids Res. 2021;49:D325–D334. doi: 10.1093/nar/gkaa1113. [DOI] [PMC free article] [PubMed] [Google Scholar]
- Chan KM, Zhang Z. Leucine-rich Repeat and WD repeat-containing protein 1 is recruited to pericentric heterochromatin by trimethylated lysine 9 of histone H3 and maintains heterochromatin silencing. J Biol Chem. 2012;287:15024–15033. doi: 10.1074/jbc.M111.337980. [DOI] [PMC free article] [PubMed] [Google Scholar]
- Chang C-W, Li M, Xu X, Liu Y. Chapter 11—helicase dysfunctions in human diseases. In: Tuteja R, editor. Helicases from all domains of life. Academic Press; 2019. pp. 191–210. [Google Scholar]
- Chao H-H, Karagounis IV, Thomas C, et al. Combination of CHEK1/2 inhibition and ionizing radiation results in abscopal tumor response through increased micronuclei formation. Oncogene. 2020;39:4344–4357. doi: 10.1038/s41388-020-1300-x. [DOI] [PMC free article] [PubMed] [Google Scholar]
- Chase JG, Preiser J-C, Dickson JL, et al. Next-generation, personalised, model-based critical care medicine: a state-of-the art review of in silico virtual patient models, methods, and cohorts, and how to validation them. Biomed Eng Online. 2018;17:1–29. doi: 10.1186/s12938-018-0455-y. [DOI] [PMC free article] [PubMed] [Google Scholar]
- Clarke C, Madden SF, Doolan P, et al. Correlating transcriptional networks to breast cancer survival: a large-scale coexpression analysis. Carcinogenesis. 2013;34:2300–2308. doi: 10.1093/carcin/bgt208. [DOI] [PubMed] [Google Scholar]
- Cook JG, Chasse DAD, Nevins JR. The regulated association of Cdt1 with minichromosome maintenance proteins and Cdc6 in mammalian cells. J Biol Chem. 2004;279:9625–9633. doi: 10.1074/jbc.M311933200. [DOI] [PubMed] [Google Scholar]
- Dahmcke CM, Büchmann-Møller S, Jensen NA, Mitchelmore C. Altered splicing in exon 8 of the DNA replication factor CIZ1 affects subnuclear distribution and is associated with Alzheimer’s disease. Mol Cell Neurosci. 2008;38:589–594. doi: 10.1016/j.mcn.2008.05.007. [DOI] [PubMed] [Google Scholar]
- Dhanavade MJ, Sonawane KD. Amyloid beta peptide-degrading microbial enzymes and its implication in drug design. 3 Biotech. 2020;10:247. doi: 10.1007/s13205-020-02240-2. [DOI] [PMC free article] [PubMed] [Google Scholar]
- Dodd T, Botto M, Paul F, et al. Polymerization and editing modes of a high-fidelity DNA polymerase are linked by a well-defined path. Nat Commun. 2020;11:5379. doi: 10.1038/s41467-020-19165-2. [DOI] [PMC free article] [PubMed] [Google Scholar]
- Frain L, Swanson D, Cho K, et al. Association of cancer and Alzheimer’s disease risk in a national cohort of veterans. Alzheimer’s Dement. 2017;13:1364–1370. doi: 10.1016/j.jalz.2017.04.012. [DOI] [PMC free article] [PubMed] [Google Scholar]
- Gagic Z, Ruzic D, Djokovic N, et al. In silico methods for design of kinase inhibitors as anticancer drugs. Front Chem. 2020;7:873. doi: 10.3389/fchem.2019.00873. [DOI] [PMC free article] [PubMed] [Google Scholar]
- Hanahan D, Weinberg RA. Hallmarks of cancer: the next generation. Cell. 2011;144:646–674. doi: 10.1016/j.cell.2011.02.013. [DOI] [PubMed] [Google Scholar]
- Hernández-Ortega K, Ferrera P, Arias C. Sequential expression of cell-cycle regulators and Alzheimer’s disease–related proteins in entorhinal cortex after hippocampal excitotoxic damage. J Neurosci Res. 2007;85:1744–1751. doi: 10.1002/jnr.21301. [DOI] [PubMed] [Google Scholar]
- Hosseinalizadeh H, Mahmoodpour M, Ebrahimi A. Circulating non-coding RNAs as a diagnostic and management biomarker for breast cancer: current insights. Mol Biol Rep. 2021 doi: 10.1007/s11033-021-06847-3. [DOI] [PubMed] [Google Scholar]
- Ishimi Y, Sugiyama T, Nakaya R, et al. Effect of heliquinomycin on the activity of human minichromosome maintenance 4/6/7 helicase. FEBS J. 2009;276:3382–3391. doi: 10.1111/j.1742-4658.2009.07064.x. [DOI] [PubMed] [Google Scholar]
- Jassal B, Matthews L, Viteri G, et al. The reactome pathway knowledgebase. Nucleic Acids Res. 2020;48:D498–D503. doi: 10.1093/nar/gkz1031. [DOI] [PMC free article] [PubMed] [Google Scholar]
- Kamada K, Kubota Y, Arata T, et al. Structure of the human GINS complex and its assembly and functional interface in replication initiation. Nat Struct Mol Biol. 2007;14:388–396. doi: 10.1038/nsmb1231. [DOI] [PubMed] [Google Scholar]
- Kuleshov MV, Jones MR, Rouillard AD, et al. Enrichr: a comprehensive gene set enrichment analysis web server 2016 update. Nucleic Acids Res. 2016;44:W90–97. doi: 10.1093/nar/gkw377. [DOI] [PMC free article] [PubMed] [Google Scholar]
- Kulkarni DS, Owens SN, Honda M, et al. PCNA activates the MutLγ endonuclease to promote meiotic crossing over. Nature. 2020;586:623–627. doi: 10.1038/s41586-020-2645-6. [DOI] [PMC free article] [PubMed] [Google Scholar]
- Kumar AR, Devan AR, Nair B, et al. Harnessing the immune system against cancer: current immunotherapy approaches and therapeutic targets. Mol Biol Rep. 2021 doi: 10.1007/s11033-021-06752-9. [DOI] [PMC free article] [PubMed] [Google Scholar]
- Lanni C, Masi M, Racchi M, Govoni S. Cancer and Alzheimer’s disease inverse relationship: an age-associated diverging derailment of shared pathways. Mol Psychiatry. 2021;26:280–295. doi: 10.1038/s41380-020-0760-2. [DOI] [PubMed] [Google Scholar]
- Lepage CC, Palmer MCL, Farrell AC, et al. Reduced SKP1 and CUL1 expression underlies increases in Cyclin E1 and chromosome instability in cellular precursors of high-grade serous ovarian cancer. Br J Cancer. 2021;124:1699–1710. doi: 10.1038/s41416-021-01317-w. [DOI] [PMC free article] [PubMed] [Google Scholar]
- Li N, Lam WH, Zhai Y, et al. Structure of the origin recognition complex bound to DNA replication origin. Nature. 2018;559:217–222. doi: 10.1038/s41586-018-0293-x. [DOI] [PubMed] [Google Scholar]
- Liang Z, Li W, Liu J, et al. Simvastatin suppresses the DNA replication licensing factor MCM7 and inhibits the growth of tamoxifen-resistant breast cancer cells. Sci Rep. 2017;7:1–11. doi: 10.1038/s41598-016-0028-x. [DOI] [PMC free article] [PubMed] [Google Scholar]
- Liu Q, Niu N, Wada Y, Liu J. The role of Cdkn1A-interacting zinc finger protein 1 (CIZ1) in DNA replication and pathophysiology. Int J Mol Sci. 2016;17:212. doi: 10.3390/ijms17020212. [DOI] [PMC free article] [PubMed] [Google Scholar]
- Manickavinayaham S, Vélez-Cruz R, Biswas AK, et al. E2F1 acetylation directs p300/CBP-mediated histone acetylation at DNA double-strand breaks to facilitate repair. Nat Commun. 2019;10:4951. doi: 10.1038/s41467-019-12861-8. [DOI] [PMC free article] [PubMed] [Google Scholar]
- Mistry J, Chuguransky S, Williams L, et al. Pfam: The protein families database in 2021. Nucleic Acids Res. 2021;49:D412–D419. doi: 10.1093/nar/gkaa913. [DOI] [PMC free article] [PubMed] [Google Scholar]
- Mooser C, Symeonidou I-E, Leimbacher P-A, et al. Treacle controls the nucleolar response to rDNA breaks via TOPBP1 recruitment and ATR activation. Nat Commun. 2020;11:123. doi: 10.1038/s41467-019-13981-x. [DOI] [PMC free article] [PubMed] [Google Scholar]
- Mori Y, Inoue Y, Taniyama Y, et al. Phosphorylation of the centrosomal protein, Cep169, by Cdk1 promotes its dissociation from centrosomes in mitosis. Biochem Biophys Res Commun. 2015;468:642–646. doi: 10.1016/j.bbrc.2015.11.004. [DOI] [PubMed] [Google Scholar]
- Nagamalla L, Kumar JS. In silico screening of FDA approved drugs on AXL kinase and validation for breast cancer cell line. J Biomol Struct Dyn. 2021;39:2056–2070. doi: 10.1080/07391102.2020.1742791. [DOI] [PubMed] [Google Scholar]
- Nudelman KNH, McDonald BC, Lahiri DK, Saykin AJ. Biological hallmarks of cancer in Alzheimer’s disease. Mol Neurobiol. 2019;56:7173–7187. doi: 10.1007/s12035-019-1591-5. [DOI] [PMC free article] [PubMed] [Google Scholar]
- Olsson N, Carlsson P, James P, et al. Grading breast cancer tissues using molecular portraits. Mol Cell Proteom. 2013;12:3612–3623. doi: 10.1074/mcp.M113.030379. [DOI] [PMC free article] [PubMed] [Google Scholar]
- Otasek D, Morris JH, Bouças J, et al. Cytoscape automation: empowering workflow-based network analysis. Genome Biol. 2019;20:185. doi: 10.1186/s13059-019-1758-4. [DOI] [PMC free article] [PubMed] [Google Scholar]
- Park J, Wysocki RW, Amoozgar Z, et al. Cancer cells induce metastasis-supporting neutrophil extracellular DNA traps. Scie Transl Med. 2016;8:361ra138. doi: 10.1126/scitranslmed.aag1711. [DOI] [PMC free article] [PubMed] [Google Scholar]
- Paryan M, Tavakoli R, Rad SMAH, et al. Over-expression of NOTCH1 as a biomarker for invasive breast ductal carcinoma. 3 Biotech. 2016;6:58. doi: 10.1007/s13205-016-0373-2. [DOI] [PMC free article] [PubMed] [Google Scholar]
- Radonova L, Pauerova T, Jansova D, et al. Cyclin A1 in oocytes prevents chromosome segregation and anaphase entry. Sci Rep. 2020;10:7455. doi: 10.1038/s41598-020-64418-1. [DOI] [PMC free article] [PubMed] [Google Scholar]
- Rageul J, Park JJ, Zeng PP, et al. SDE2 integrates into the TIMELESS-TIPIN complex to protect stalled replication forks. Nat Commun. 2020;11:5495. doi: 10.1038/s41467-020-19162-5. [DOI] [PMC free article] [PubMed] [Google Scholar]
- Rao YL, Ganaraja B, Murlimanju BV, et al. Hippocampus and its involvement in Alzheimer’s disease: a review. 3 Biotech. 2022;12:55. doi: 10.1007/s13205-022-03123-4. [DOI] [PMC free article] [PubMed] [Google Scholar]
- Sami E, Bogan D, Molinolo A, et al. The molecular underpinning of geminin-overexpressing triple-negative breast cancer cells homing specifically to lungs. Cancer Gene Ther. 2021 doi: 10.1038/s41417-021-00311-x. [DOI] [PubMed] [Google Scholar]
- Siano G, Varisco M, Scarlatti A, et al. Gene expression of disease-related genes in alzheimer’s disease is impaired by tau aggregation. J Mol Biol. 2020;432:166675. doi: 10.1016/j.jmb.2020.10.009. [DOI] [PubMed] [Google Scholar]
- Simon N, Bochman ML, Seguin S, et al. Ciprofloxacin is an inhibitor of the Mcm2-7 replicative helicase. Biosci Rep. 2013;33:e00072. doi: 10.1042/BSR20130083. [DOI] [PMC free article] [PubMed] [Google Scholar]
- Smith KP, Gifford KM, Waitzman JS, Rice SE. Survey of phosphorylation near drug binding sites in the Protein Data Bank (PDB) and their effects: Phosphorylation Near Drug Binding Sites. Proteins. 2015;83:25–36. doi: 10.1002/prot.24605. [DOI] [PMC free article] [PubMed] [Google Scholar]
- Snyder HM, Ahles T, Calderwood S, et al. Exploring the nexus of Alzheimer’s disease and related dementias with cancer and cancer therapies: a convening of the Alzheimer’s Association & Alzheimer’s Drug Discovery Foundation. Alzheimer’s Dement. 2017;13:267–273. doi: 10.1016/j.jalz.2016.11.002. [DOI] [PMC free article] [PubMed] [Google Scholar]
- Sriram N, Sah MK. Regulatory insights into progression of cancer and Alzheimer’s disorder from autophagy perspective. Mol Biol Rep. 2021;48:8227–8232. doi: 10.1007/s11033-021-06838-4. [DOI] [PubMed] [Google Scholar]
- Starokadomskyy P, Gemelli T, Rios JJ, et al. DNA polymerase-α regulates the activation of type I interferons through cytosolic RNA:DNA synthesis. Nat Immunol. 2016;17:495–504. doi: 10.1038/ni.3409. [DOI] [PMC free article] [PubMed] [Google Scholar]
- Sung H, Ferlay J, Siegel RL, et al. Global cancer statistics 2020: GLOBOCAN estimates of incidence and mortality worldwide for 36 cancers in 185 countries. CA Cancer J Clin. 2021;71:209–249. doi: 10.3322/caac.21660. [DOI] [PubMed] [Google Scholar]
- Surguchov A. Caveolin: A new link between diabetes and ad. Cell Mol Neurobiol. 2020;40:1059–1066. doi: 10.1007/s10571-020-00796-4. [DOI] [PMC free article] [PubMed] [Google Scholar]
- Sykora P, Misiak M, Wang Y, et al. DNA polymerase β deficiency leads to neurodegeneration and exacerbates Alzheimer disease phenotypes. Nucleic Acids Res. 2015;43:943–959. doi: 10.1093/nar/gku1356. [DOI] [PMC free article] [PubMed] [Google Scholar]
- Szklarczyk D, Gable AL, Lyon D, et al. STRING v11: protein–protein association networks with increased coverage, supporting functional discovery in genome-wide experimental datasets. Nucleic Acids Res. 2019;47:D607–D613. doi: 10.1093/nar/gky1131. [DOI] [PMC free article] [PubMed] [Google Scholar]
- Szpor J, Streb J, Glajcar A, et al. Dendritic cells are associated with prognosis and survival in breast cancer. Diagnostics. 2021;11:702. doi: 10.3390/diagnostics11040702. [DOI] [PMC free article] [PubMed] [Google Scholar]
- Taylor MRG, Yeeles JTP. Dynamics of replication fork progression following helicase-polymerase uncoupling in eukaryotes. J Mol Biol. 2019;431:2040–2049. doi: 10.1016/j.jmb.2019.03.011. [DOI] [PMC free article] [PubMed] [Google Scholar]
- The Gene Ontology Consortium The Gene Ontology resource: enriching a GOld mine. Nucleic Acids Res. 2021;49:D325–D334. doi: 10.1093/nar/gkaa1113. [DOI] [PMC free article] [PubMed] [Google Scholar]
- The UniProt Consortium UniProt: the universal protein knowledgebase in 2021. Nucleic Acids Res. 2021;49:D480–D489. doi: 10.1093/nar/gkaa1100. [DOI] [PMC free article] [PubMed] [Google Scholar]
- Thues C, Valadas JS, Deaulmerie L, et al. MAPRE2 mutations result in altered human cranial neural crest migration, underlying craniofacial malformations in CSC-KT syndrome. Sci Rep. 2021;11:4976. doi: 10.1038/s41598-021-83771-3. [DOI] [PMC free article] [PubMed] [Google Scholar]
- Toyokawa G, Masuda K, Daigo Y, et al. Minichromosome Maintenance Protein 7 is a potential therapeutic target in human cancer and a novel prognostic marker of non-small cell lung cancer. Mol Cancer. 2011;10:65. doi: 10.1186/1476-4598-10-65. [DOI] [PMC free article] [PubMed] [Google Scholar]
- Van De Vijver MJ, He YD, Van’t Veer LJ, et al. A gene-expression signature as a predictor of survival in breast cancer. N Engl J Med. 2002;347:1999–2009. doi: 10.1056/NEJMoa021967. [DOI] [PubMed] [Google Scholar]
- Walker DG, Lue L-F. Immune phenotypes of microglia in human neurodegenerative disease: challenges to detecting microglial polarization in human brains. Alzheimer’s Res Ther. 2015;7:1–9. doi: 10.1186/s13195-014-0092-z. [DOI] [PMC free article] [PubMed] [Google Scholar]
- Weiner BE, Huang H, Dattilo BM, et al. An iron-sulfur cluster in the C-terminal domain of the p58 subunit of human DNA primase. J Biol Chem. 2007;282:33444–33451. doi: 10.1074/jbc.M705826200. [DOI] [PubMed] [Google Scholar]
- Wiley J. Alzheimer’s disease facts and figures. Alzheimers Dement. 2021;17:327–406. doi: 10.1002/alz.12328. [DOI] [PubMed] [Google Scholar]
- Williams JS, Tumbale PP, Arana ME, et al. High-fidelity DNA ligation enforces accurate Okazaki fragment maturation during DNA replication. Nat Commun. 2021;12:482. doi: 10.1038/s41467-020-20800-1. [DOI] [PMC free article] [PubMed] [Google Scholar]
- Yao NY, O’Donnell M. The rfc clamp loader: structure and function. In: MacNeill S, editor. The eukaryotic replisome: a guide to protein structure and function. Dordrecht: Springer Netherlands; 2012. pp. 259–279. [Google Scholar]
- Zhang H, Yan X. Cantharidin modulates the E2F1/MCM7-miR-106b-93/p21-PTEN signaling axis in MCF-7 breast cancer cells. Oncol Lett. 2015;10:2849–2855. doi: 10.3892/ol.2015.3681. [DOI] [PMC free article] [PubMed] [Google Scholar]
Associated Data
This section collects any data citations, data availability statements, or supplementary materials included in this article.