

Abstract
Water pollution always occurs in Malaysia due to industrial, construction, agriculture, and household activities. River pollution can disturb water supply that eventually affects business and household activities. Thus, water quality monitoring system is needed to detect contaminated water. We developed a water quality monitoring and filtration system controlled by Arduino. The proposed system was designed in Proteus software and ThingSpeak platform was used for real-time monitoring. The main objective of the study was to compare water quality of river, lake and tap water in terms of pH, temperature, turbidity, electrical conductivity and oxidation–reduction potential. If the water quality was not satisfied, the water sample would be filtered through filtration system. Water turbidity level, pH, temperature, electrical conductivity, and oxidation–reduction potential for filtered and nonfiltered water were compared and analyzed according to international and national water quality standard. Besides that, statistical analysis such as box plot and one-way analysis of variance test was applied to validate data from the system. The real-time water quality monitoring system was implemented through data storage, data transfer, and data processing. The system was connected to wireless fidelity whereas the output data was sent to the user and monitored by ThingSpeak. The system can be further upgraded and scaled up to be applied in the main tank at our home or factory. The outcome of this research can be used as a reference for further study on lake and river pollution monitoring system.
Supplementary Information
The online version contains supplementary material available at 10.1007/s13762-022-04192-x.
Keywords: Turbidity, Ph, Temperature, Electrical conductivity, Oxidation–reduction potential, Boxplot, Analysis of variance
Introduction
Surface water and groundwater are the main water supplies for Malaysia. Although Malaysia has abundant water resources, the accelerating pace of industrial development and population growth in recent decades has affected the quality of water (Bao 2010). Pandemic issue, Covid-19 also affects water quality when the non-essential services such as work for development project are ceased (Najah 2021). Domestic sewage, waste, and discharge from agriculture and manufacturing industries are the main sources of river pollution. Groundwater sources near agricultural areas, radioactive waste landfills, municipal water supply sources, and waste dumps are mostly polluted with arsenic, iron, lead and others (Khalit 2008; Bilal et al. 2016). Water pollution increases in parallel with the country development that shows the requirement to detect water pollutants. Detection system was built to recognize metal ions in water using colorimetric sensors (Alberti et al. 2020). Raril and Manjunatha (2020) developed a system that traced mercury and lead ions in water through the usage of polyglycine-modified graphene paste electrode. Each pollutant has distinct characteristics that can be traced. Thus, the detection system needs to be fast, accurate, and continuously up to date.
Monitoring water quality was previously done based on temporal and spatial scales which used multi-metric indices and operational indicators (Sany 2018). The quality of water in canals, drains and irrigation wells were analyzed and compared using MODFLOW software which could forecast the effects of surface water on groundwater in long-term period (Galal et al. 2020). It is essential to measure and monitor physical, chemical, and biological parameters of water in order to identify its quality. Then, types of water treatment can be identified before it can be supplied to consumers as tap water and drinking water (Huang et al. 2015; Alsulaili et al. 2015). Elsheikh et al. (2018) compared three different types of water filtration systems and allowed assessment and evaluation to be made towards the execution and fulfillment of each water filtration systems. Delgado et al. (2020) determined the effect of illegal mining on the water quality by applying grey system. By applying grey clustering method, water quality was grouped into three categories: good, moderate, and low water quality. Supriyono et al. (2020) developed a telemonitoring system that automatically measured and collected variables of water and air quality in coastal fishponds and continuously displayed the data to the user.
Water quality management and monitoring networks are also crucial. The allowed wastewater discharge rates for contaminant resources depend on two factors: treatment costs and water quality standard (Aghasian et al. 2017). Aghasian et al. integrated water quality simulation model with particle swarm optimization model and developed various pollution loadings discharge policies using bankruptcy method. Results showed that the proposed model reduced the salinity of the allocated water demands leading to a decrease in salinity discharged into the river. Genetic algorithm was developed to minimize wastewater treatment costs and dissolved oxygen violation from the standard level. This method was estimated to reduce waste load from 145.5 to 79 and treatment cost from the range of ($160,000–180,000) to ($100,000–130,000). Thus, the proposed models can satisfy water quality with low treatment cost (Farjoudi et. al. 2020). Meanwhile, monitoring network of groundwater was designed using DRASTIC method and capture zone analysis where the design was developed according to monitoring wells priority. Differential Evolution (DE) algorithm was used to optimize the DRASTIC model in order to find the highest correlation between high and vulnerable areas of electrical conductivity. The authors claimed that by proper estimating vulnerability of existing wells and the capture zones, the monitoring wells could be prioritized (Yousefi et. al. 2021). Thus, proper water quality monitoring, filtering, and treatment methods are needed.
Most previous studies on water quality monitoring system used different microcontroller unit such as Raspberry Pi, Arduino, and Waspmote. The studies mainly focused on the capability of the system to monitor water quality by detecting water quality parameter using various electronics sensors. The previous research focused more on the system design without doing any analysis.
This study proposes a real-time water quality monitoring system using Arduino and five types of sensors, completed with data analysis. ThingSpeak open-source software based on IoT technology was applied to analyze live data streams. Analysis was done for different types of water where one-way Analysis of Variance (ANOVA) test was used to observe the significance of the experimental results. The quality of filtered and unfiltered water was also compared according to water quality standard established by World Health Organization (Jabatan Alam Sekitar 2019; Engineering Services Division 2016; WHO 2011). Due to ongoing Restricted Movement Control Order from Malaysian Government because of Covid-19 Pandemic, water samples are limited to sites situated in Nilai, Negeri Sembilan. The water samples consisted of tap water taken from a local household situated in Nilai, river water from Mahang River and lake water from a lake in Universiti Sains Islam Malaysia. The sampling process was done in the month of November 2020 for ten hours (from 9:00 a.m. until 6:00 p.m) a day.
Materials and methods
-
Water sampling method
Water samples were collected from Mahang River, a lake in Universiti Sains Islam Malaysia, and tap water. We monitored pH, turbidity, temperature, electrical conductivity (EC), and oxidation–reduction potential (ORP) of the samples from 9:00 a.m. until 6:00 p.m. for 10 h. Water samples were also transferred into a tank to undergo filtration process. Readings from the sensors were collected, translated and processed by the microcontroller before being displayed using LCD and uploaded into cloud storage for monitoring.
-
System design
We designed a water monitoring and filtration system using sensors to detect temperature, pH value, oxidation–reduction potential (ORP), electrical conductivity (EC), and turbidity. A microcontroller unit consisted of Arduino Uno and Mega, was used as the main controller. We also used a data transmission block, ESP8266 Wi-Fi module and a water filtration unit which consisted of a water pump and a water filter.
NodeMCU software and open-source framework were used to construct Internet of Things (IoT) devices. The data processed by the microcontroller unit was uploaded and updated into Cloud storage and ThingSpeak application through data communication unit, ESP8266 Wi-Fi module. After logging into the ThingSpeak application with our unique user ID and password, we could access data from the monitoring system in real-time provided that the system was connected to the internet. Water quality for filtered and unfiltered water was also compared. Figure 1 shows the flowchart of the system.
The Arduino Uno processed the turbidity, pH, temperature, electrical conductivity (EC), and oxidation–reduction potential (ORP) of the water samples and sent to the ThingSpeak application using internet network. ThingSpeak application displayed the temperature, turbidity, pH, electrical conductivity (EC) and oxidation–reduction potential (ORP) value of water in real-time. Based on Fig. 1, we determined the bad quality of water if the sensor readings exceed range of the threshold values. Water would be automatically pumped into a water filter for the filtration process. The threshold values for the sensors were set according to the limit set in the national water standard and World Health Organization (WHO) (Jabatan Alam Sekitar 2019; Engineering Services Division 2016; WHO 2011). The sensors were easy to use, cost-effective, and portable. Figure 2 shows the circuit design of the system in Proteus software. Simulation was done using the Proteus software to ensure the system could run properly before assembling the real circuit on board.
Figure 3 shows the electronic circuit of the proposed water quality monitoring system. All water quality parameter sensors, LCD display, Wi-Fi module and water pump were connected to the main microcontroller board. Figure 4 shows water quality system with filtration unit. Lake and river water samples were collected, stored and monitored in a tank connected to a filtration system. The sensor readings of the filtered water were observed and compared with the unfiltered water.
Analysis Methods
-
Boxplot analysis
We used boxplot analysis to observe the range of data and to identify any abnormal data. Boxplot is a technique to describe and summarize data. Boxplot graph shows the data distribution, range, minimum value, maximum value, mean, and skewness by showing five-number summary of a set of data which includes minimum and maximum range values, lower quartile, upper quartile, and median (Potter 2006).
-
One-way ANOVA
Analysis of variance (ANOVA) is a statistical method that is useful to give important information like interpreting outcomes of an experiment and identifying the influence of a factor on the processing parameters by comparing the mean values of some samples (Ostertagova 2013). One-way ANOVA is used for data that are divided into several groups associated with only one factor. The mean values are compared to determine the significant level of differences in the associated population of samples. One-way ANOVA test produces F value (Eq. 1) (Sullivan 2021) and p-value.1 is the size of jth group, is the sample mean in jth group, is the overall mean, is the number of independent groups and is the total number of observations in the analysis (Sullivan 2021). represents mean squares, thus is the mean sum of squares between sample groups and is the mean sum of squares within the sample groups. F value is used to determine p-value where the p-value is the probability of F statistical values that measures the evidence to accept or reject hypothesis. To evaluate the null hypothesis, the differences between means are identified by comparing the p-value with the standard significance level, 0.05 (Ostertagova 2013).
Fig. 1.

Flow Chart of the Water Quality Monitoring System
Fig. 2.

Circuit design drawn in Proteus Software. The design was translated into hardware system in Fig. 3
Fig. 3.
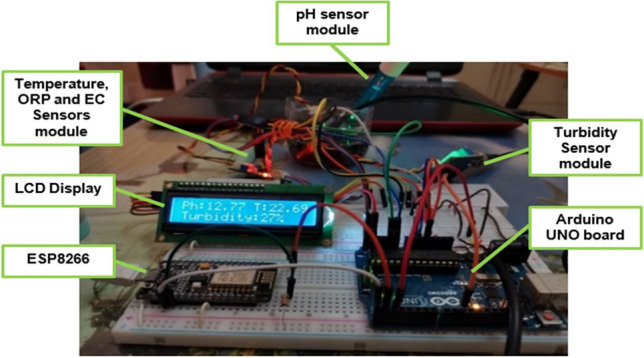
Electronic circuit of the proposed water quality monitoring system
Fig. 4.
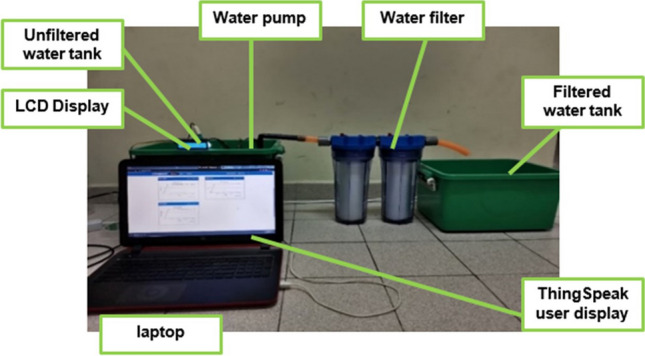
The proposed technique of monitoring water with water filtration system
Results and discussion
In this section, we depict output from water quality monitoring system and analyze the output based on five water quality parameters: pH, temperature, turbidity, oxidation–reduction potential and electrical conductivity. Real-time values of the parameters are observed through Thingspeak application which indirectly can assist users to monitor the system continuously. Figure 5 shows the real-time water quality monitoring system for users of ThingSpeak application.
Fig. 5.
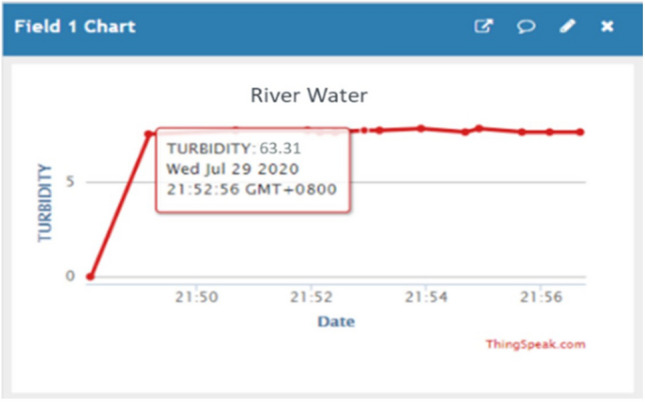
The display of the ThingSpeak application shows the turbidity of the river water. Date and time are also displayed for real-time monitoring
(a) Physical parameters of water quality with box plot analysis
Temperature is an important parameter for water monitoring system as the taste, smells, viscosity, solubility and chemical reactions are influenced by temperature (APHA 2005; Alley 2007). Turbidity describes the cloudiness of water due to the presence of suspended particles like clay, silts, and precipitation of chemical and organic particles (APHA 2005; WHO 2017). Turbidity can be used as a good indicator to detect the presence of dangerous particles and contaminants (WHO 2017). Turbidity is expressed in terms of nephelometric turbidity unit (NTU). Turbidity above 5 NTU is visible to eyes (WHO 2017). The pH is an important water quality parameter to determine the basicity of an aqueous solution. The pH value from 0 to 14 indicates the acidity, neutrality or alkalinity of the water (Tomar 1999). Acidic solution has pH less than 7 and pH ~ 7 indicates a neutral solution. Meanwhile, pH greater than 7 indicates an alkalic solution (WHO 2011). Unreasonably high or low pH of water is not safe for household usage and drinking water (DeZuane 1997). The acceptable pH for consuming and drinking water is from 6.5 to 9 (Engineering Services Division 2016) whereas water temperature can be influenced by surrounding environment.
Electrical conductivity (EC) refers to the ability of electric to flow in the water. Conductivity value of water is normally constant throughout the times. Thus, any changes in conductivity depict the possibility of water pollution due to chemical reaction with water. Conductivity will increase due to the presence of chemicals like chloride, phosphate and nitrate ions (EPA 2012). Meanwhile, oxidation–reduction potential (ORP) can be defined as the capability of a water source to break down waste products like dead plants and animals. Unpolluted lakes and rivers have high value of oxidation–reduction potential, showing that the water has high amount of dissolved oxygen (Kremer 2018).
Monitoring water quality parameters is done by taking the readings of the sensors for ten hours from 9:00 a.m. until 6:00 p.m. All water quality parameters detected in the system are compared with the National Water Quality Standard and Drinking Water Quality Standard (WHO 2011; Engineering Services Division 2016).
Figure 6 (a) shows temperature values for tap, lake and river water and Fig. 6 (b) depicts the range of temperature in boxplot. There are two abnormal temperature values for tap water and river water shows higher fluctuation compared to others. The fluctuation in temperature is due to sensitivity of sensors. Figure 6 (a) and (b) show that river water has the lowest temperature with the range from 27.87 °C to 28.91 °C with the average, 28.19 °C and the standard deviation, 0.349. Lake water has the highest range of temperature, from 30.18 to 30.76 °C with the average, 30.32 °C and the standard deviation, 0.170. The temperature of tap water fluctuates from 27.6 to 30 °C. The mean temperature is 29.55 °C and the standard deviation value is 0.754. Lake water has the highest temperature as the surface of the water is exposed to sunlight and has zero or low motion water. Lake water also shows stable temperature, proved by the small standard deviation whereas temperature of tap water fluctuates resulting in the highest standard deviation. Tap water comes from tank and pipe, can be easily affected by the temperature of the day. Water takes longer time to warm up and cool down compared to air. River water has the lowest temperature because it is continuously flowing resulting in slow heat transfer.
Fig. 6.

a Temperature values for three water samples; b Temperature boxplot for three water samples. Ten readings are used for the analysis
Figure 7 (a) and (b) show the pH variations of water samples and the boxplot for pH values. Normal tap water has neutral pH from 7.16 to 8.33 with the average pH, 7.551 and the standard deviation, 0.477. High fluctuation of pH in tap water (Fig. 7 (b)) is attributed to chemicals in the water as pH is related to the amount of hydrogen and hydroxyl ions. (Tomar 1999). River water has higher pH compared to tap water with the range from 8.04 to 8.16, the average pH, 8.09 and standard deviation, 0.062. Lake water has the highest pH ranging from 9.04 to 9.18. The mean pH for lake water sample is 9.09 with standard deviation, 0.051. The lake water has the highest pH due to the presence of carbonated-rich soils like limestone. Besides that, algae and aquatic plants in the lake water apply photosynthesis process that uses hydrogen which also can contribute to the high pH in the lake water (Fondriest Environmental 2013). The pH of river and lake can also be affected by the activities at the shoreline.
Fig. 7.

a pH variation for three water samples; b pH boxplot for three water samples. Ten readings are used for the analysis
Figure 8 (a) and (b) show the turbidity variations and the boxplot for all samples. Lake water depicts the highest fluctuation of turbidity in 10 h (Fig. 8 (b)), due to variation of organic materials. Tap water shows the lowest turbidity level whereas river depicts the highest turbidity level. Tap water has turbidity level from 0 to 2 NTU. The mean value is 0.24 NTU and the standard deviation value is 0.622. River water depicts turbidity level from 48.05 NTU to 98.43 NTU while lake water sample shows the highest turbidity values, from 136.92 NTU to 223.72 NTU. The mean turbidity value for river and lake samples are 77.004 NTU and 181.292 NTU respectively. The standard deviation of the turbidity for river and lake water are 16.860 and 39.07, showing higher fluctuation compared to tap water. Tap water has the lowest turbidity level because the water is transparent and clear. The river water is turbid due to the presence of suspended and colloidal matter like clay, silt, finely divided organic and inorganic matter, plankton and other microscopic organisms (Allen et al. 2008). Lake has the highest range of turbidity, attributed to the clays, silts, suspended bottom sediments, phytoplankton and algae. According to Malaysia National Water Standard, based on the turbidity, pH and temperature of all water samples, tap water is safe to be consumed but lake and river water need to be treated and filtered before we can consume it as drinking water (Jabatan Alam Sekitar 2019).
Fig. 8.

a Turbidity values for the three water samples; b Turbidity boxplot for three water samples. Ten readings are used for the analysis
Figure 9 shows the electrical conductivity values of the water samples. Due to the use of chlorine that contains electrons in water treatment process, tap water shows the highest range of electrical conductivity values and highest fluctuation (Kremer 2018). Electrical conductivity of tap water has maximum value ~ 1.81mS/cm and minimum value ~ 0.88mS/cm with standard deviation ~ 0.33 and mean ~ 1.2mS/cm. The range of electrical conductivity of river water is from 0.22 to 0.33mS/cm, the lowest range compared to other samples. The mean and standard deviation of electrical conductivity for river water are 0.25 and 0.04 respectively. Charged ions in river and lake water come from the presence of dissolved minerals like clay soils or limestone (Huron River Watershed Council 2013).
Fig. 9.

a Electrical conductivity values for three water samples; b Electrical conductivity boxplot for three water samples. Ten readings are used for the analysis
Figure 10 shows the readings of oxidation–reduction potential of the water samples. The oxidation–reduction potential values of tap water are in the highest range, from 280 to 289 mV with standard deviation ~ 3.14 while river water has the lowest oxidation–reduction potential readings with range from 153 to 173 mV and standard deviation ~ 6.15. Tap water has the highest range of oxidation–reduction potential due to water treatment that involves chlorine. Chlorine is used in water treatment to kill bacteria, parasites, viruses and microbes in water by neutralizing and oxidizing bacteria, parasites, viruses and microbes. This oxidation process increases the level of oxidation–reduction potential values of water (Kremer 2018). The oxidation–reduction potential values of river and lake water samples fall slightly under the healthy range of freshwater oxidation–reduction potential value, from 300 to 500 millivolts. Lower oxidation–reduction value is also expected at the bottom of the lake and river. Oxygen level at the bottom of the lake and river is low due to the usage of the oxygen by bacteria (Wetzel 2001).
Fig. 10.

a Oxidation–reduction potential variation of three water samples; b Oxidation–reduction potential boxplot for three water samples. Ten readings are used for the analysis
(b) Statistical analysis—One-way ANOVA
One-way Analysis of variance (ANOVA) model is done to test the null hypothesis that states all parameters have similar population mean. If the variability of the sample mean is large, the null hypothesis is rejected. The alternate hypothesis that states at least one population mean is different from the others will be accepted (Ostertagova 2013). When there are statistically significant differences between the means, p-value is less than or equal to α value (0.05). Null hypothesis is rejected as there is at least one different population mean. Table 1 shows one-way ANOVA test results done using OriginPro software. The one-way ANOVA test revealed that there was a statistically significant difference in the means of pH, temperature, turbidity, electrical conductivity and oxidation–reduction potential between at least two groups with (F(3,10) = [78.1138], p = 0.0000), (F(3,10) = [48.6633], p = 0.0000), (F(3,10) = [136.7881], p = 0.0000), (F(3,10) = [62.3271], p = 0.0000) and (F(3,10) = [466.1869], p = 0.0000) respectively. From the table, the p-value of all parameters is less than 0.05. Thus, null hypothesis is rejected. For all water parameters tested, at least one group of water samples has a significant difference from overall mean of the water samples. The statistical significance shows that data collected are probably true and is due to factors of interest. Thus, we strongly suppose that pH, temperature, turbidity, electrical conductivity, and oxidation–reduction potential can give effect the analysis of water quality.
Table 1.
One-way ANOVA test for different water parameters
| Parameters | F | p-value |
|---|---|---|
| pH | 78.1138 | 5.93 × 10⁻¹² ≈ 0.0000 |
| Temperature | 48.6633 | 1.11 × 10–09 ≈ 0.0000 |
| Turbidity | 136.7881 | 7.43 × 10⁻¹⁵ ≈ 0.0000 |
| Electrical conductivity | 62.3271 | 7.62 × 10⁻¹¹ ≈ 0.0000 |
| Oxidation–reduction potential | 466.1869 | 1.17 × 10⁻²¹ ≈ 0.0000 |
(c) Comparison of filtered and unfiltered water
Figure 11 shows the turbidity, pH and temperature of normal tap water from the same source for two days. As normal tap water is commonly safe to be used, the water does not need to undergo filtration process. The tap water sample from same source is compared for two different days. The mean value for turbidity, pH value and temperature of the tap water sample in the first and second day are 0.1 NTU, 7.501 and 29.21 °C respectively. The standard deviation values for tap water in both days are 0.208 for turbidity, 0.429 for pH values and 1.026 for temperature. The mean and standard deviation depicts that the system is reliable due to less fluctuation especially for turbidity sensing system. The turbidity readings for tap water are lower than 1 NTU, in the safe range of water quality (WHO 2017). The pH of the tap water shows that the water is in the neutral and light alkalic range. The temperature of tap water fluctuates depending on the weather and surrounding environment. Figure 12 shows the turbidity, temperature, and pH value of lake water before and after filtration process. The average of turbidity, temperature, and pH for lake water before filtration is 181.29 NTU, 30.32 °C and 9.09 respectively while the average of turbidity, temperature, and pH for lake water after filtration are 16.91 NTU, 29.43 °C and 7.34 respectively. Figure 13 shows the turbidity, temperature, and pH of river water before and after filtration process. The average of turbidity, temperature, and pH for river water before filtration is 77.00 NTU, 28.18 °C and 8.09 respectively while the mean values of turbidity, temperature, and pH for river water after filtration are 24.22 NTU, 29.5 °C and 7.52 respectively.
Fig. 11.
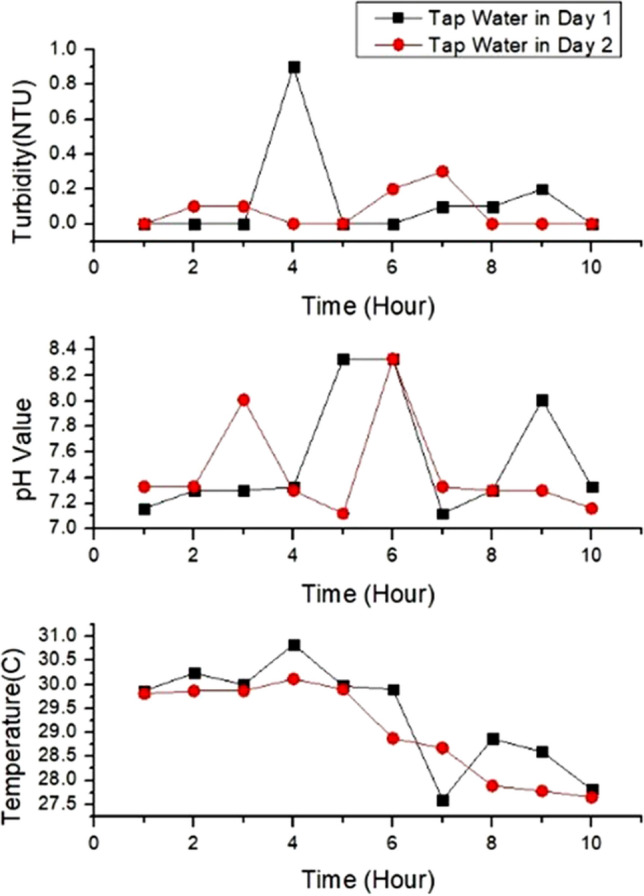
Turbidity levels, pH value and temperature of tap water for day one and day two
Fig. 12.
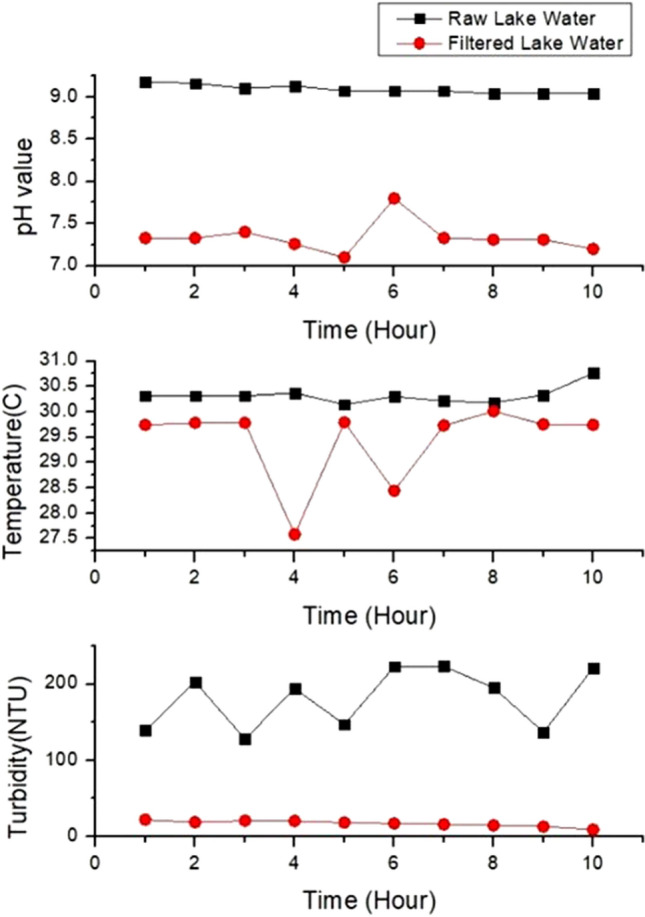
Comparison of water quality parameters for unfiltered and filtered lake water
Fig. 13.
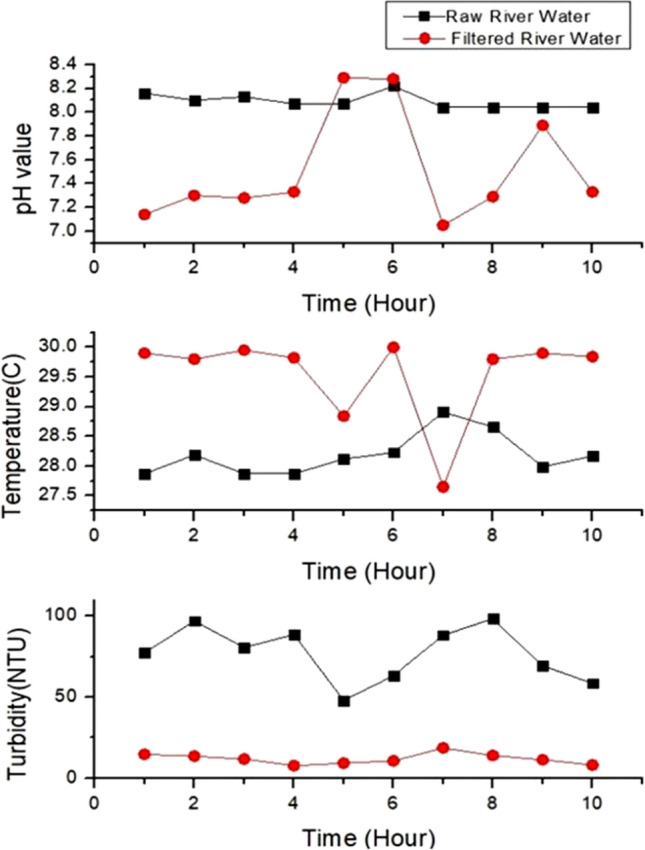
Comparison of water quality parameters for unfiltered and filtered river water
For both lake and river water samples, the turbidity level decreases after the water samples go through filtration process. It proves that the water filtration process successfully provides better quality of water. Meanwhile, the pH values for lake and river water after filtration system are neutral. The system filters unwanted particles in the sample such as mud and soil which are the main contributors for high turbidity and pH values. Some abnormal pH values of river sample after filtration are detected due to sensor sensitivity as the electrode of the pH sensor is very susceptible to interference. The temperature of the lake sample after filtration is slightly lower than the unfiltered samples with small fluctuation. Higher temperature of the filtered river water than the unfiltered river water is attributed to the less mud and soil in the samples and surrounding temperature of the filter.
Many studies have been done to improve existing water quality monitoring systems. Kumar et al. (2020) developed a water quality system measuring pH, conductivity, temperature and turbidity which allowed real time monitoring. Demetillo et al. (2019) developed a system for monitoring water quality in a large aquatic area highlighting the usage of the wireless sensor network (WSN). Pasika et al. (2020) applied arduino microcontroller unit (MCU) and interfaced with several physical water parameter sensors to develop a smart water quality monitoring system with cost-effective using IoT. User can monitor the water quality using ThingSpeak platform where data obtained from the system is sent to cloud. However, most of the studies do not analyze the data and do comparison with the national and international standard. Thus, our study is important due to reliable data that can become a good reference to the Malaysia government.
Conclusion
In conclusion, water pollution is a detrimental issue that leads to water cut, health problem and a threat to aquatic life. Monitoring water quality is important to control water pollution. Here, water quality monitoring and filtration system was designed using Proteus software. Arduino was used as the main controller and five sensors were applied to detect physical parameters of water to monitor water quality. The data is analyzed based on three types of water samples, tap water, lake and river in Nilai, Negeri Sembilan, Malaysia. The purpose of this research is to investigate and monitor the turbidity level, pH value, temperature, electrical conductivity and oxidation–reduction potential of three different types of water resources in Malaysia. The study shows that tap water that is supplied to the household, has the safe range of turbidity and pH. The filtered lake and river water which give lower turbidity and neutral pH values than the unfiltered samples prove that the filtration system is crucially needed for the household use. Tap water shows the highest electrical conductivity and oxidation–reduction potential due to chlorine that is used for treating the water. The data analysis is done using box plot and one-way ANOVA test. The ANOVA test shows that the sensing parameters can be used to monitor water quality. The ThingSpeak application gives real-time and continuous water quality monitoring system. The research outcome is important to analyze water quality in Malaysia before it can be safely used by consumers. The system can be upgraded using high endurance and capacity of microcontroller and sensors. Then, it can be applied in the groundwater source or tank at home. We believe the proposed system can assist Malaysia government in closely monitor physical parameters of water quality and indirectly mitigate water pollution issues.
Supplementary Information
Below is the link to the electronic supplementary material.
Acknowledgements
We acknowledge Ministry of Education Malaysia under FRGS grant (FRGS/1/2021/WAB02/USIM/02/1), Universiti Sains Islam Malaysia (USIM) under matching grant (USIM/MG/MMU-PPKMT-ZDA/FKAB/SEPADAN-S/70822) and Faculty of Engineering and Built Environment (FKAB) for the funding and support.
Author contributions
The experiment was done by Nur Afiqah with help from Muhammad Hakim. Wan Zakiah, Irneza and Juliza contribute to literature review and discussion.
Funding
Funding for this project is provided by Ministry of Higher Education, Malaysia under Fundamental Research Grant Scheme (FRGS) (grant code: FRGS/1/2021/WAB02/USIM/02/1) and Universiti Sains Islam Malaysia (matching grant:USIM/MG/MMU-PPKMT-ZDA/FKAB/SEPADAN-S/70822).
Data availability
All data are presented in the manuscript.
Code availability
The coding will be provided if needed.
Declarations
Conflict of interests
The authors declare that they have no competing interests.
Consent to participate
Not applicable.
Consent for publication
Not appplicable.
Ethics approval
Not appplicable.
References
- Aghasian K, Moridi A, Mirbagheri A, Abbaspour A. A conflict resolution method for waste load reallocation in river syatems. Int J of Environ Sci Tech. 2017 doi: 10.1007/s13762-018-1993-3. [DOI] [Google Scholar]
- Alberti G, Zanoni C, Magnaghi LR, Biesuz R. Low-cost, disposable colourimetric sensors for metal ions detection. J Analyt Sci Tech. 2020;11:30. doi: 10.1186/s40543-020-00221-x. [DOI] [Google Scholar]
- Allen M J, Brecher R W, Copes R, Hrudey S E, Payment P (2008) Turbidity and microbial risk in drinking water. Ministerial technical advisory committee
- Alley E. Water quality control handbook. New York: McGraw Hill; 2007. [Google Scholar]
- Alsulaili A, Al-Harbi M, Al-Tawari K. Physical and chemical characteristics of drinking water quality in kuwait: tap vs bottled water. J Eng Res. 2015;3(1):25–50. doi: 10.7603/s40632-015-0002-y. [DOI] [Google Scholar]
- APHA . Standard methods for the examination of water and wastewater. 21. Washington: American Public Health Association; 2005. [Google Scholar]
- Bao JL. Water quality study and its relationship with high tide and low tide at kuantan river. Kuantan: Universiti Malaysia Pahang; 2010. [Google Scholar]
- Bilal H, Ghafoor A, Munir A. Desalination of brackish water using dual acting solar still. J Eng Res. 2016;4(4):178–193. [Google Scholar]
- Delgado A, Jiminez J, Ochoa L, Mendiola L, Alvarado A, Huamani EL. Applying grey systems to analyze water quality on the river. Int J Emerging Trends in Eng Res. 2020;8(7):3880–3886. doi: 10.30534/ijeter/2020/156872020. [DOI] [Google Scholar]
- Demetillo AT, Japitana MV, Taboada EB. A System for monitoring water quality in a large aquatic area using wireless sensor network technology. Sustain Environ Res. 2019;29:12. doi: 10.1186/s42834-019-0009-4. [DOI] [Google Scholar]
- DeZuane J. Handbook of drinking water quality. 2. New York: John Wiley & Sons; 1997. [Google Scholar]
- Elsheikh MA, Saleh HI, Elmala Y. Performance of filtration systems to enhance treated water quality. J Eng App Sc. 2018;65(2):125–137. [Google Scholar]
- Engineering Services Division . Drinking water quality standard. Malaysia: Ministry of Health Malaysia; 2016. [Google Scholar]
- Fondriest Environmental (2013) Fondriest environmental learning centre - pH of Water. Fondriest environmental inc. retrieved December 10, 2020, from https://www.fondriest.com/environmental-measurements/parameters/water-quality/ph/
- EPA (2012) 5.9 Conductivity In water: monitoring and assessment. Retrieved July 09, 2021, from http://water.epa.gov/type/rsl/monitoring/vms59.cfm
- Galal MM, Soliman A, Kamel G, Zaher K, El-Fakharany Z. Prediction and assessment of surface water quality effect on groundwater in El-Qaluybia. Egypt J Eng App Sc. 2020;67(8):2129–2148. [Google Scholar]
- Huang Y F, Ang S Y, Lee K M, Lee T S (2015) Quality of water resources in Malaysia. In:research and practices in water quality. Rijeka: IntechOpen. 10.5772/58969
- Huron river watershed council (2013) conductivity the activity. Retrieved July 09, 2021, from http://www.hrwc.org/wp-content/uploads/2013/02/Conductivity-v2.pdf
- Jabatan Alam Sekitar . Malaysia environmental quality report 2017 - river water quality. Malaysia: Ministry of Environment and Water; 2018. [Google Scholar]
- Jabatan Alam Sekitar . National water quality standard. Malaysia: Ministry of Environment and Water; 2019. [Google Scholar]
- Khalit AR. Current state of water environment in Malaysia. Malaysia: Conservation and Environment Management Division KeTSA; 2008. [Google Scholar]
- Kremer M (2018) Water quality 101: what is ORP in water testing? Jenco. Retrieved Aug 02, 2021, from https://blog.jencoi.com/what-is-orp-in-water-testing
- Kumar SS, Subba Rao BV, Prasad JR. Design and development of a water quality monitoring system by using IoT. Int J Emerging Trends in Eng Res (IJRTE) 2020;8(9):6441–6447. doi: 10.30534/ijeter/2020/245892020. [DOI] [Google Scholar]
- Matin M A, Islam M M (2012) Overview of wireless sensor network. In: wireless sensor networks - technology and protocols Malaysia. IntechOpen 10.5772/49376.
- Najah A, Teo FY, Chow MF, Huang YF, Latif SD, Abdullah S, Ismail M, El-Shafie A. Surface water quality status and prediction during movement control operation order under COVID-19 pandemic: case studies in Malaysia. Int J Environ Sc Technol. 2021;18:1009–1018. doi: 10.1007/s13762-021-03139-y. [DOI] [PMC free article] [PubMed] [Google Scholar]
- Ostertagova E, Oskar O. Methodology and Application of One-way ANOVA. American J Mechanical Eng. 2013;1(7):256–261. doi: 10.12691/ajme-1-7-21. [DOI] [Google Scholar]
- Pasika S, Gandla ST. Smart water quality monitoring system with cost-effective using IoT. Heliyon. 2020;6(7):1–9. doi: 10.1016/j.heliyon.2020.e04096. [DOI] [PMC free article] [PubMed] [Google Scholar]
- Potter K (2006) Methods for presenting statistical information: the box plot. Retrieved 2 Aug 2021, from https://www.sci.utah.edu/~kpotter/publications/potter-2006-MPSI.pdf
- Raril C, Manjunatha JG. Fabrication of novel polymer-modified graphene-based electrochemical sensor for the determination of mercury and lead ions in water and biological samples. J Analytical Sc Tech. 2020;11:3. doi: 10.1186/s40543-019-0194-0. [DOI] [Google Scholar]
- Sullivan L (2021) The ANOVA approach. hypothesis testing – analysis of variance (ANOVA). Boston university school of public health. Retrieved August 02, 2021, from https://sphweb.bumc.bu.edu/otlt/MPH-Modules/BS/BS704_HypothesisTesting-ANOVA/BS704_HypothesisTesting-Anova_print.html
- Supriyono H, Majid A, Harismah K. Portable system for coastal fishpond water quality telemonitoring continuously. Int J Emerging Trends Eng Res. 2020;8(9):5163–5170. doi: 10.30534/ijeter/2020/45892020. [DOI] [Google Scholar]
- Tavakoly Sany SB, Monazami G, Rezayi M, Borgheipour H. Application of water quality indices for evaluating water quality and anthropogenic impact assessment. Int J Environ Sc Technol. 2018;16:3001–3012. doi: 10.1007/s13762-018-1894-5. [DOI] [Google Scholar]
- Tomar M. Water and wastewater. Boca Raton: CRC Press; 1999. [Google Scholar]
- Wetzel RG. Limnology: lake and river ecosystems. 3. San Diego: Academic Press; 2001. [Google Scholar]
- WHO . Guidelines for drinking water quality. Geneva: World Health Organisation; 2011. [Google Scholar]
- WHO. (2017). Water quality and health - review of turbidity: information for regulators and water suppliers. World Health Organisation
- Yousefi H, Omidi M, Moridi A, Sarang A. Groundwater monitoring network design using optimized DRASTIC method and capture zone analysis. Int J of Environ Res. 2021 doi: 10.1007/s41742-021-00348-8. [DOI] [Google Scholar]
- Zare Farjoudi S, Moridi A, Sarang A. Multi-objective waste load allocation in river system under inflow uncertainty. Int J of Environ Sc and Tech. 2020 doi: 10.1007/s13762-020-02897-5. [DOI] [Google Scholar]
Associated Data
This section collects any data citations, data availability statements, or supplementary materials included in this article.
Supplementary Materials
Data Availability Statement
All data are presented in the manuscript.
The coding will be provided if needed.