

Abstract
Purpose
With age, human retinal pigment epithelium (RPE) accumulates bisretinoid fluorophores that may impact cellular function and contribute to age-related macular degeneration (AMD). Bisretinoids are comprised of a central pyridinium, dihydropyridinium, or cyclohexadiene ring. The pyridinium bisretinoid A2E has been extensively studied, and its quantity in the macula has been questioned. Age-changes and distributions of other bisretinoids are not well characterized. We measured levels of three bisretinoids and oxidized A2E in macula and periphery in human donor eyes of different ages.
Methods
Eyes (N = 139 donors, 61 women and 78 men, aged 40–80 years) were dissected into 8 mm diameter macular and temporal periphery punches. Using liquid chromatography – electrospray ionization – mass spectrometry (LC-ESI-MS) and an authentic synthesized standard, we quantified A2E (ng). Using LC-ESI-MS and a 50-eye-extract of A2E, we semiquantified A2E and 3 other compounds (eye extract equivalent units [EEEUs): A2-glycerophosphoethanolamine (A2GPE), dihydropyridine phosphatidyl ethanolamine (A2DHPE), and monofuranA2E (MFA2E).
Results
A2E quantities in ng and EEEUs were highly correlated (r = 0.97, P < 0.001). From 262 eyes, 5 to 9-fold higher levels were observed in the peripheral retina than in the macula for all assayed compounds. A2E, A2DHPE, and MFA2E increased with age, whereas A2GPE remained unaffected. No significant right-left or male-female differences were detected.
Conclusions
Significantly higher levels were observed in the periphery than in the macula for all assayed compounds signifying biologic differences between these regions. Levels of oxidized A2E parallel native A2E and not the distribution of retinal illuminance. Data will assist with the interpretion of clinical trial outcomes of agents targeting bisretinoid-related pathways.
Keywords: A2E, bisretinoids, age-related macular degeneration (AMD), macula, liquid chromatography – electrospray ionization – mass spectrometry (LC-ESI-MS), retinal pigment epithelium (RPE)
Lipofuscin accumulation is an important change in the retinal pigment epithelial (RPE) layer over the lifespan.1–4 The relationship between the age-related functional changes of RPE and the accumulation of lipofuscin is still being elucidated.5–13
Photoreceptor cell outer segments (POS) shed their tips on a daily basis and are phagocytosed by RPE cells.14,15 POS material accumulate in the RPE as aggregates called lipofuscin (i.e. long-lasting membrane-bounded inclusion bodies that emit strong autofluorescence signal when excited by blue-green light). Lipofuscin accumulation starts in childhood and increases throughout life.3,14,15 Lipofuscin granules are of relatively uniform size and electron density and localize to the apical three/fourths of the RPE cell bodies with a few in apical processes.3,8,16–20 RPE lipofuscin is composed of fluorescent bisretinoid adducts.6 The topographical distribution of autofluorescent material parallels that of rod outer segments (ROS) within the retina.17,18 Similar to rod cells, autofluorescent granules concentrate at the edge of the macula and decline toward both the periphery and the fovea.16,18 Foveal autofluorescence is not zero and may relate to high concentrations of melanolipofuscin granules in the RPE cell bodies.16
The role that lipofuscin and melanolipofuscin might play in age-related macular degeneration (AMD), a prevalent disease of older adults, is under discussion.21,22 Further, fundus autofluorescence is a clinically important diagnostic tool for disease detection, for which bisretinoids in the RPE lipofuscin and melanolipofuscin are believed to be the major signal sources.23–25 Among the bisretinoid components of human RPE lipofuscin (Fig. 1), A2E is the first identified and most extensively characterized.26–32 A2E exists with its structural isomers iso A2E.29,30,33 Levels of A2E were observed to be significantly increased with age in whole RPE/choroid samples of human eyes.29 Recent studies have indicated significant regional variation in bisretinoids, including lower A2E signal in the macula than in the periphery.26–28,34,35
Figure 1.

Biosynthetic pathway for studied bisretinoids. POS, photoreceptor outer segment; RPE, retinal pigment epithelium. The pathway is comprised of pyridinium bisretinoids A2E (I), A2GPE (2), a dihydropyridinium bisretinoid A2DHPE (4) and 2 cyclohexadiene bisretinoids atRALdi and atRALdi-E along with monofuran-A2E (4). Compounds 1 to 4 were analysed in this study. Abbreviations: A2E, N-retinylidene-N-retinylethanolamine; A2GPE, A2-glycerophosphoethanolamine; A2DHPE, dihydropyridine phosphatidyl ethanolamine; atRALdi, all trans retinal dimer; atRALdi-E, all trans retinal dimer ethanolamine; PE, phosphatidylethanolamine, MW, molecular weight in g/mol; PLD, phospholipase D. (References: Fishkin et al., 2005; Jang et al., 2005; Sparrow et al., 2012; Ueda et al., 2016; Yamamoto et al., 2011; Parish et al., 1998;Wu et al., 2009; Wu et al., 2013).
Other bisretinoids have also been structurally characterized29,32,36–44 (Fig. 1). These include A2-glycerophosphoethanolamine (A2GPE), dihydropyridine phosphatidyl ethanolamine (A2DHP-PE), all trans retinal dimer (ATRD), and all trans retinal dimer ethanolamine (ATRDE). The bisretinoids A2E and A2DHP-PE originate from same biosynthetic pathways of N-retinylidene-phosphatidylethanolamine followed by formation of the same intermediate through 6-aza electrocyclization. Subsequently, a phospholipase D (PLD) mediated pathway leads to the formation of either A2E or A2DHPE, which possess pyridinium and dihydropyridinium rings, respectively,29,39 whereas A2GPE is formed from glycerophosphoethanolamine when reacted with all-trans retinal. Two studies have suggested that some bisretinoids may be more abundant then A2E.41,44 Apart from A2E, other bisretinoid compounds were not previously analyzed for potential regional differences in distribution, as they were identified in the RPE choroid of whole eyecups only.
Understanding the role of bisretinoids in AMD progression as well as interpretation of clinical autofluorescence imaging would benefit from information of how bisretinoids vary with age and the retinal region.21,22 To quantify bisretinoids, liquid chromatography – electrospray ionization – mass spectrometry (LC-ESI-MS) is an advantageous technique, because of high sensitivity and specificity.27–29 We recently synthesized and purified A2E and developed an LC-ESI-MS method for A2E quantification in human donor eyes.45 Further, this LC-ESI-MS method was applied to tissue extracts for a novel semiquantitative analysis of the bisretinoids A2E, A2GPE, and A2DHPE along with MFA2E. In this report, this method has been used to quantify the levels of these compounds using LC-ESI-MS, in the macula and the peripheral RPE from a large sample of donor eyes with healthy retinas, ranging in age from 40 to 80 years.
Materials and Methods
Chemicals
All-trans retinal was purchased from Sigma–Aldrich (St. Louis, MO, USA). Analytical-grade formic acid, ethanolamine, glacial acetic acid, ethanol, acetonitrile, and trifluoroacetic acid were purchased from Merck (Darmstadt, Germany). An A2E standard was prepared using microwave assisted synthesis45 and purified using liquid partitioning.46 The concentration was determined by dissolving A2E in pure methanol and then subjecting it to UV spectroscopy at λmax 439 nm (εM 36,900). Water (18.2 MΩ) was purified using a Milli-Q purification system (Millipore Corp., Bedford, MA, USA). All other chemicals and solvents used were of the highest analytical grades available.
Human Donor Eyes
Whole donor eyes were collected during 2015 to 2016 by the Lions’ International Eye Bank, Arvind Eye Hospital, Madurai, and corneas were removed for transplantation. All donors originated from this region in southern India. When possible, both eyes of a donor were used for analysis. In some cases, one eye of a donor was not available because the cornea was not eligible for transplantation. Time between death and processing was less than 6 hours. Fundi deemed to lack visible pathology by eye bank personnel were considered for this study. Vitreous was removed carefully, and an 8 mm diameter trephine was used to create full-thickness (retina-RPE-choroid-sclera) punches of macula and temporal periphery. The macular punch was centered on the fovea, and the peripheral punch was collected 2 mm away from the macular sample (i.e. centered 10 mm temporal to the fovea). The retina was removed from the RPE, and the RPE-choroid was removed from the sclera. Then, RPE-choroid samples were transferred to pre-weighed micro centrifuge tubes and stored at −80⁰C until processed.
Tissues were handled in accordance with the tenets of the Declaration of Helsinki. The study protocol was approved by the Institutional Review Board of Arvind Eye Hospital and Arvind Medical Research Foundation, Madurai (IRB # RES2011002BAS) and subsequently by the human ethics board of All India Institute of Medical Sciences, New Delhi (IRB # IESC/T-347/23.06.2015). The written consent of the donor or next of kin was also obtained by eye bank personnel.
Tissue Processing
Bisretinoids were extracted from the macular and peripheral retina RPE–choroid tissues using a previously described method.47 Briefly, tissues were homogenized with 1:1 chloroform/methanol (2 mL) and 0.01 M phosphate-buffered saline (PBS, 1 mL). Thereafter, the organic layer was separated and was evaporated to dryness. Residues were transferred on dry ice to the analysis site (AIIMS, New Delhi). The samples were then reconstituted with methanol and analyzed with LC-ESI-MS.
Instruments and Techniques Used
A2E was synthesized in the dark using a commercial microwave synthesizer “Microwave 300” (Anton Paar GmbH, Austria). To scale up A2E synthesis45 all-trans retinal (100 mg equivalent to 352 µmol) and ethanolamine (9.5 µL; 155 µmol) were added in ethanol (3 mL) in the presence of acetic acid (9.3 µL; 155 µmol) using stochiometric ratios as described.29 Further, large scale purification was achieved using liquid partitioning46 to obtain HPLC pure A2E.
Chromatography separation and peak monitoring were achieved using an ultrahigh performance liquid chromatography (UPLC; Thermo Accela; Thermo Electron Corp., Waltham, MA, USA) system with a quaternary pump connected to an online degasser and photodiode array detector (PDA). The UPLC system was coupled with a tandem mass spectrometer (4000 Q-Trap; AB Sciex Biosystems, Foster City, CA, USA). ChromQuest software version 4.1 (San Jose, CA, USA) was used to control all parameters of UPLC. For analytical separations, an Xterra RP 18 column was used (4.6 × 150 mm with 5 µm particle size; Waters, Milford, MA, USA). Ionization of analytes was accomplished by electrospray ionization (ESI; TurboIon Spray; ABSciex) operating in the positive ion mode followed by tandem mass spectrometric analysis. Data acquisition and integration were performed by Analyst 1.5.2 software (ABS Biosystems, Foster City CA, USA).
Semiquantification of Bisretinoids in Macular and Peripheral Human RPE-Choroid by Single Ion Monitoring Mode in LC-ESI-MS
Quantitative determination of bisretinoids was carried out in selected ion monitoring (SIM) mode of LC-ESI-MS. Briefly, the chromatographic separation was achieved by gradient elution using water and methanol containing 0.1% trifluoroacetic acid (TFA) using X-terra RP-18 column at 80% methanol (0–4 minutes), 80% to 96% methanol (4–12 minutes), 96% methanol (12–14 minutes), 96% to 100% methanol (14–16 minutes), 100% methanol (16–19 minutes), 100% to 80% methanol (19–20 minutes), and 80% methanol (20–22 minutes) with a flow rate of 600 µL/minutes. Based on the expected structures, the ions for A2E (M+ m/z of 592.4), 2DHPE [M+H] m/z of 594.9, MFA2E with [M+] m/z of 608.4, and A2GPE with [M+] m/z of 746.9 were optimized for all source- and compound-dependent parameters using Analyst version 1.5.2 built in algorithm for maximum ion intensity in ESI MS. For collision energy, nitrogen at an arbitrary unit of 3 (as per the manufacturer's grading) was used.
Preparation of Standard Calibration Curve for the Quantification of A2E
The concentration of purified synthetic A2E was calculated by taking absorbance using UV spectrophotometer at λmax 439 nm (εM 36,900) in pure methanol.29 Separate stock solutions of A2E and sulfadimethoxine (Internal Standard) were prepared at concentrations of 1 mg/mL in methanol. These stock solutions were appropriately diluted with pure methanol containing 0.1% formic acid to reach the required lower working concentrations. A working solution of internal standard was used at the concentration of 50 ng/mL in 100% methanol. A calibration curve for A2E was plotted by taking concentrations ranging from 0.9 ng/mL to 250 ng/mL on the x-axis and ratio of peak height for analyte/internal standard on the y-axis.
Preparation of Calibration Curve for Non-A2E Bisretinoids
Although the synthesis of individual bisretinoids is available in literature, the prototype A2E was synthesized and used to validate a semiquantification method for other compounds. Such a semiquantification method could facilitate analysis and enhance our understanding of individual bisretinoids.
A method for semiquantification of bisretinoid compounds was validated as described by Kotnala et al.45 A tissue extract was generated from the pooled RPE-choroid extracts of 50 randomly selected samples from the macular and peripheral punches. This extract, considered a stock solution, was concentrated using rotary evaporator, reconstituted with 1 mL of methanol, and stored at −70°C. This stock solution was serially diluted with pure methanol containing 0.1% formic acid to reach the required lower working concentrations. A working solution of sulfadimethoxine as internal standard was used at the concentration of 50 ng/mL in 100% methanol.
A calibration curve was plotted using the peak area of analytes in LC-ESI-MS chromatograms obtained from the pool of macular and peripheral extracts. A standard calibration curve was plotted from a serial dilution of the 50 eye extract in factors of 2 (halved, quartered, etc). The standard calibration curve was plotted by taking the peak area in ordinate (“Y” axis) and number of eyes used in abscissa (“X” axis). Hence, eye extract equivalent units (EEEUs) denote the mass in ng of individual bisretinoid compounds found in one eye, using A2E levels in the 50-eye extract (see above) as a reference.
We validated this approach by comparing A2E expressed in ng to A2E expressed in EEEUs in the same samples, with the expectation that these would be highly correlated. This analysis revealed that eyes processed in 2014 (N = 118) had internally inconsistent values, whereas eyes processed in 2015 to 2016 had consistent values as expected (see Results section). Thus, we report only analyses performed in 2015 to 2016.
This analysis assumes that each individual compound tracked A2E in an internally consistent way. Whether all compounds tracked either other (i.e. they were up- or down-regulated together), is a separate question and beyond the scope of this study.
Statistical Analysis
We included in the analysis donor eyes that have at least one A2E measurement. We reported medians and interquartile ranges (IQRs) for all bisretinoid measurements, reported P values using the Kruskal-Wallis test to assess the differences of bisretinoids measurements among different groups, and reported Spearman's rank correlation coefficient to assess the association between two continuous variables. We also used box plots and scatter plots to visualize the distribution of continuous variables and their relationships with log-transformation on axes where appropriate. All statistics are computed on complete cases. The P values are reported without family or group adjustment. Statistical analysis was conducted using R (version 4.03) and graphs were created using R package “ggplot2.”48,49
Results
Demographics of Donors and Eyes
As shown in Table 1, eyes from 139 human donors, with 61 (43.9%) women, were available for the quantification of bisretinoids. Donor eyes by age group and sex are shown in Table 2. A total of 262 eyes from 139 right eyes and 123 left eyes was analyzed. For 16 donors (11.5%), only one eye was available. For analysis, the samples were categorized into younger and older age groups of <60 and ≥60 years. There were 136 eyes in the <60 age group comprised of 66 left eyes and 70 right eyes. In the ≥60 age group, there were 126 eyes with 57 left eyes and 69 right eyes. There were 149 male eyes (71 left eyes and 78 right eyes) and 113 female eyes (52 left eyes and 61 right eyes).
Table 1.
Demographics of Eye Donors
| Age, y | Overall | Male | Female |
|---|---|---|---|
| 10–39 | 1 | 1 | 0 |
| 40–59 | 69 | 39 | 30 |
| 60–79 | 61 | 35 | 26 |
| 80–100 | 8 | 3 | 5 |
| <60 | 70 | 40 | 30 |
| ≥60 | 69 | 38 | 31 |
Table 2.
Study Eyes Stratified by Age and Sex
| Variable | Level | Overall | Left Eye | Right Eye |
|---|---|---|---|---|
| N | 262 | 123 | 139 | |
| Age grouping I | 10–39 | 2 | 1 | 1 |
| 40–59 | 134 | 65 | 69 | |
| 60–79 | 112 | 51 | 61 | |
| 80+ | 14 | 6 | 8 | |
| Age grouping II | <60 | 136 | 66 | 70 |
| ≥60 | 126 | 57 | 69 | |
| Sex | M | 149 | 71 | 78 |
| F | 113 | 52 | 61 |
Quantification of A2E in the Macula and Peripheral Human Retina Using Synthesized Standard by Selected Ion Monitoring Mode in LC-ESI-MS
As shown in Figure 2 and Table 3, A2E was quantified using liquid chromatography – electrospray ionization – tandem mass spectrometry (LC-ESI-MS/MS) in reference to a synthetic standard in 233 macula and 255 peripheral RPE-choroid samples in 139 human donors. In the macula, the lowest levels of A2E were detected at 0.4 ng up to 63.27 ng. In the periphery, the range of A2E was observed from 1.09 ng to 202.9 ng. The macula samples had a median of 2.4 ng and IQR of 0.93 to 7.25, whereas peripheral samples had a median of 27.5 ng and IQR of 0.93 to 7.25. The difference observed in the macular and peripheral levels of A2E was significant (P < 0.0001, Kruskall-Wallis test). The median same-eye ratio of periphery to macula was 9.2 (IQR: 4.4–25.2).
Figure 2.
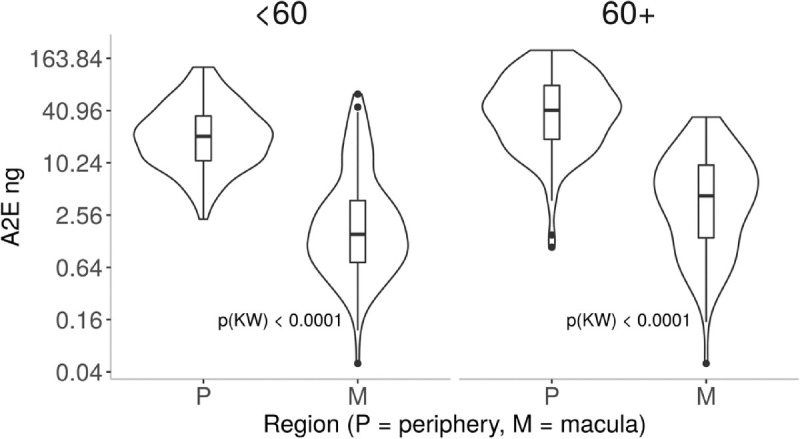
A2E (ng) in macular and peripheral samples of 262 eyes of 139 donors. Box and whisker plot shows A2E quantified using a synthetic standard in macula and peripheral retina by donors <60 and ≥60 years of age. Y-axis is log-transformed for display. The P values are reported as a Kruskal-Wallis rank test between P(eripheral) and M(acula) within groups. Because the differences between M and P are so significant, all P values are less than 0.0001.
Table 3.
A2E (ng) in Macular and Peripheral Samples Using Synthesised Standard
| Variable | Level | N | Median (IQR) | P (KW) |
|---|---|---|---|---|
| Eye | LE | 224 | 11.6 (2.8, 30.8) | 0.8736 |
| RE | 264 | 11.6 (2.4, 31.5) | ||
| Region | Per | 255 | 27.5 (13.9, 53.1) | |
| Mac | 233 | 2.4 (0.9, 7.3) | <0.0001 | |
| Sex | M | 276 | 10.7 (2.3, 27.3) | |
| F | 212 | 13.2 (3.3, 36.5) | 0.0608 | |
| Age group | <60 | 252 | 9.6 (1.8, 24.3) | |
| ≥60 | 236 | 14.4 (4.1, 44.3) | <0.0001 | |
| M | <60 | 121 | 1.5 (0.7, 3.8) | |
| ≥60 | 112 | 4.3 (1.4, 9.8) | 0.0001 | |
| P | <60 | 131 | 20.9 (10.9, 35.4) | |
| ≥60 | 124 | 40.7 (19.1, 78.2) | <0.0001 |
LE, left eye; RE, right eye; P, periphery; M, macula; M, male; F, female; IQR, interquartile range; KW, Kruskall-Wallis test.
To investigate the levels of A2E with age, samples from donors <60 years of age (n = 252) were compared to donors ≥60 years of age (n = 236; see Table 3). The younger age group had median A2E levels of 9.6 ng and IQR of 1.79 to 24.3. The older age group had median A2E levels of 14.4 and IQR of 4.07 to 44.3. Levels of A2E observed in donors ≥60 years were significantly higher than levels <60 years (P <0.0001). The within-eye periphery to macula ratio in younger eyes had a median of 11.7 (IQR: 4.7–25.5) and lower, at 8 (IQR: 4.3–23.7), in older eyes. This difference in ratio occurred because macular A2E levels were 2.9-fold higher in donors ≥60 years than in donors <60 years (4.3 ng vs. 1.5 ng), whereas peripheral A2E levels were only 2.0-fold higher in older versus younger donors (40.7 vs. 20.9 ng).
To investigate sex differences in A2E levels, samples from male and female donors were evaluated separately, as shown in Supplementary Table S1. There were 276 macular samples from male donors with a median A2E levels of 10.7 ng and IQR of 2.26 to 27.3. In 212 macular samples from female donors, a median A2E of 13.2 ng and IQR of 3.27 to 36.5 were observed. The differences between samples of male and female donors was not significant. In additioin, we observed similar levels of A2E in left and right eyes (median of 11.6 ng and 2.8, 30.8 IQR in 224 left eyes and a median of 11.6 ng and 2.42, 31.5 IQR in right eyes, Supplementary Table S2).
Comparative Analysis of A2E in Synthesised Standard Versus Relative Quantification
For semiquantification of bisretinoids, a standard calibration curve was plotted using an extract of macula and peripheral retina pooled from 50 donors as described.45 We reasoned that A2E levels in individual samples referenced against synthetic A2E (measured in ng) and referenced against the pooled extract (measured in EEEU/mL) should be correlated. A2E levels measured in these two ways are shown as a scatter plot in Figure 3. These two methods were highly correlated (Spearman's ρ = 0.97, P < 0.001), with scatter increasing at higher absolute levels.
Figure 3.
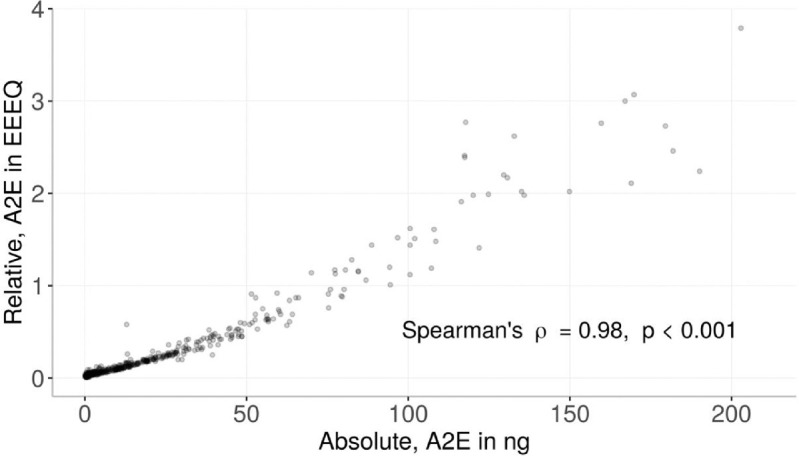
Correlation of A2E referenced to synthetic standard (ng) and 50-eye-extract (EEEQ). X-axis represents A2E (ng) values and Y-axis represents A2E (EEEQ) from same human donors including the macula and peripheral retina with age ranging from 40 to 80 years. The graph shows 259 human eyes (481 absolute-relative paired values from macula and periphery) accessioned 2015 to 2016; 118 eyes accessioned 2014 were omitted. See Methods section for details.
An SIM method of LC-ESI-MS/MS was developed for the simultaneous quantification of bisretinoids in small amounts of donor eye tissue. The simultaneous semiquantitative analysis of multiple extracted bisretinoids from a single injection of a 68-year-old male right eye using LC-ESI-MS/MS is shown in Figure 4. The elution profile for the individual compounds A2E, A2GPE, A2DHPE, and MFA2E with their respective retention time is shown (see Fig. 4) using the SIM mode of LC-ESI-MS/MS. The retention times of individual bisretinoids were previously confirmed based on their fragmentation pattern using multiple reaction monitoring (MRM) mode of quantification in LC-ESI-MS/MS and LC-APCI-MS/MS.52
Figure 4.
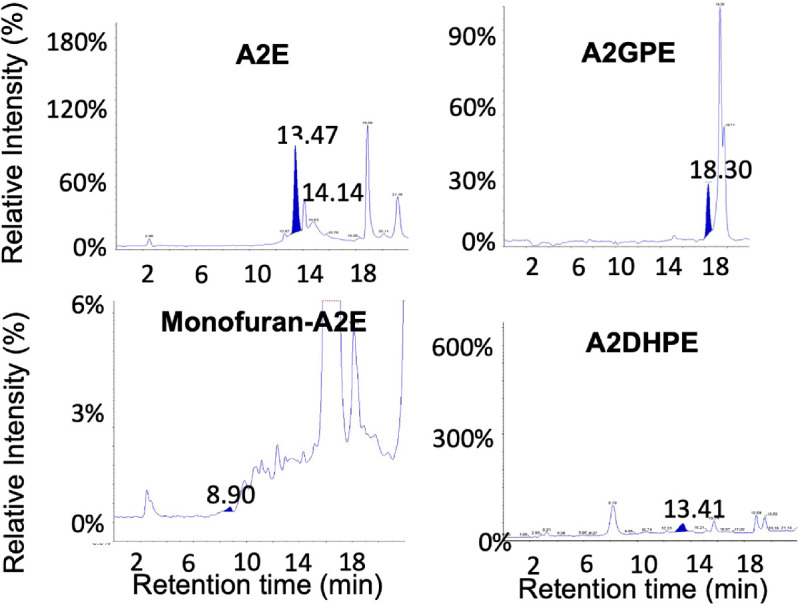
Representative LC-ESI-MS chromatograms using selected ion monitoring mode of quantification. Highlighted blue peaks represent elution profiles of individual bisretinoids including A2E, A2GPE, monofuran-A2E, and A2DHPE from a single chromatographic injection. Retention time is shown on the x-axis and intensity relative to the peak for that compound is shown on the y-axis (please note the different y-axis scales). Data from a 68-year-old male donor.
Semiquantification of Lipofuscin Components in Human Retina Using Selected Ion Monitoring Mode in LC-ESI-MS
Large differences between the macula versus peripheral retina were observed for 4 individual bisretinoids measured in units of EEEU/mL, as shown in Figure 5 and summarized in Supplementary Table S1. The amount of compounds recovered from periphery exceeded macula by 5-fold for A2E, 5.9-fold for A2GPE, 8.8-fold for MFA2E, and 8.3-fold for A2DHPE.
Figure 5.

Bisretinoids in periphery and macula of 139 donor eyes. In the eyes shown in Supplementary Tables S1 and S2, four bisretinoids were detected in macular and peripheral samples of RPE-choroid. All compounds were referenced to A2E recovered in a 50-eye extract. Abundance was expressed in units of EEEQ. Y-axis is log-transformed for display. The difference between macula versus periphery for all four compounds was significant on Kruskal-Wallis test at P < 0.0001.
As shown in Figure 6 and summarized in Supplementary Table S2, the effect of age on bisretinoids levels was less consistent than the regional differences, with 3 compounds increased by age (A2E, A2DHPE, and MFA2E) and 1 compound not affected by age (A2GPE).
Figure 6.
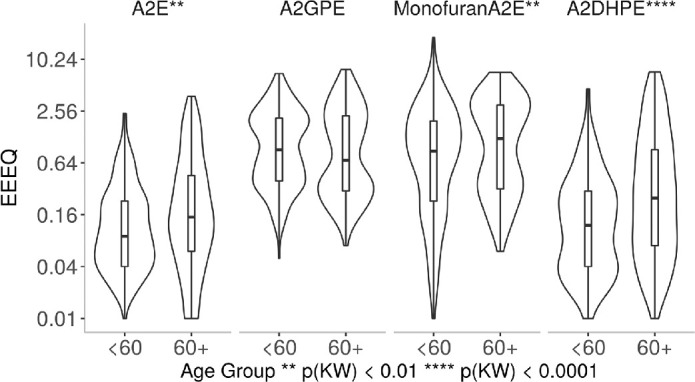
Bisretinoids were compared in eyes of donors <60 year and ≥60 years. A total of 139 donor eyes were used with <60 years (n = 70) and +60 years (n = 69). All compounds were referenced to A2E recovered in a 50-eye extract. Abundance was expressed in units of EEEQ. Y-axis is log-transformed for display. The difference in <60 and +60 years was significant on the Kruskal-Wallis test for A2E, Monofuran A2E, and A2DHPE, no statistical significance was observed for A2GPE.
There was no relationship between any of these compounds and right or left eyes (Supplementary Table S3). A2E was slightly higher in samples from women but did not reach significance. No other compound was related to the sex of the donors (Supplementary Table S4).
Discussion
This study was designed to investigate the role of RPE bisretinoids in relation to age in human donor eyes. Among all studied bisretinoids, A2E has been the most investigated, and its relative abundance in the human macula has been scrutinized.21,22,26–28,35,50 To increase our understanding of well-characterized bisretinoids, for the first time, we measured the levels of three bisretinoids along with A2E in the macula and peripheral retina in the largest sample of human donor eyes yet examined for this purpose. Synthesizing the standards for those components and analyzing them together using a suitable method given the considerable size of the human retina is a challenging task. Therefore, a newly validated method using LC-ESI-MS was adopted to analyze bisretinoids, including A2E, A2GPE, and A2DHPE along with MFA2E from the macula and peripheral retina of 138 eyes of 268 donors.
We previously developed a new and sensitive relative quantification method using 50 human donor macula and peripheral retina pooled extract named as EEEUs for the semiquantification of selected bisretinoids along with A2E from a single chromatographic injection.45 To investigate the validity of the semiquantification method, we first compared A2E quantification using a synthetic standard (ng) versus its relative quantification (EEEQ) and observed a statistically significant correlation between them as shown in Figure 3.
Using both absolute and relative quantification methods, we observed increased levels of A2E with age for both the macula and peripheral retina when samples from donors less than and greater than 60 years of age were compared (see Fig. 2). We also observed 9.6 and 14.4-fold increases in A2E from the studied donor groups in periphery compared to the macula samples in <60 and ≥60 years of age donors, respectively. We then investigated bisretinoid A2GPE and observed 4.8 and 7.1-fold increases in the macula to the peripheral retina in <60 and ≥60 years of age donors, respectively. We observed an increase in A2GPE with age, but the increase was not significant statistically. The bisretinoid A2DHPE was observed to be 6.4- and 12-fold higher in the macula to the periphery, in 60 and ≥60 years donors, respectively. We further investigated the well-characterized oxidation product of A2E formed by addition of one oxygen to A2E, named MFA2E.37,51 We observed its increase with age and 8- and 9.6-fold increases in the macula to peripheral retina in <60 and ≥60 years of age donors, respectively.
Eldred and Katz, in 1988, separated the fluorescent bands from human RPE lipofuscin using thin layer chromatography (TLC). They also showed the RPE fluorophores deposit with age by demonstrating the TLC from 78 and 5 years old human donor.12 Later, they identified a quaternary ammonium compound, which is now known as A2E from one of the TLC-separated fractions from RPE lipofuscin.5,12 Sakai et al. published the correct structure as a bis-substituted pyridinium ring and coined the term A2E.32 A2E and its isomer isoA2E were first synthesized and isolated in extracts of human donors eye cups and was discovered to increase with age in 7 human donors ranging from 44 to 80 years of age by Parish et al.29
Bhosale et al., for the first time, observed an age-wise increase in the levels of A2E in organic extracts of 8 mm punches of the macula and peripheral retina.27 They divided eye donors into 2 groups: <50 years (n = 22) and > 50 years (n = 31) and observed an increase in A2E in the periphery, compared to the macula, by 3.9 and 3.39-fold using LC-ESI-MS/MS.27 Ablonczy et al. further validated the observation of more A2E detected in peripheral retina as compared to the macula using MALDI imaging.26 Another MALDI IMS study showed A2E present in the macula without showing data from peripheral retina.35 Adler et al. also observed an increase in A2E levels with age and a 3 to 6-fold increased peripheral A2E than macula based on HPLC coupled UV-Vis along with MALD-IMS that showed a low intensity for A2E in the macula compared to the periphery.28 A similar A2E distribution was also observed in the monkey.34 Feldman et al. reported that A2E is not the predominant fluorescent molecule of human eyes based on fluorescence spectroscopy.52
Our assayed compounds were all previously discovered and characterized in human eyes, typically in a small number of mid-life donors, assayed as whole eyecup.26–32,38–46 Investigating the levels of other bisretinoids from macula to peripheral retina would increase the understanding of the general trend of bisretinoid formation and to better understand their fate as RPE fluorophores. The higher presence of other bisretinoids along with A2E in peripheral retina remains to be understood. Previous observations detected A2GPE in the organic layer of 2 representative whole eye cups of human RPE/choroid of 45 and 54-year-old donors.53 This study reported a twofold increase in A2GPE from lower to higher age with 25-fold and 15-fold higher A2E as compared to A2GPE.53 Our study investigated 69 donors comprised of 39 men and 30 women from the 40 to 60 years age group. The previous study population was not large enough to show an increase in A2GPE with age.
In 2009, Wu et al. identified and characterized A2DHP-PE and phosphatidyl of dihydropyridine bisretinoids (A2DHPE).39 They compared the levels of A2E and A2-DHP-PE from 2 human donor aged 54 and 64 years, but A2DHPE was not detected in one representative human and bovine RPE sample.39 In addition, PLD-mediated cleavage of A2-DHPPE (to A2-DHPE) was shown to be inefficient, and A2DHPE could not be detected in a pool of 9 bovine neural retinas. Surprisingly, we were able to collect the fragmentation pattern of A2DHPE from a pooled extract of 50 human donor maculas and peripheral retina standard mixture. It was identified based on its fragmentation pattern as shown in the Supplementary Figure S1. The observation was confirmed based on LC-ESI-MS/MS and LC-APCI-MS/MS modes. However, we did not collect the UV visible spectra at the time of analysis, which can be considered as a limitation of the current study.
In 2004, Avalle et al. detected oxidized A2E for the first time from human retinal lipofuscin.51 In 2005, Jang and co-workers detected monoperoxy-A2E in addition to MFA2E in 4 isolated human RPE/choroid samples of 58 to 68 years of age.37 We identified MFA2E in donor eyes ranging from 40 to 80 years of age and found on average 7-fold higher levels in the periphery than in the macula. It is believed that bisretinoids are photosensitizers that generate reactive oxygen species, such as singlet oxygen.37,54,55 These then react on parent molecules generating oxidized species, such as monofuran-A2E. Oxidation progresses to photodegradation as bonds at the oxygen are unstable. Thus, it is possible that photodegradative loss of A2E, A2-GPE, A2-DHP-PE, and other bisretinoids explains reduced levels in the macula relative to the periphery. This interpretation is not supported by the current data. Optics studies from the 1980s determined that retinal illuminance is broadly distributed across the ocular fundus, with nearly uniform light levels out to 50 degrees from the fovea (approximately 14.4 mm, assuming 0.288 mm per degree, i.e. partly including our peripheral tissue punch).56,57 If A2E was originally abundant in the macula and converted to an oxidized form throughout life, we might expect to abundant monofuran-A2E in the macular punch. However, the current studies, like others,26 found that the distribution of the oxidation product monofuran-A2E parallels the abundance of native A2E (i.e. high in the peripheral tissue). This result, along with high levels of other bisretinoids not resulting from oxidation, suggests that differences in the macula and periphery are due to biologic rather than environmental factors, as developed further below.
Our focus on macula-periphery differences in bisretinoids is warranted due to marked regional variation in photoreceptor density (cells/mm2),58 the source of bisretinoid precursors, and known to parallel histologic autofluorescence.17,18 The photoreceptor content overlying the RPE-choroid tissue punches used in this study is demonstrated in Figure 7. Within the macula, photoreceptor abundance decreases from the foveal peak, roughly equally in all directions (see Fig. 7A,C). Our 8-mm diameter macular punch contained both the foveola (all cones and no rods) and the inner slope of a ring of high rod density (approximately 150,000/mm2) at the vascular arcades. Assay of bisretinoid abundance in the all-cone fovea, which is approximately 0.8 mm in diameter, requires techniques with higher spatial resolution than those used here. The peripheral punch was centered at 10 mm temporal to the fovea, where rod and cone densities are 100,000/mm2 and 3800/mm2, respectively (rod:cone ratio, approximately 26). Imaging mass spectrometry applied to flat mounts of RPE-choroid shows an extensive area of high A2E signal at the region of our temporal punch and further anterior,26,59 where rod density is even lower. Thus, the A2E signal is high where the density of both rods and cones is low. This conclusion may apply to the other molecules assayed herein. Figure 7B also demonstrates that, although bisretinoids are autofluorescent and likely signal source(s) for clinical fundus autofluorescence, regional differences like those investigated herein are not yet accessible through clinical imaging. Quantitative autofluorescence includes a reference standard in the light path and reports intensities only within a ring on the inner slope of the rod ring (i.e. within the area of our macular punch).60 Wide field autofluorescence imaging, which does cover both of our sample locations, is not yet quantitative.
Figure 7.
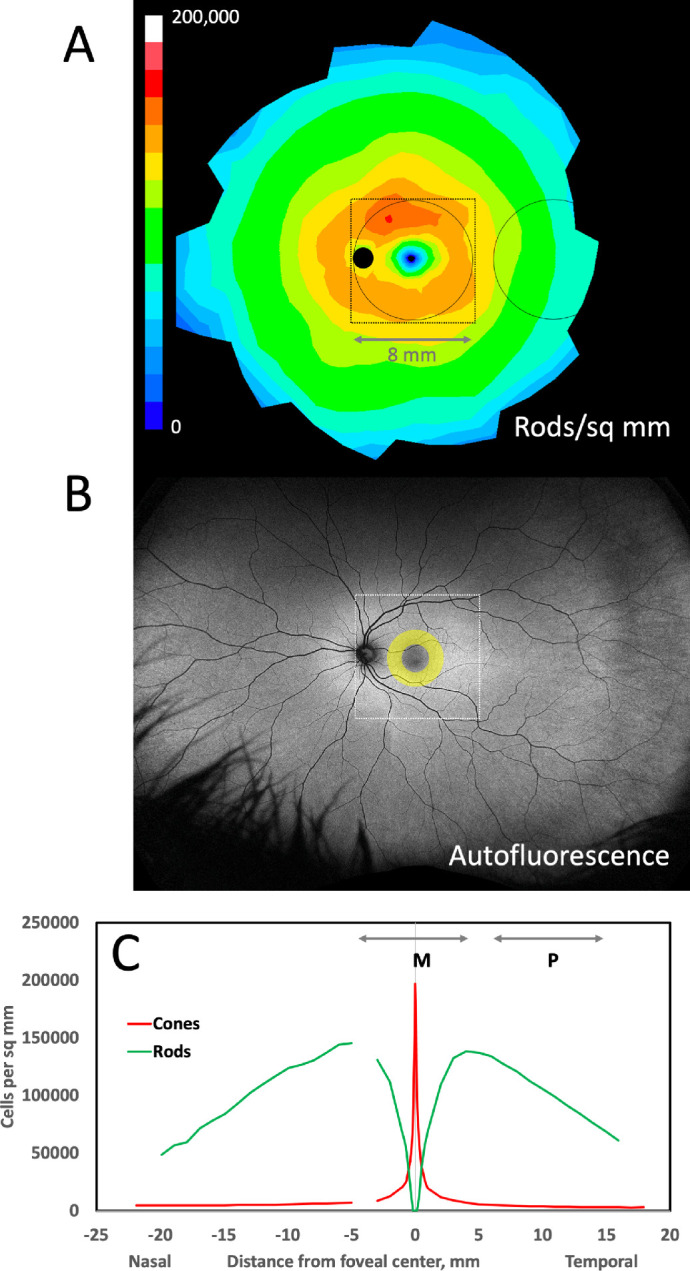
Relationship of rod photoreceptors, fundus autofluorescence, and samples for bisretinoid assay. In (A and B), the optic nerve head is a dark circle, and the fovea is a region of low signal intensity. The circles represent 8 mm diameter tissue punches assayed for bisretinoids in this study, one centered on the macula and one centered in the temporal periphery. The frame (8.64 mm or 30 degrees on a side) indicates the area captured by fundus autofluorescence imaging with a scanning laser ophthalmoscope (Spectralis, Heidelberg Engineering). A Distribution of rods, average of 5 human eyes aged 27 to 37 years, shown as a fundus of a left eye.58 Color scale is linear from 0 to 200,000 cells/ mm2. B Wide-field 488 nm autofluorescence image of a left eye of a 35-year-old adult (California, Optos PLC; courtesy of Dr. Lajos Csincsik). The yellow annulus represents the qAF8 ring where autofluorescence intensity is measured (qAF8) on a Spectralis, shown in the context of pan-retinal autofluorescence. (C) Cones and rods per mm2 along the horizontal meridian in the eyes shown in A. The lines labeled M and P represent the macula and peripheral tissue punches in A. The gap in the nasal retina represents the optic nerve head.
Conclusion
Strengths of this study include a very large number of short postmortem human donor eyes and novel methods for semiquantification of multiple bisretinoids and related compounds. Limitations include the truncated age range that preclude a true lifespan analysis and the possibility of undetected pathology in the samples. Further, while preparing the trephine punches, we did not take special precautions to prevent RPE cells from being dislodged and lost. Nevertheless, this study is an exhaustive investigation of levels of A2E, oxidized A2E, and two intermediates in the macula and peripheral retina of healthy human donors. Low levels of bisretinoids in the macula compared to the peripheral retina is indicative of a consistent trend that has now been reported by multiple studies. It is time to re-think the role of A2E in macular disease. A role for bisretinoids in AMD is difficult to infer because of its lower levels in the macula, the primary region affected in AMD.
Further studies are required to evaluate the role of individual bisretinoids in patients with AMD and in healthy aging macula specifically, especially in melanolipofuscin-rich fovea. Our data are important for interpreting the outcomes of clinical trials for therapeutic approaches targeting bisretinoid pathway components.61 Our data are also important for interpreting studies of visual cycle and bisretinoid biochemistry using whole eyecup preparations of human eyes.62,63 Our data do not rule out undiscovered bisretinoids as major signal sources for clinical fundus autofluorescence imaging. In fact, our data should further propel the search for such compounds. Our findings may help in developing non-invasive methods for early detection and monitoring of AMD, as outcome measures are needed for any targeted therapy. Finally, the role of bisretinoids in outer retinal physiology remain to be explored through future research.
Supplementary Material
Acknowledgments
The authors thank R. Sharmila for assistance in processing cadaver eyes. We acknowledge the Lion's International Eye Bank of Aravind Eye Hospital, Madurai, for providing human donor eyes for this study. The authors thank Kevin L. Schey, PhD, Department of Biochemistry, Vanderbilt University, for helpful discussions and engaging the participation of authors W. Gong and T.G. Stewart through the VICTR program at Vanderbilt (supported by NCATS UL1 TR002243).
Financial support: Department of Science & Technology-Fund for Improvement of S&T Infrastructure in Universities and Higher Educational Institutions (DST-FIST) sponsored High Precision Bio-analytical Facility (HPBAF) and Senior Research Fellowship from Council Of Scientific And Industrial Research (CSIR) (A. Kotnala). This study was supported by SERB-Young Scientist –Life Sciences (SERB-YSS-LS): SR/FT/LS-117/2010 (Dr. S. Senthilkumari). Vanderbilt Institute for Clinical Research (NCATS UL1 TR002243; W. Gong and T.G. Stewart); NIH grant R01EY027948 (A. Kotnala, C.A. Curcio), Heidelberg Engineering (C.A. Curcio); institutional support to University of Alabama at Birmingham from EyeSight Foundation of Alabama and Research to Prevent Blindness Inc (C.A. Curcio).
Meeting presentation: 2017 ARVO ASIA.
Disclosure: A. Kotnala, None; S. Senthilkumari, None; G. Wu, None; T.G. Stewart, None; C.A. Curcio, Genentech/Hoffman La Roche (F), Heidelberg Engineering (F), Regeneron (F); N. Halder, None; S.B. Singh, None; A. Kumar, None; T. Velpandian, None
References
- 1. Katz ML, Robison WG Jr. What is lipofuscin? Defining characteristics and differentiation from other autofluorescent lysosomal storage bodies. Arch Gerontol Geriatr. 2002; 34(3): 169–184. [DOI] [PubMed] [Google Scholar]
- 2. Strauss O. The retinal pigment epithelium in visual function. Physiol Rev. 2005; 85(3): 845–881. [DOI] [PubMed] [Google Scholar]
- 3. Kennedy CJ, Rakoczy PE, Constable IJ. Lipofuscin of the retinal pigment epithelium: a review. Eye (Lond). 1995; 9(Pt 6): 763–771. [DOI] [PubMed] [Google Scholar]
- 4. Bok D. The retinal pigment epithelium: a versatile partner in vision. J Cell Sci Suppl. 1993; 17: 189–195. [DOI] [PubMed] [Google Scholar]
- 5. Eldred GE, Lasky MR. Retinal age pigments generated by self-assembling lysosomotropic detergents. Nature. 1993; 361(6414): 724–726. [DOI] [PubMed] [Google Scholar]
- 6. Sparrow JR, et al.. The bisretinoids of retinal pigment epithelium. Prog Retin Eye Res. 2012; 31(2): 121–135. [DOI] [PMC free article] [PubMed] [Google Scholar]
- 7. Blasiak J. Senescence in the pathogenesis of age-related macular degeneration. Cell Mol Life Sci. 2020; 77(5): 789–805. [DOI] [PMC free article] [PubMed] [Google Scholar]
- 8. Bermond K, et al.. Autofluorescent Granules of the Human Retinal Pigment Epithelium: Phenotypes, Intracellular Distribution, and Age-Related Topography. Invest Ophthalmol Vis Sci. 2020; 61(5): 35. [DOI] [PMC free article] [PubMed] [Google Scholar]
- 9. Orellana-Rios J, et al.. Quantitative fundus autofluorescence in non-neovascular age-related macular degeneration. Ophthalmic Surg Lasers Imaging Retina. 2018; 49(10): S34–S42. [DOI] [PubMed] [Google Scholar]
- 10. Wolf G. Lipofuscin and macular degeneration. Nutr Rev. 2003; 61(10): 342–346. [DOI] [PubMed] [Google Scholar]
- 11. Chio KS, et al.. Peroxidation of subcellular organelles: formation of lipofuscinlike fluorescent pigments. Science. 1969; 166(3912): 1535–1536. [DOI] [PubMed] [Google Scholar]
- 12. Eldred GE, Katz ML. Fluorophores of the human retinal pigment epithelium: separation and spectral characterization. Exp Eye Res. 1988; 47(1): 71–86. [DOI] [PubMed] [Google Scholar]
- 13. Eldred GE, Katz ML. The lipid peroxidation theory of lipofuscinogenesis cannot yet be confirmed. Free Radic Biol Med. 1991; 10(6): 445–447. [DOI] [PubMed] [Google Scholar]
- 14. Kevany BM, Palczewski K. Phagocytosis of retinal rod and cone photoreceptors. Physiology (Bethesda). 2010; 25(1): 8–15. [DOI] [PMC free article] [PubMed] [Google Scholar]
- 15. Kwon W, Freeman SA. Phagocytosis by the retinal pigment epithelium: recognition, resolution, recycling. Front Immunol. 2020; 11: 604205. [DOI] [PMC free article] [PubMed] [Google Scholar]
- 16. Feeney-Burns L, Hilderbrand ES, Eldridge S. Aging human RPE: morphometric analysis of macular, equatorial, and peripheral cells. Invest Ophthalmol Vis Sci. 1984; 25(2): 195–200. [PubMed] [Google Scholar]
- 17. Wing GL, Blanchard GC, Weiter JJ. The topography and age relationship of lipofuscin concentration in the retinal pigment epithelium. Invest Ophthalmol Vis Sci. 1978; 17(7): 601–607. [PubMed] [Google Scholar]
- 18. Ach T, et al.. Quantitative autofluorescence and cell density maps of the human retinal pigment epithelium. Invest Ophthalmol Vis Sci. 2014; 55(8): 4832–4841. [DOI] [PMC free article] [PubMed] [Google Scholar]
- 19. Boulton ME. Studying melanin and lipofuscin in RPE cell culture models. Exp Eye Res. 2014; 126: 61–67. [DOI] [PMC free article] [PubMed] [Google Scholar]
- 20. Pollreisz A, et al.. Atlas of Human Retinal Pigment Epithelium Organelles Significant for Clinical Imaging. Invest Ophthalmol Vis Sci. 2020; 61(8): 13. [DOI] [PMC free article] [PubMed] [Google Scholar]
- 21. Smith RT, Bernstein PS, Curcio CA. Rethinking A2E. Invest Ophthalmol Vis Sci. 2013; 54(8): 5543. [DOI] [PMC free article] [PubMed] [Google Scholar]
- 22. Sparrow JR, Dowling JE, Bok D. Understanding RPE Lipofuscin. Invest Ophthalmol Vis Sci. 2013; 54(13): 8325–8326. [DOI] [PMC free article] [PubMed] [Google Scholar]
- 23. Schmitz-Valckenberg S, et al.. Fundus autofluorescence imaging. Prog Retin Eye Res. 2020; 81: 100893. [DOI] [PubMed] [Google Scholar]
- 24. Sauer L, et al.. Review of clinical approaches in fluorescence lifetime imaging ophthalmoscopy. J Biomed Opt. 2018; 23(9): 1–20. [DOI] [PMC free article] [PubMed] [Google Scholar]
- 25. Orellana-Rios J, et al.. Translational Retinal Imaging. Asia Pac J Ophthalmol (Phila). 2020; 9(3): 269–277. [DOI] [PMC free article] [PubMed] [Google Scholar]
- 26. Ablonczy Z, et al.. Lack of correlation between the spatial distribution of A2E and lipofuscin fluorescence in the human retinal pigment epithelium. Invest Ophthalmol Vis Sci. 2013; 54(8): 5535–5542. [DOI] [PMC free article] [PubMed] [Google Scholar]
- 27. Bhosale P, Serban B, Bernstein PS. Retinal carotenoids can attenuate formation of A2E in the retinal pigment epithelium. Arch Biochem Biophys. 2009; 483(2): 175–181. [DOI] [PMC free article] [PubMed] [Google Scholar]
- 28. Adler LT, et al.. Determination of N-retinylidene-N-retinylethanolamine (A2E) levels in central and peripheral areas of human retinal pigment epithelium. Photochem Photobiol Sci. 2015; 14(11): 1983–1990. [DOI] [PMC free article] [PubMed] [Google Scholar]
- 29. Parish CA, et al.. Isolation and one-step preparation of A2E and iso-A2E, fluorophores from human retinal pigment epithelium. Proc Natl Acad Sci USA. 1998; 95(25): 14609–14613. [DOI] [PMC free article] [PubMed] [Google Scholar]
- 30. Lamb LE, Simon JD. A2E: a component of ocular lipofuscin. Photochem Photobiol. 2004; 79(2): 127–136. [DOI] [PubMed] [Google Scholar]
- 31. Dontsov AE, et al.. Light-induced release of A2E photooxidation toxic products from lipofuscin granules of human retinal pigment epithelium. Dokl Biochem Biophys. 2009; 425: 98–101. [DOI] [PubMed] [Google Scholar]
- 32. Sakai N, et al.. Ocular Age Pigment “A2-E”: An Unprecedented Pyridinium Bisretinoid. Journal of the American Chemical Society. 1996; 118(6): 1559–1560. [Google Scholar]
- 33. Li J, et al.. Identification of a novel lipofuscin pigment (iisoA2E) in retina and its effects in the retinal pigment epithelial cells. J Biol Chem. 2013; 288(50): 35671–3582. [DOI] [PMC free article] [PubMed] [Google Scholar]
- 34. Pallitto P, et al.. A2E and lipofuscin distributions in macaque retinal pigment epithelium are similar to human. Photochem Photobiol Sci. 2015; 14(10): 1888–1895. [DOI] [PMC free article] [PubMed] [Google Scholar]
- 35. Zemski Berry KA, et al.. Spatial organization of lipids in the human retina and optic nerve by MALDI imaging mass spectrometry. J Lipid Res. 2014; 55(3): 504–515. [DOI] [PMC free article] [PubMed] [Google Scholar]
- 36. Ben-Shabat S, et al.. Formation of a nonaoxirane from A2E, a lipofuscin fluorophore related to macular degeneration, and evidence of singlet oxygen involvement. Angew Chem Int Ed Engl. 2002; 41(5): 814–817. [DOI] [PubMed] [Google Scholar]
- 37. Jang YP, et al.. Characterization of peroxy-A2E and furan-A2E photooxidation products and detection in human and mouse retinal pigment epithelial cell lipofuscin. J Biol Chem. 2005; 280(48): 39732–39739. [DOI] [PubMed] [Google Scholar]
- 38. Fishkin NE, et al.. Isolation and characterization of a retinal pigment epithelial cell fluorophore: an all-trans-retinal dimer conjugate. Proc Natl Acad Sci USA. 2005; 102(20): 7091–7096. [DOI] [PMC free article] [PubMed] [Google Scholar]
- 39. Wu Y, et al.. Novel lipofuscin bisretinoids prominent in human retina and in a model of recessive Stargardt disease. J Biol Chem. 2009; 284(30): 20155–20166. [DOI] [PMC free article] [PubMed] [Google Scholar]
- 40. Ueda K, et al.. Photodegradation of retinal bisretinoids in mouse models and implications for macular degeneration. Proc Natl Acad Sci USA. 2016; 113(25): 6904–6909. [DOI] [PMC free article] [PubMed] [Google Scholar]
- 41. Yamamoto K, et al.. A novel bisretinoid of retina is an adduct on glycerophosphoethanolamine. Invest Ophthalmol Vis Sci. 2011; 52(12): 9084–9090. [DOI] [PMC free article] [PubMed] [Google Scholar]
- 42. Kim HJ, Sparrow JR. Bisretinoids: More than Meets the Eye. Adv Exp Med Biol. 2019; 1185: 341–346. [DOI] [PMC free article] [PubMed] [Google Scholar]
- 43. Kim HJ, Sparrow JR. Novel bisretinoids of human retina are lyso alkyl ether glycerophosphoethanolamine-bearing A2PE species. J Lipid Res. 2018; 59(9): 1620–1629. [DOI] [PMC free article] [PubMed] [Google Scholar]
- 44. Zhao J, et al.. Bisretinoids mediate light sensitivity resulting in photoreceptor cell degeneration in mice lacking the receptor tyrosine kinase Mer. J Biol Chem. 2018; 293(50): 19400–19410. [DOI] [PMC free article] [PubMed] [Google Scholar]
- 45. Kotnala A, et al.. Microwave assisted synthesis for A2E and development of LC-ESI-MS method for quantification of ocular bisretinoids in human retina. J Chromatogr B Analyt Technol Biomed Life Sci. 2018; 1073: 10–18. [DOI] [PubMed] [Google Scholar]
- 46. Jee EH, Kim SR, Jang YP. Rapid purification method for vitamin A-derived aging pigments A2E and iso-A2E using cation exchange resin. J Chromatogr A. 2012; 1251: 232–235. [DOI] [PubMed] [Google Scholar]
- 47. Karan G, et al.. Lipofuscin accumulation, abnormal electrophysiology, and photoreceptor degeneration in mutant ELOVL4 transgenic mice: a model for macular degeneration. Proc Natl Acad Sci USA. 2005; 102(11): 4164–4169. [DOI] [PMC free article] [PubMed] [Google Scholar]
- 48. R Core Team. R: A Language and Environment for Statistical Computing. Vienna, Austria: R Foundation for Statistical Computing;2019. [Google Scholar]
- 49. Hadley W. Data Analysis. In: ggplot2. Use R!. Cham: Springer;2016. [Google Scholar]
- 50. Anderson DMG, et al.. Bis(monoacylglycero)phosphate lipids in the retinal pigment epithelium implicate lysosomal/endosomal dysfunction in a model of Stargardt disease and human retinas. Scientific reports. 2017; 7(1): 17352–17352. [DOI] [PMC free article] [PubMed] [Google Scholar]
- 51. Avalle LB, et al.. Observation of A2E oxidation products in human retinal lipofuscin. Exp Eye Res. 2004; 78(4): 895–898. [DOI] [PubMed] [Google Scholar]
- 52. Feldman TB, et al.. Changes in spectral properties and composition of lipofuscin fluorophores from human-retinal-pigment epithelium with age and pathology. Anal Bioanal Chem. 2015; 407(4): 1075–1088. [DOI] [PubMed] [Google Scholar]
- 53. Yamamoto K, et al.. Toward an understanding of bisretinoid autofluorescence bleaching and recovery. Invest Ophthalmol Vis Sci. 2012; 53(7): 3536–3544. [DOI] [PMC free article] [PubMed] [Google Scholar]
- 54. Zhou J, et al.. Complement activation by photooxidation products of A2E, a lipofuscin constituent of the retinal pigment epithelium. Proc Natl Acad Sci USA. 2006; 103(44): 16182–16187. [DOI] [PMC free article] [PubMed] [Google Scholar]
- 55. Kim SR, Jang YP, Sparrow JR. Photooxidation of RPE lipofuscin bisretinoids enhances fluorescence intensity. Vision Res. 2010; 50(7): 729–736. [DOI] [PMC free article] [PubMed] [Google Scholar]
- 56. Kooijman AC. Light distribution on the retina of a wide-angle theoretical eye. J Opt Soc Am. 1983; 73(11): 1544–1550. [DOI] [PubMed] [Google Scholar]
- 57. Pflibsen KP, Pomerantzeff O, Ross RN. Retinal illuminance using a wide-angle model of the eye. J Opt Soc Am A. 1988; 5(1): 146–150. [DOI] [PubMed] [Google Scholar]
- 58. Curcio CA, et al.. Human photoreceptor topography. J Comp Neurol. 1990; 292(4): 497–523. [DOI] [PubMed] [Google Scholar]
- 59. Ablonczy Z, et al.. Similar molecules spatially correlate with lipofuscin and N-retinylidene-N-retinylethanolamine in the mouse but not in the human retinal pigment epithelium. Arch Biochem Biophys. 2013; 539(2): 196–202. [DOI] [PMC free article] [PubMed] [Google Scholar]
- 60. Greenberg JP, et al.. Quantitative fundus autofluorescence in healthy eyes. Invest Ophthalmol Vis Sci. 2013; 54(8): 5684–5693. [DOI] [PMC free article] [PubMed] [Google Scholar]
- 61. Cabral de Guimaraes TA, et al.. Treatments for dry age-related macular degeneration: therapeutic avenues, clinical trials and future directions. Br J Ophthalmol. 2022; 106(3): 297–304. [DOI] [PMC free article] [PubMed] [Google Scholar]
- 62. Butler JM, et al.. RNA-seq analysis of ageing human retinal pigment epithelium: Unexpected up-regulation of visual cycle gene transcription. J Cell Mol Med. 2021; 25(12): 5572–5585. [DOI] [PMC free article] [PubMed] [Google Scholar]
- 63. Różanowska MB, Różanowski B. Photodegradation of Lipofuscin in Suspension and in ARPE-19 Cells and the Similarity of Fluorescence of the Photodegradation Product with Oxidized Docosahexaenoate. Int J Mol Sci. 2022; 23(2): 922. [DOI] [PMC free article] [PubMed] [Google Scholar]
Associated Data
This section collects any data citations, data availability statements, or supplementary materials included in this article.