

Abstract
The Add‐my‐Pet collection of data on energetics and Dynamic Energy Budget parameters currently contains 92 species of turtles and 23 species of crocodiles. We discuss patterns of eco‐physiological traits of turtles and crocodiles, as functions of parameter values, and compare them with other taxa. Turtles and crocodiles accurately match the general rule that the life‐time cumulated neonate mass production equals ultimate weight. The weight at birth for reptiles scales with ultimate weight to the power 0.6. The scaling exponent is between that of amphibians and birds, while that for mammals is close to 1. We explain why this points to limitations imposed by embryonic respiration, the role of water stress and the accumulation of nitrogen waste during the embryo stage. Weight at puberty is proportional to ultimate weight, and is the largest for crocodiles, followed by that of turtles. These facts explain why the precociality coefficient, —approximated by the ratio of weight at birth and weight at puberty at abundant food—decreases with ultimate weight. It is the smallest for crocodiles because of their large size and is smaller for turtles than for lizards and snakes. The sea turtles have a smaller than the rest of the turtles, linked to their large size and small offspring size. We link their small weight and age at birth to reducing risks on the beach. The maximum reserve capacity in both turtles and crocodiles clearly decreases with the precociality coefficient. This relationship has not been found that clearly in other taxa, not even in other reptiles, with the exception of the chondrichthyans. Among reptiles, crocodiles and sea turtles have a relatively large assimilation rate and a large reserve capacity.
Keywords: add‐my‐pet collection, dynamic energy budgets, life history, metabolism, population growth rate, traits
This paper discusses patterns in Dynamic Energy Budget parameters and implied traits that we found for turtles and crocodiles. We explain, for instance, why the proportionality of weight at birth with the square root of ultimate weight points to problems with water loss and nitrogen‐waste accumulation.

1. INTRODUCTION
Add‐my‐Pet (AmP) is an open access online collection of referenced data on animal energetics and Dynamic Energy Budget (DEB) parameters (AmP, 2021; Marques et al., 2018). The collection is run as a journal, meaning that everyone can contribute, and submissions are reviewed prior to acceptance. This study is part of a series of case studies on selected taxa from AmP whereby DEB parameters and associated traits are presented in eco‐evolutionary context. It focusses on traits of turtles (Testudines) and crocodiles (Crocodilia), using other reptiles as a reference; previous studies were on fish (Augustine et al., 2021; Kooijman & Lika, 2014; Lika et al., 2022), petrels and penguins (Kooijman, 2020), carnivores and pangolins (Kooijman & Augustine, 2022a), cephalopods (Kooijman & Augustine, 2022b).
Eco‐physiological traits are gaining more focus, as conservation physiology (sensu Cooke et al., 2013) is emerging as an ‘increasingly integrated and essential science’ (Cooke et al., 2013). Traits that are based on mechanistic models linking individuals to their environments can be used to predict how species respond to environmental change (Kearney et al., 2019), but also to study evolutionary drivers (Beekman et al., 2019; Jusup et al., 2017). Add‐my‐Pet (AmP) collection presents an array of such traits, and is therefore a most valuable resource.
Table 1 gives the number of reptile species currently included in the AmP collection, compared with the number of existing species. In our analysis and discussion, we use the Lepidosauria (= Rhynchocephalia + Squamata) and a dozen extinct reptile species (“dinosaurs”) as reference. Analysis is focused on turtles and crocodiles because we consider them `complete’ in the collection, that is, that it will be hard to find data on more species in open literature. The list of turtle and crocodile AmP species, the data types for each species and selected references can be found in the Appendix (Table A1 and Table A2).
TABLE 1.
The number of reptile species in the AmP collection at time of the analysis (2022/04/04), the number of extant species (estimates from Wikipedia) and the coverage for reptile classes. Rhynchocephalia and Squamata form the class Lepidosauria, and are for simplicity presented as such in subsequent analysis
| Taxon | AmP | Extant | Coverage |
|---|---|---|---|
| Testudines (turtles) | 92 | 360 | 25.6% |
| Crocodilia (crocodiles) | 22 a | 27 | 81.5% |
| Rhynchocephalia (tuatara) | 1 | 1 | 100.0% |
| Squamata (snakes and lizards) | 115 | 10,900 | 1.0% |
Excluding the extinct Deinosuchus rugosus (terrible crocodile).
This paper first introduces turtles and crocodiles, briefly presents the Dynamic Energy Budget (DEB) framework used to formalize the traits, then discusses aspects of energetics and life history, and finalizes with a Discussion and conclusion section.
2. REPTILES, TURTLES AND CROCODILES
The extant “reptiles” are a polyphyletic group, with the 4 main lineages usually described as crocodilians, turtles, squamates (snakes and lizards), and tuatara. The name Reptilia is nowadays less frequently used, because it is not a clade (Shine, 2013). It should include birds, which, together with the crocodiles, form the clade Archosauria. Turtles and crocodiles are placed in the clade Archelosauria, while the “true” reptiles are a sister clade: the Lepidosauria (tuatara, lizards and snakes). Despite the exact grouping being still open to debate (Hedges & Poling, 1999), it is evident that reptiles have been independently evolving into very different animals since the Triassic (Hedges & Poling, 1999). We here focus on turtles (Testudines) and crocodiles (Crocodilia), but compare them with tuatara, squamates (Lepidosauria), and extinct reptiles present in the AmP collection (Pterosauria, Saurischia, Ornithischia, and Tyrannosauridae).
All turtles and crocodiles lay eggs, which, unlike many squamates which made the transition to ovovivipary, prevents them from living in cooler climates. Like most reptiles, they are ectothermic and master the art of regulating their body through behavior excellently. Interestingly, evidence exists for endothermy in the ancestors of the crocodiles, which converted back to ectothermy when adopting an aquatic life style (Seymour et al., 2004), and sea turtles are partially (Mrosovsky, 1980; Standora, 1982). Most turtles and all crocodiles have temperature dependant sex determination (Lee et al., 2019; Valenzuela & Adams, 2011), even though some turtles reverted to gene sex determination. The latter enables living in colder conditions, and is present also in all snakes. By contrast, the temperature‐dependant sex determination can also be found in some lizards, but not in habitats with extreme temperature fluctuations (Pen et al., 2010).
Some 60% of the turtle species are presently considered to be threatened (Rhodin et al., 2018), while of the 24 crocodile species, the IUCN crocodile specialist group lists 7 species as critically endangered and 12 species as vulnerable (IUCN‐Crocodile‐Specialist‐Group, 2021). The main threats, for turtles and crocodiles alike, are global climate change, habitat destruction, and illegal hunting, with (plastic) pollution as an emerging pressure for all wildlife, especially marine species such as sea turtles (Gall & Thompson, 2015; Marn et al., 2020; Nelms et al., 2016; Schuyler et al., 2014). Conservation in a changing world needs predictive mechanistic models (Wood et al., 2018), and functional traits derived from mechanistic models are invaluable in determining a species niche (Kearney & Porter, 2009). DEB theory has already been used to evaluate effects of climate change and plastic ingestion on sea turtles (Marn et al., 2020; Stubbs et al., 2017) and to optimize site selection for the western swamp turtle re‐introduction programs (Arnall et al., 2014, 2019), and to explain geographic shifts in reproductive patterns of a viviparous lizard (Schwarzkopf et al., 2016). We hope that this paper contributes to a better understanding of the eco‐physiology of turtles and crocodiles, and, in a much broader context, brings us closer to tackling major questions in ecology and evolutionary biology (Kearney et al., 2010).
3. DEB MODELS AND TRAITS
Dynamic Energy Budget models aim to quantify the various aspects of energy and mass budgets in dynamic environments in terms of temperature and food availability, throughout ontogeny, that is, embryo, juvenile, and adult. These aspects include food searching, feeding, defecation, digestion, storing, development, growth, reproduction, aging, and the fluxes of heat, CO2, H2O, O2 and N‐waste. Mass and energy conservation and stoichiometric constraints are respected explicitly. All parameters have a clear physical interpretation, and therefore simple dimensions. The standard (std) DEB model fits data for all turtle and crocodile species in the AmP collection very well; the median relative error for all data sets is 6%; this is also the median relative error for all 3000 species in the AmP collection.
The standard model is the simplest DEB model the other models that have been used in the AmP collection are one‐ or two‐parameter extensions to include, for example, larval development. The setup of the std model is as follows. A state of an individual is described by three state variables: maturity, (J)—that tracks the development of the individual but has no energy or mass, and two physical state variables—reserve, E (J), and structure, V (cm3 or g)—that determine the size of the individual. Food‐derived metabolites are first added to a reserve pool, and then reserve is mobilized for use in metabolism. Mobilization is such that weak homeostasis is respected: reserve density, that is, the ratio of the amounts of reserve and structure, does not change during growth in constant environments, possibly after an adaptation period. The rate of reserve mobilization depends on the amounts of reserve and structure and on the DEB parameter , energy conductance. A fixed fraction of the mobilized reserve is allocated to somatic maintenance and growth (soma), the rest to maturity maintenance and maturation (before puberty) or reproduction (after puberty). Feeding is taken to be proportional to squared length of structure, somatic maintenance to cubed length of structure, and maturity maintenance to the level of maturity. Reserve allocated to reproduction is collected in a reproduction buffer, with species‐specific buffer handling rules for the conversion to eggs. The growth‐trajectory of the std model simplifies to the von Bertalanffy (or better Pütter, see Kearney, 2020) growth model in constant environments. Pütter growth model, however, cannot handle dynamic environments (nor reproduction; Kearney, 2020), while the std model is designed for it. Ultimate length or weight and the von Bertalanffy growth rate are not parameters of the DEB model and depend on the environment, not only in reality, but also in DEB theory.
In the context of DEB theory, we define a trait as “a parameter or a function of parameters, which quantifies some eco‐physiological property of a species” (Kooijman et al., 2021). We followed the workflow that (measured) data from literature was used to estimate parameters, and these parameters are used to quantify the traits. So, traits here are not measured data, but instead model‐derived parameters and implied properties. Needless to say that the reliability of parameter values generally increases with data availability. The various AmP entries differ a lot in data availability, but in this way we could evaluate all traits for all species. Trait values for a species are interlinked; the strict application of mass and energy conservation rules in DEB theory contributes to this interlinking, and provides the consistency between traits.
Data and code used for parameter estimation are presented on the AmP website (AmP, 2021), together with references to the original literature, parameters, quantifiers for goodness of fit and data completeness. The site also presents a selection of eco‐physiological trait values for each species, as well as at the population level. All computations were performed using AmPtool and DEBtool (AmPtool, 2021; DEBtool, 2021)—two large computation packages supporting the AmP collection, which are freely available and can be used for further analysis.
3.1. Multidimensional scaling
Supplementary to analyzing distribution of traits and patterns in the co‐variation of parameter values, we have applied multidimensional scaling (MDS) on trait‐based distances between species (Kooijman et al., 2021). We chose 12 traits from those analyzed in this study (see Section 4.5 for a list of traits); a different set and/or number of traits could have been chosen (see Kooijman et al., 2021). The MDS needs a matrix of distances between species as input. The matrix is created based on the symmetric bounded loss function (Marques et al., 2019), which simultaneously takes into account all analyzed traits: the number of rows in the matrix corresponds to the number of species (here—243 species of reptiles), and the number of relevant columns depends on the eigenvalues: typically only the first few columns are relevant because the second eigenvalue is much smaller than the first one etc. By correlating each trait with (relevant) eigenvalues, it is possible to determine which traits contribute the most to the observed pattern among species. MDS was performed using the in‐built Matlab function cmdsc.m, and the correlation of trait distances with eigenvalues was performed using the DEBtool_M function corr.m. (Please see Kooijman et al., 2021 for presentation and examples of multidimensional scaling of animal traits in the context of DEB theory.)
4. ENERGETICS AND LIFE HISTORY
We first present the distribution of selected eco‐physiological traits for the turtles, crocodiles and Lepidosauria (squamates and tuatara), and then discuss some features in more detail. All temperature dependent traits are presented at a common reference temperature of 20°C.
4.1. Distributions of traits
Figure 1 shows survivor curves for selected traits, that is, for each trait the fraction of species for which the trait value exceeds the value on the abscissa. This is a very simple representation but can already point to general patterns and main differences or similarities between the groups. We here discuss the coherence.
FIGURE 1.
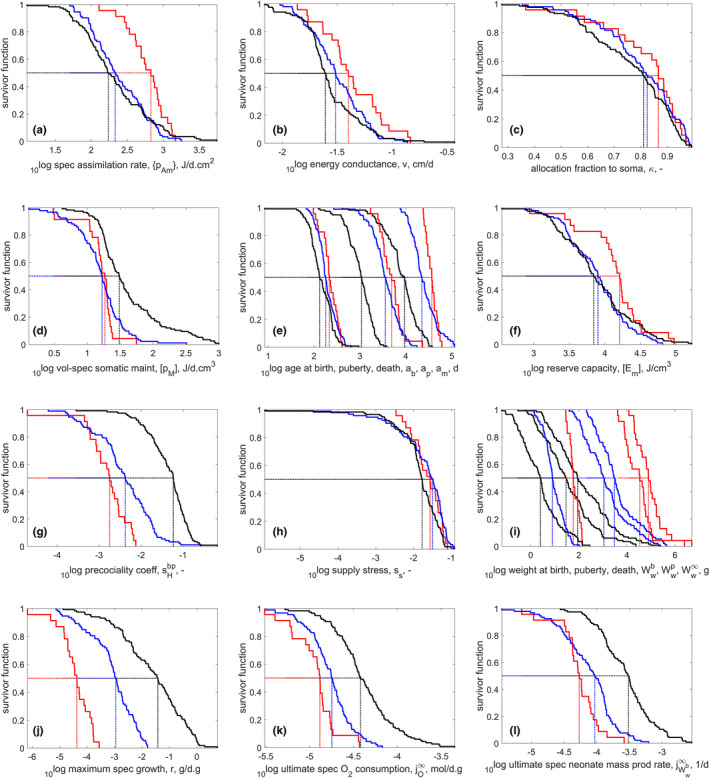
Survivor curves for selected DEB parameters and other traits for reptile taxa in the AmP collection: Testudines (blue), Crocodilia (red), Lepidosauria (black); for number of species see Table 1. Ages at birth, puberty and death are presented on the same plot; same for weights. All traits are presented for a body temperature of 20°C
The specific assimilation rate of crocodiles is much larger than that of turtles and squamates (Figure 1a). This, combined with a smaller specific maintenance (Figure 1d), explains in part why their ultimate weight is much larger (Figure 1i). See also Figure 4.
FIGURE 4.
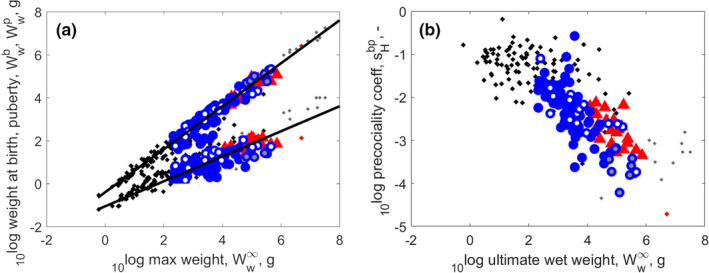
Panel (a): Weight at birth and at puberty as functions of ultimate weight. Panel (b): Precociality coefficient, , as function of ultimate weight. Weight at puberty scales proportionally with ultimate weight (slope of 1), whereas weight at birth scales with a slope of 0.5818. The decrease of the precociality coefficient with ultimate weight follows from the previous scaling, since can be approximated by the ratio of weight at birth and weight at puberty. Markers as in Figure 2: turtles – blue circles; crocodiles – red triangles; other reptiles – black dots
The energy conductance of turtles and crocodiles is quite a bit larger than that of squamates (Figure 1b). The effect of a large specific assimilation dominates that of a relatively large energy conductance in the maximum reserve capacity (Figure 1f), which equals the ratio of the two, and is the largest for crocodiles, implying they can sustain well the periods of starvation. An increase in energy conductance and in somatic maintenance both enhance growth. This is because the energy conductance determines the mobilization flux of reserve and the von Bertalanffy growth rate works out to be proportional to the specific somatic maintenance rate in the DEB context. (The specific growth rate at maximum growth turns out to equal 1.5 times the von Bertalanffy growth rate, see Kooijman et al., 2020.) Therefore, a large energy conductance combined with a small specific somatic maintenance can result in the same von Bertalanffy growth rate as vice versa. The effect of the energy conductance on growth is, however, more restricted, which explains why maximum specific growth is small in turtles and crocodiles (Figure 1j), despite their large energy conductance.
The allocation fraction to soma is similar in the three taxa, with the crocodiles having a slightly higher median value than the other two taxa (Figure 1c). This is in accordance with the highest ultimate weight of this class, as the ultimate size is proportional to (Lika et al., 2019).
A large energy conductance (Figure 1b) leads to a short incubation time, that is, smaller age at birth, but this is not what we observe (Figure 1e) because absolute egg size matters as well. Egg size is the largest for crocodiles, followed by that of turtles (Figure 1i).
The eggs and hatchlings of the crocodiles may be the largest among reptiles; however, they are relatively the smallest when the size of the parent is taken into account. This information is expressed as the precociality coefficient, which for crocodiles is lower than for turtles and much lower than for squamata (Figure 1g). The precociality coefficient, , is a ratio of maturities at birth and puberty, but it roughly equals the ratio of the weights at birth and puberty at abundant food (Augustine et al., 2019). We will see that the weight at puberty is approximately proportional to ultimate weight, but that at birth scales with ultimate weight to the power 0.6. This implies that the differences in the precociality coefficient is mainly due to differences in adult weight.
The supply stress, , is defined as maturity maintenance times squared somatic maintenance, divided by cubed assimilation and can take values between 0 and 4/27. It is similarly low for the three taxa (Figure 1h), meaning that they can rather easily deal with low food conditions and respond with low growth and reproduction (Lika et al., 2014). Birds and mammals have the highest supply stress, insects the lowest. Among reptiles, the median value is highest for turtles (0.0321), followed by that for crocodiles (0.0275), and then lepidosauria (0.0168). Sea turtles, perhaps due to their partial endothermy and generally relatively constant environments, have a higher median (0.0560) for this trait than other turtles. (See also Figure A1 in the Appendix).
Survivor curves for weight‐specific growth, respiration, and reproduction show that the crocodiles have the slowest metabolism among reptiles (Figure 1j–l), followed by turtles, then squamates. Low respiration (Figure 1k) comes with a long life span (Figure 1e), and a long live span compensates the low neonate mass production rate (Figure 1l), compared with the Lepidosauria. We come back to this in the discussion of Figure 3.
FIGURE 3.

Panel (a): Egg size as fraction of ultimate weight decreases with ultimate weight. Panel (b): The life‐time cumulated neonate mass production increases with ultimate weight. Long life (Figure 2a), implying a long period of reproduction, offsets the relatively small egg size and offspring size of turtles and crocodiles. The line in panel b indicates equality, no parameters are involved. Markers as in Figure 2: turtles ‐ blue circles; crocodiles – red triangles; other reptiles – black dots
4.2. Respiration, life span, and reproduction
Respiration, life span, and reproduction are intimately connected for turtles and crocodiles (and other reptiles) (Figures 2 and 3), as found for chondrichthyans (Augustine et al., 2021) and for actinopterigyans (Lika et al., 2022). The relationships apply, with much more scatter, to all 3000 animal species in the AmP collection that covers all larger phyla (Augustine et al., 2021). The life span is inverse to the specific respiration (Figure 2a) and the life‐time cumulated neonate mass production equals the ultimate weight (Figure 3a). Long life, implying a long period of reproduction, offsets the relatively small egg size and offspring size of turtles and crocodiles (Figure 3b). We come back to the small egg size of turtles and crocodiles in the discussion. The lines shown in the figures have not been fitted to the data; no parameters involved.
FIGURE 2.

Panel a: The O2 consumption rate as function of life span. Panel b: The weight‐specific respiration as function of ultimate wet weight. The line in the panel a plot has a slope of −1, and the one in the panel b plot has a slope of −1/4. Lines were plotted without fitting. Markers: Blue dots represent 92 species of turtles (Testudines), with grey blue dots marking sea turtles (Chelonioidea) and empty blue dots tortoises (Testudinidae). Red triangles mark 22 species of living crocodiles (Crocodilia), and the extinct Deinosuchus is marked with a red dot. Black dots represent 115 species of squamates and tuatara (Lepidosauria), and grey dots a dozen extinct reptiles belonging to Pterosauria, Saurischia, Ornithischia, and Tyrannosauridae
Figure 2b shows that Kleiber's law also applies to reptiles, as explained by the physical co‐variation rules of DEB theory (Kooijman, 1986a, 2010). DEB theory does not work with allometric relationships. Specific respiration at abundant food works out as a cubic polynomial in ultimate length (Kooijman, 2010), but when curvature is ignored in a log‐log plot, the slope is close to −1/4, which is what we plotted in the plot (Figure 2b). The respiration of crocodiles, and the rather low one for turtles, fits the relationship well, meaning that their low respiration is mostly due to their large size. Body size is, in the context of DEB theory, an emergent property of metabolism, not an independent variable (Lika et al., 2019). So the figure shows how one function of DEB parameters relates to another function of these parameters.
4.3. Precociality coefficient and size at birth and puberty
Size is, in large part, a result of the ratio between how much energy is assimilated and how much energy is left after maintenance needs have been met; turtles and crocodiles have relatively small maintenance costs relative to assimilation capacity, compared with other reptiles (Figure A2a in the Appendix). While some squamata are tiny, there are no very small turtles or crocodiles; the smallest living turtle is Chersobius signatus of 172 g; this is visible also in weight distribution Figure 1i.
Figure 4a shows that weight at puberty is directly proportional to ultimate weight (as expected by the physical co‐variation rules of DEB theory), with a fixed fraction 0.4. However, weight at birth scales to ultimate weight to the power 0.6, not only for turtles and crocodiles, but for all reptiles. Ratio of weight at birth and weight at puberty approximates to the precociality coefficient.
The physical co‐variation rules predict that the precociality coefficient roughly equals the weight at birth over that at puberty at abundant food, while the latter is more or less proportional to ultimate weight. We expect the precociality coefficient to scale with ultimate weight to the power −0.6, because birth weight was found to be proportional to ultimate weight to the power 0.6. This approximates what we did find (Figure 4b). The precociality coefficient is the smallest for crocodiles when classes are compared (Figure 1g), however, that of sea turtles is even smaller (see e.g., Figure 5d, and Figure A3 in the Appendix). The precociality coefficient quantifies how ‘immature’ an offspring is born, and is calculated as a ratio of maturity at birth and puberty. For reptiles, we can draw direct links to the egg size relative to adult size. We come back to this in the discussion.
FIGURE 5.

The maximum reserve capacity as functions of (Panel a) maximum specific assimilation rate; (Panel b) maximum weight; (Panel c) specific somatic maintenance rate, and (Panel d) precociality coefficient. The line in panel a indicates equality (slope of 1). Markers as in Figure 2: turtles – blue circles; crocodiles – red triangles; other reptiles – black dots. (The turtle outlier with the highest reserve capacity in all four plots is the Chinese pond turtle Mauremys reevesii)
4.4. Reserve capacity
Figure 5 shows (in sub‐figure a) that the maximum reserve capacity is proportional to the surface area‐specific assimilation rate ; this is easy to understand since . The physical co‐variation rules imply that is also proportional to maximum structural length, that is, to ultimate weight after some contribution of reserve is taken into account. This link, however, is not clearly visible for reptiles (Figure 5b). Maximum reserve capacity was found to increase with ultimate weight in chondrichthyans (Augustine et al., 2021), but not in actinopterigyans (Lika et al., 2022), which was explained by interference with the waste‐to‐hurry pattern (Kooijman, 2013). We do not think, however, that this pattern explains the lack of co‐variation between maximum reserve capacity and maximum weight here, since specific somatic maintenance is too small to drive specific assimilation up, and the range for is rather small for turtles and crocodiles. Energy conductance, —which is also affected in species with the waste‐to‐hurry pattern (Kooijman, 2013), and is the other parameter defining the —has some scatter, but does not have a clear link to maximum weight (Figure A2b in the Appendix).
Maximum reserve capacity increases with specific somatic maintenance , Figure 5c, which is also part of the reason why the relationship between and ultimate weight is less clear: reduces maximum structural length, so maximum weight. The ecological functionality of the co‐variation of maximum reserve capacity with specific somatic maintenance obviously helps to cope with temporary dips in food availability, although many turtle and crocodile species can enter torpor states.
Maximum reserve capacity tends to decrease with the precociality coefficient, , although with considerable scatter (Figure 5d), which seems to be unique for turtles and crocodiles; we did not see this pattern before that clearly. The reason is probably that the scatter in the relative weights at birth and puberty is small (Figure 4a), so the signal is clear. We think that the existence of this pattern (Figure 5d) implies that in fact does increase with ultimate weight also for reptiles, but that the latter relationship comes out less clearly because more parameters contribute to ultimate weight, leading to a large scatter which obscures the signal.
4.5. Multidimensional scaling
We present results of multidimensional scaling (MDS) applied to reptiles for the following 12 eco‐physiological traits, most of them analyzed also in the previous sections: age at birth and puberty (, ), life span (), ultimate wet weight (), reproduction rate at ultimate size (), egg size (), maximum reserve capacity (), energy conductance (), volume‐specific maintenance rate (), area‐specific maximum assimilation rate (), supply stress (), and precociality coefficient ().
Multidimensional scaling clusters species in multidimensional space. We present here “only” a two‐dimensional plot (Figure 6), but the eigenvalues in the bottom right corner of the figure indicate that the first two dimensions are the most relevant ones (third eigenvalue is already much smaller than the first and the second one; Figure 6), and so the 2D‐graph is a good indication of the species’ position relative to each other. As a general pattern, we can observe that crocodiles cluster together, as do most of the turtles. Within the turtle group, sea turtles form a clear subgroup, as do most of the tortoises (Figure 6). Relative to the x‐axis (representing the first eigenvector), we can observe a transition between the Lepidosauria (squamates + tuatara) on the left, then Testudinidae (tortoises) and crodociles (Crocodilia) in the middle, and then remaining turtles (Testudines), with sea turtles (Chelonioidea) close to the far right (Figure 6).
FIGURE 6.

Multidimensional scaling applied to all 243 reptiles in the collection, using 12 arbitrarily chosen eco‐physiological traits (see text for list of traits). The bottom right figure presents all eigenvalues. The first 12 eigenvalues are presented in blue. Markers: Blue dots represent turtles (Testudines), with grey blue dots marking sea turtles (Chelonioidea) and empty blue dots tortoises (Testudinidae). Red triangles mark living crocodiles (Crocodilia), and the extinct Deinosuchus is marked with a red dot. Black dots represent squamates and tuatara (Lepidosauria), and grey dots a dozen extinct reptiles belonging to Pterosauria, Saurischia, Ornithischia, and Tyrannosauridae
When correlating the traits with the first and second eigenvector, we see that the life span and age at puberty have the highest (−ve) correlation with the first eigenvector, followed by the (+ve) precociality coefficient (correlation coefficients larger than 0.7, 0.6, and 0.5, respectively). Maximum reserve capacity, somatic maintenance, and maximum assimilation have the highest (+ve) correlation with the second eigenvector (correlation coefficients larger than 0.5). This points to the main traits characterizing the analyzed groups, as we discuss in the following section.
5. DISCUSSION AND CONCLUSIONS
Reptiles are a diverse polyphyletic group, but, as we have just shown, their eco‐physiological traits also point to similarities in trait patterns, and coherence within and between groups. Multidimensional scaling (MDS) on trait‐based distances between species supplements our efforts to find patterns in the co‐variation of parameter values. We used most of the traits analyzed in this study (see Section 4.5 for a list of traits) to expand on the turtle‐focused MDS presented in Kooijman et al. (2021). Results of the MDS analysis corroborate the grouping evident already in the simple co‐variation analysis: in the multidimensional space crocodiles again cluster together, as do the turtles, both of them separate from the rest of the reptiles. Within turtles, sea turtles and tortoises form separate clusters (Figure 6).
When using this specific selection of traits and correlating them to the first two eigenvectors, we can identify main characteristics (i.e., eco‐physiological traits) which place species at either of the two extremes: at one of the extremes we have slow‐maturing, long‐living, relatively large individuals with relatively small offspring (i.e., a small precociality coefficient) and relatively high metabolism, but also good ability to withstand food shortages (high reserve capacity)—such as sea turtles. At the other extreme, we have individuals with a relatively fast life cycle, and with offspring size more similar to parent size (i.e., a higher precociality coefficient), which are less tolerant to periods of starvation (i.e., they have a lower maximum reserve capacity)—such as lizards and snakes. This points to quite specific environmental pressures, and is therefore encouraging that related species experiencing similar environments cluster together.
Even though (ultimate) weight is not one of the traits with a strong correlation to one of the two axes in the MDS plot, the results section shows that it does have a strong relationship to many eco‐physiological traits. Coupling of many eco‐physiological traits to size (Calder, 1984; Peters, 1983) has well understood reasons (Kooijman, 2010); the fact that large weight allows for long starvation intervals and dives (for aquatic species) is very relevant in this context. Moreover, both turtles and crocodiles—frequently among the largest reptiles—easily switch to a estivation/torpor/hibernation state where they further reduce their maintenance costs (Hochscheid et al., 2007; Nussear et al., 2007; Staples, 2016).
Generally, crocodiles as a group have the slowest metabolism among reptiles (Figures 1 and 2), but their low respiration is matched—or even exceeded—by low respiration of large and long lived tortoises and sea turtles (Figure 2). Maximum specific growth rates of turtles are larger than that of crocodiles and smaller than that of other reptiles (Figure 1j), but there is much variation within the group (not shown): sea turtles (Chelonioidea) have a relatively large maximum specific growth rate, but their close relatives, the mud and musk turtles (Kinosternidae) have a relatively small maximum specific growth rate, a small ultimate weight and typical relative weight at birth. This seems to reflect opposing selection pressures within the Chelydroidea (Chelonioidea + Kinosternidae).
Specific respiration of turtles and crocodiles (as well as other reptiles) is inverse to their life span (Figure 2a), and life‐time cumulative neonate mass production equals ultimate weight (Figure 3b); a pattern also observed in fish (Augustine et al., 2021; Lika et al., 2022). In some reptile groups—such as sea turtles, and larger crocodiles and tortoises—the eggs and offspring are small relative to ultimate weight (Figure 3a). The fact that the equality between life‐time cumulative neonate mass and ultimate weight holds also for these groups, suggests that the small offspring size is offset by a large number of offspring throughout the reproductive period. We discuss later the possible explanation for having such small offspring.
For both turtles and crocodiles (and reptiles in general), weight at puberty is directly proportional to ultimate weight, but the weight at birth as a fraction of ultimate weight decreases with ultimate weight substantially (Figure 4a). This calls for an explanation, and we do it in the context of other vertebrates: amphibia, birds, and mammals, but also fish.
Figure 7 presents the behavior of the scaling exponent for weight at birth as a function of ultimate weight, for vertebrates that live on land. We focus on this scaling exponent because constraints of the type that we will consider become more apparent for increasing size. Birds have a scaling exponent of 0.8 (Augustine et al., 2021), while their eggs—directly proportional to size at birth—are relatively larger than that of reptiles. Although the body size‐range for birds is smaller than that of reptiles, the smaller scaling exponent for reptiles is probably not due to mechanical constraints of producing large eggs; the 3.9 kg kiwi has an egg size of even 20% of its body weight, implying that larger birds could lay larger eggs too. This view is confirmed by the exponent of placentalia of 0.946 (Augustine et al., 2021), which produce neonates of similar relative size compared to birds, so larger than that of reptiles, while their range of body sizes exceeds that of reptiles.
FIGURE 7.
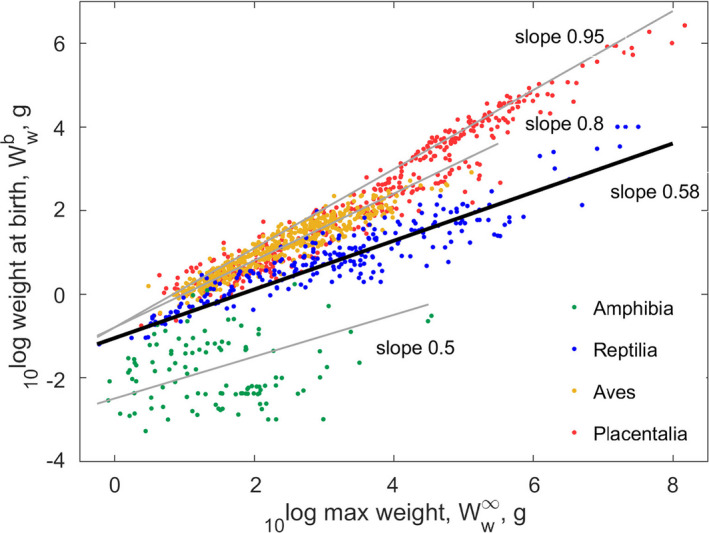
Scaling exponent for weight at birth as a function of ultimate weight for amphibia, reptiles, birds, and mammals (Modified from Augustine et al., 2021). Size at birth (and therefore egg size) increases with ultimate weight, but less so for reptiles than for birds and mammals. We discuss this in the text
This points to explanations other than mechanical constraints: (i) limitation of respiration during the embryo stage, (ii) the accumulation of nitrogen waste in the egg, and (iii) water loss from the egg. The placentalia escaped these problems by placental vivivary.
Dioxygen limitation was already suggested for amphibia, which produce aquatic eggs with jelly envelopes that might reduce transport of O2 (Seymour & Bradford, 1995); they have a scaling exponent of 0.5 (Augustine et al., 2021), so somewhat smaller than the reptiles. The biggest amphibians, i.e. the giant salamanders Andrias with the largest eggs, live in cold water, where respiration limitation is weaker due to low metabolic needs and high solubility of O2 in cold water, and the produced nitrogen waste can easily dissipate. The nitrogen waste of amphibians is mainly ammonia in tadpoles, which is toxic, but they hardly suffer from this in an aquatic environment where ammonia can easily dissipate. Many chondrichthyans sport vivipary and their metabolic rate is less then that of birds, have relatively large neonates and a scaling exponent of 0.88 (Augustine et al., 2021), between that of birds and placentalia. This suggests that they too escaped the selection pressure from oxygen limitation.
Terrestrial environments exert a strong selective pressure on water loss and nitrogen waste accumulation in eggs. Birds and reptiles are uricoletic (Withers, 1992), so they solved the nitrogen waste problem by making use of non‐solvable (so non‐toxic), but energetically expensive types of nitrogen waste. Birds have much higher metabolic rates than reptiles and use lipids as energy source, which give much more water than proteins when oxidized during metabolism. This allowed birds to insert larger pores in their egg shells, compared to reptiles, increasing the O2 availability without loosing too much water. By contrast, reptiles primarily use proteins as energy source. They, therefore, need to preserve water in eggs better than birds, which they do by having smaller pores in egg shells, limiting O2 availability and thus maximum egg size. Altricial birds that nest in trees show that water loss is an important issue; they hatch with extra water content in their tissues which reduces till fledging (Augustine et al., 2019; Konarzewski, 1988). This illustrates the conflicting needs of water and dioxygen transport for terrestrial eggs, and points to the conclusion that birds managed to escape these problems almost completely, in view of their scaling exponent being close the one, like was found for weights at puberty for all vertebrate taxa.
Relatively small eggs (and offspring) of some turtles and crocodiles (Figure 3a) could be linked to specific ecological pressures. Turtles and crocodiles make nests and bury their eggs in sand, where temperature depends on sunshine, or in a heap of dead leaves, where temperature depends on fungal activity. Incubation is timed when environmental conditions are favorable, and so the longer the incubation lasts—incubation duration increasing with egg size—the more difficult it becomes to select the proper time window, and the higher the risk of nest destruction. Shorter incubation times are also incentivized by the fact that nests are extremely vulnerable to predation, sea turtles being the prime example (Bolten et al., 2011; Whiting & Whiting, 2011). Although sea turtles have parameters in the range of other turtles, within this range they have one of the smallest relative weight and age at birth, typical weight at puberty, and their ultimate weight is at upper end of the turtle range (Figure 4). Large adult size corresponds to a large reproductive output. As a consequence of eggs being small, the number of eggs is relatively large (Figure 3); see also Beekman et al. (2019). We suggest that their small eggs and short incubation times are adaptations to minimize their stay on land to reduce the risks of flooding (Ewert, 1979), and predation. The latter interpretation is further supported by synchronized hatching, not only within a nest, but also between nests on the same beach. Details of beach conditions seem very important to the turtles, since the selection of nesting sites has a strong historic component which explains most of their long‐distance migration behavior. Crocodiles have the same problem of very vulnerable early life stages, but solved it in a different way: by guarding their nest with a respectable set of teeth and substantial body mass. Their relative weights at birth and puberty are typical, but their ultimate mass is at the upper end of the range for the Archelosauria. For comparison, the exponent for oviparous and viviparous chondrichthyans is the same, which suggests that reduction of predatory risks by reducing eggs size, thus shortening incubation time, might be less important for chondrichthyans (Augustine et al., 2021).
The comparison of life history traits between taxa is not without problems; it matters a lot how we compare exactly and what is taken as reference. For instance, when we suggest that dioxygen availability or toxicity of accumulated nitrogen waste limit embryo size, we do not imply that the embryo actually experiences such limitation or toxic effects, only that egg size is such that these problems are avoided. The large literature on bird egg development stresses the role of O2 limitation (Hoyt & Rahn, 1980; Tazawa et al., 1983; Visschedijk, 1968; Visschedijk & Rahn, 1983). The authors point that the maximum flux through the pores is egg‐size independent, from hummingbird to ostrich, and point to the levelling of dioxygen consumption prior to pipping. This implies that O2 is actually limited. If true, we disagree with this view. The constancy of maximum dioxygen flux through the pores is taken as a consequence of the need to minimize water loss: pores should not be larger than strictly necessary. The levelling of dioxygen consumption prior to hatching also occurs in very different species that do not have an egg shell (Kooijman, 1986b), and therefore cannot be caused by the limiting O2 flux. DEB theory takes this as a result of depleting reserve, which not only causes a levelling of, but even a decline of dioxygen use prior to hatching, as is really clear in eggs of the pig‐nosed turtle, Carettochelys insculpta, and the Australian freshwater crocodile, Crocodylus johnsoni (Zonneveld & Kooijman, 1993), where embryos delay hatching by waiting for their nest mates to be ready for synchronous hatching.
Coherence and consistency are crucial conditions for comparing eco‐physiological traits within and between taxa, and we believe that using DEB model‐derived traits greatly adds to both of these prerequisites (Kooijman et al., 2021). Furthermore, it bypasses the data limitations which are often imposed when a broader (or more in‐depth) analysis is required (Wood et al., 2018), because (i) DEB models need relatively few data to parameterize (Marques et al., 2018), and (ii) all traits can be computed for all species for which DEB parameters have been estimated, which is currently over 3000 animal species (AmP, 2021). Analyzing trait patterns then further improves the process of parameter estimation for a species of interest, resulting in a better predictions and more in‐depth knowledge about the species. Knowledge about metabolic performance under various external and internal pressures is key to conservation biology, sustainable management and environmental risk assessment, which are seen as interlinked fields with much to gain from coherent and applicable predictive models (Wood et al., 2018).
AUTHOR CONTRIBUTIONS
Nina Marn: Data curation (equal); Investigation (equal); Validation (equal); Writing—review and editing (equal). Sebastiaan A. L. M. Kooijman: Conceptualization (equal); Data curation (equal); Formal analysis (equal); Investigation (equal); Software (equal); Writing—original draft (equal).
CONFLICT OF INTEREST
The authors declare no conflict of interest.
ACKNOWLEDGEMENTS
We like to thank all who contributed to the Add‐my‐Pet collection.
1.
TABLE A1.
Testudines and Crocodilia species that are included in the AmP collection at 2021/10/02, the data types as extracted from the literature and selected references. Data were also obtained from websites, which are presented in the AmP website for each entry. The codes of the data types are presented in Table A2
| Species | Data | References |
|---|---|---|
| Actinemys marmorata | am, Lp, Li, Wwb, Wwi, Ri, t‐L | Germano and Riedle (2015) |
| Aldabrachelys gigantea | ab, ap, am, Lb, Lp, Li, Wwb, Wwp, Wwi, Ri | Ernst and Barbour (1989) |
| Alligator mississippiensis | ab, ap, am, Lp, Li, Ww0, Wwi, Ri, t‐L | Deeming and Ferguson (1991), Jacobson and Kushlan (1989) |
| Alligator sinensis | ab, ap, am, Lp, Li, Ww0, Wwb, Wwi, Ri, t‐L, t‐Ww | Herbert et al. (2002) |
| Apalone mutica | am, Lp, Li, Wwb, Wwi, t‐L, L‐N | Plummer (1977) |
| Apalone spinifera | ab, ap, am, Lb, Lp, Li, Wwb, Wwi, Ri, t‐L, L‐dL | Plummer and Mills (2015) |
| Astrochelys yniphora | ab, am, Lb, Lp, Li, Wwp, Wwi, Ri, L‐dL | Smith et al. (2001) |
| Batagur affinis | ab, ap, am, Lb, Lp, Li, Ww0, Wwb, Wwi, Ri, t‐Ww, t‐L | Hairul and Shahrul Anuar (2014), Moll et al. (2015) |
| Batagur baska | ab, ap, am, Wwb, Wwi, Ri, t‐Ww | Weissenbacher et al. (2015) |
| Caiman crocodilus | ab, ap, am, Lb, Lp, Li, Ww0, Wwi, Ri, t‐L | Campos et al. (2008), Miranda et al. (2002), Mourao et al. (2014) |
| Caiman latirostris | ab, ap, am, Lp, Li, Wwb, Wwi, Ri, t‐L | Viotto et al. (2020) |
| Caiman yacare | ap, am, Lb, Lp, Li, Wwb, Wwi, Ri, t‐L | Mourao et al. (2014) |
| Caretta caretta | ah, ab, ap, am, Lh, Lb, Lp, Li, Wwh, Wwb, Wwp, Wwi, Ri, E0, T‐ah, t‐L_T, t‐Ww_T, L‐Ww, L‐N, L‐dL, L0‐Lt | Bjorndal et al. (2000), Bjorndal et al. (2013), Braun‐McNeill et al. (2008), Byrd et al. (2005), Ehrhart and Yoder (1978), Godfrey and Mrosovsky (1997), Hawkes et al. (2005), Hays and Speakman (1991), Hildebrand and Hatsel (1927), Miller et al. (2003), Norton (2005), Parker (1926, 1929), Reich et al. (2008), Scott et al. (2012), Snover et al. (2007), Spotila (2004), Stokes (2014), Stokes et al. (2006), Stoneburner (1980), Tiwari and Bjorndal (2000), Tucker (2010), Wabnitz and Pauly (2008), Zug et al. (1986) |
| Caretta caretta MED | ah, ab, ap, am, Lb, Lp, Li, Wwb, Wwp, Wwi, Ri, E0, T‐ah, t‐L_fT, t‐Ww_T, L‐Ww, L‐N | Broderick et al. (2003), Casale et al. (2011, 2009), Cateau (2014), Godfrey and Mrosovsky (1997), Groombridge (1990), Hays and Speakman (1991), Margaritoulis et al. (2003), Marn et al. (2019), Piovano et al. (2011), Reid et al. (2009), Stokes (2014), Tiwari and Bjorndal (2000), Zbinden et al. (2006) |
| Carettochelys insculpta | ap, am, Lb, Lp, Li, Wwb, Wwp, Wwi, Ri, t‐WwVe, t‐JOe, t‐WwYe | Doody et al. (2003), Webb et al. (1986) |
| Centrochelys sulcata | ap, am, Wwb, Wwi, Ri, t‐Ww, L‐Ww | Ritz et al. (2010) |
| Chelodina oblonga | ab, ap, am, Lb, Lp, Li, Wwb, Ri, L‐dL, t‐L, L‐Ww | Ernst and Barbour (1989), Kennett (1996) |
| Chelonia mydas | ah, ab, ap, am, Lh, Lp, Li, Wwh, Wwp, Wwi, Ri, E0, T‐ah, t‐WwYe_T, t‐WwVe_T, t‐JOe_T, t‐JCe_T, L0‐Lt, L‐Ww | Balazs and Chaloupka (2004), Balazs and Ross (1974), Bell et al. (2005), Bjorndal and Carr (1989), Broderick et al. (2003), Chaloupka et al. (2004), Christens (1990), Ekanayake et al. (2016), Frazer and Ehrhart (1985), Frazer and Ladner (1986), Goshe et al. (2010), Guinea (2009), Hendrickson (1958), K.S. et al. (2014), Limpus (1993), Limpus and Fien (2009), Limpus and Nicholls (1988), Limpus et al. (2005), Moreira et al. (1995), Pereia et al. (2011), Prince (2017), Rusli et al. (2016), Salmon et al. (2009), Troeng and Chaloupka (2007), Venkatesan et al. (2005), Wine (2016), Zurita et al. (2012) |
| Chelonoidis niger | ab, ap, am, Lb, Li, Wwb, Wwi, Ri, t‐Ww | Ritz et al. (2010) |
| Chelus fimbriata | ab, am, Lb, Lp, Li, L_t, Wwb, Wwi, Ww_t, Ri, t‐L | Prithard (2008) |
| Chelydra serpentina | ap, am, Lp, Li, Wwb, Wwi, Ww_L, Ri, t‐Ww, T‐a_b | Williamson et al. (1989), Yntema (1978) |
| Chrysemys picta | ab, ap, am, Li, Wwb, Ri, t‐L, t‐Ww | Rowe (1994), Wilbur (1975) |
| Claudius angustatus | ab, ap, am, Lb, Lp, Li, Wwb, Wwp, Wwi, Ri | Legler and Vogt (2013) |
| Clemmys guttata | ab, ap, am, Lb, Lp, Li, Wwi, Ri, t‐L | Ernst (1975) |
| Crocodylus acutus | ab, ap, am, Lb, Lp, Li, Wwb, Wwi, Ri, L0‐Lt, L‐Ww | García‐Grajales et al. (2012) |
| Crocodylus intermedius | ap, am, Lb, Lp, Li, Wwi, Ri, t‐L | Seijas (2016) |
| Crocodylus johnsoni | ab, ap, am, Lb, Lp, Li, Wwb, Wwp, Wwi, Ri, t‐WwYe, t‐WwVe, t‐JOe | Whitehead (1987), Whitehead et al. (1990) |
| Crocodylus mindorensis | ab, ap, am, Lp, Li, Wwb, Wwp, Wwi, Ri | Marzola et al. (2014) |
| Crocodylus moreletii | ab, ap, am, Lb, Lp, Li, Wwb, Wwi, Ri, L0‐Lt, L‐Ww | Pérez‐Higareda et al. (1995) |
| Crocodylus niloticus | ab, ap, am, Lb, Lp, Li, Wwb, Wwp, Wwi, Ri, L‐Ww | Ngwanya et al. (2013) |
| Crocodylus palustris | ab, ap, am, Lb, Lp, Li, Wwb, Wwi, Ri | Brien (2015) |
| Crocodylus porosus | ab, ap, am, Lb, Lp, Li, Wwb, Wwp, Wwi, Ri, L‐Ww | |
| Crocodylus rhombifer | ab, ap, am, Lp, Li, Wwb, Wwi, Ri | Targarona et al. (2010) |
| Crocodylus siamensis | ab, ap, am, Lb, Lp, Li, Wwi, Ri, L‐Ww | Chentanez et al. (1983), Kanwatakid‐Savini et al. (2012) |
| Cuora flavomarginata | ab, ap, am, Lb, Lp, Li, Wwb, Wwp, Wwi, Ri, t‐L | Chen and Lue (2002) |
| Deinosuchus rugosus | ap, am, Li, Wwi, Ri, t‐L | Erickson and Brochu (1999) |
| Deirochelys reticularia | ab, ap, am, Lb, Lp, Li, Wwb, Wwi, Ri, t‐L | Buhlmann et al. (2009) |
| Dermatemys mawii | ab, ap, am, Lb, Lp, Li, L_t, Wwb, Wwp, Wwi, Ww_t, Ri | Legler and Vogt (2013) |
| Dermochelys coriacea | ab, ap, am, Lb, Lp, Li, Wwb, Wwi, Ri, JXi, pAi, t‐L_f, t‐Ww | Jones (2009) |
| Elseya albagula | ab_T, ap, am, Lb, Lp, Li, Ww0, Wwi, Ri, t‐L | Limpus (2008) |
| Elseya dentata | ab, ap, am, Lb, Lp, Li, Wwb, Wwp, Wwi, Ri, L‐dL, t‐L | Ernst and Barbour (1989), Kennett (1996) |
| Elusor macrurus | ab, ap, am, Lb, Lp, Li, Wwi, Ri, t‐L | Limpus (2008) |
| Emydoidea blandingii | ab, ap, am, Lb, Li, Wwb, Wwi, Ri, t‐L, t‐Ww | Congdon and van Loben Sels (1991) |
| Emydura macquarii | ab_T, ap, am, Lb, Lp, Li, Wwb, Wwp, Wwi, Ri, t‐L | Spencer (2002) |
| Emydura victoriae | ab, ap, am, Wwb, Wwi, Ri, t‐Ww | Gaikhorst et al. (2011) |
| Emys orbicularis | ab, ap, am, Lb, Lp, Li, Wwb, Ri, t‐L, t‐Ww | Masin et al. (2015) |
| Eretmochelys imbricata | ab, ap, am, Lb, Li, Wwb, Wwi, Ri, t‐L | Bell and Pike (1980), Witzell (1980) |
| Gavialis gangeticus | ab, ap, am, Lb, Lp, Li, L_t, Ww0, Wwb, Wwi, R_L | |
| Geochelone elegans | ab, ap, am, Lb, Li, Ww0, Wwb, Wwi, Ri, t‐Ww, t‐L | Vyas (1997) |
| Glyptemys insculpta | ab, ap, am, Lb, Lp, Li, Wwb, Wwi, Ri, t‐L | Marchand et al. (2018) |
| Glyptemys muhlenbergii | ab, ap, am, Lb, Lp, Li, Wwi, Ri, t‐L | Lovich et al. (1998) |
| Gopherus agassizii | ab, ap, am, Lb, Lp, Li, Wwb, Wwp, Wwi, Ri, t‐L | Ernst and Barbour (1989), Medica et al. (2012) |
| Gopherus berlandieri | ab, ap, am, Lb, Li, Wwb, Ri, t‐Ww, t‐L | Judd and McQueen (1980) |
| Gopherus morafkai | ab, ap, am, Lb, Lp, Li, Wwb, Wwi, Ri, t‐L | Averill‐Murray et al. (2018), Bridges (2012) |
| Gopherus polyphemus | ab, ap, am, Lb, Lp, Li, Wwb, Wwp, Wwi, Ri, t‐L | Ernst and Barbour (1989), Mushinsky et al. (1994) |
| Graptemys caglei | ab, ap, am, Lb, Li, Wwi, Ri, t‐L | Lindeman (1999) |
| Graptemys ernsti | ab, ap, am, Lb, Li, Wwi, Ri, t‐L | Lindeman (1999) |
| Graptemys oculifera | ab, ap, am, Lb, Li, Wwb, Wwi, Ri, t‐L | Jones and Hartfield (1995) |
| Graptemys ouachitensis | ab, am, Lb, Lp, Li, Wwi, Ri, t‐L | Lindeman (1999) |
| Graptemys pseudogeographica | ab, am, Lb, Lp, Li, Wwi, Ri, L‐r | Webb (1961) |
| Graptemys versa | ab, ap, am, Lb, Lp, Li, Wwi, t‐L, L‐N | Lindeman (2005) |
| Heosemys spinosa | ab, am, Lb, Lp, Li, Ww0, Wwb, Wwi, Ri, t‐Ww, L‐Ww | Goetz (2007) |
| Homopus signatus | ab, ap, am, Lb, Lp, Li, Wwb, Wwi, Ri, L‐dL | Loehr (2004) |
| Hydromedusa maximiliani | ab, ap, am, Lb, Lp, Li, Wwb, Wwi, Ri, L‐dL | Martins and Souza (2008), Novelli and de Sousa (2008) |
| Kinosternon flavescens | ab, ap, am, Lb, Li, Wwi, Ri, t‐L, Ww‐WwR | Iverson (1991) |
| Kinosternon hirtipes | ab, ap, am, Lb, Li, Wwi, Ri, t‐L | Iverson et al. (1991) |
| Kinosternon scorpioides | ab, am, Lb, Lp, Li, Ww0, Wwi, Ri, t‐L, t‐Le | dos Santos Braga et al. (2021), Iverson (2010) |
| Kinosternon sonoriense | am, Lb, Lp, Li, Wwb, Wwi, Ri, t‐L | Hensley et al. (2010) |
| Kinosternon subrubrum | ab, ap, am, Lb, Li, Wwi, Ri, t‐L, L‐Ww | Iverson (1979) |
| Lepidochelys kempii | ab, ap, am, Lb, Lp, Li, Wwb, Wwp, Wwi, Ri | Spotila (2004) |
| Lepidochelys olivacea | ab, ap, am, Wwb, Wwp, Wwi, Ri, t‐Ww | Markham and Kirkwood (1988) |
| Macrochelys temminckii | ab, ap, am, Lb, Lp, Li, Wwp, Wwi, Ri, t‐L | Dobie (1971) |
| Malaclemys terrapin | ab_T, ap, am, Wwb, Wwi, Ri, t‐Ww_T | Roosenburg and Kelley (1996) |
| Malacochersus tornieri | ab, ap, am, Lb, Li, L_t, Wwb, Wwi, Ww_t, Ri | Ewert et al. (2004) |
| Mauremys japonica | ap, am, Lb, Lp, Li, Wwb, Wwi, Ri, t‐L | Yabe (1989) |
| Mauremys reevesii | ab, am, Wwb, Wwp, Wwi, Ri, t‐Ww | Du et al. (2009) |
| Mauremys rivulata | ab, ap, am, Lb, Lp, Li, Wwi, Ri, t‐L | Çiçek et al. (2016) |
| Mauremys sinensis | ap, am, Lb, Lp, Li, Wwb, Wwp, Wwi, Ri, t‐L | Chen and Lue (1998) |
| Mecistops cataphractus | ab, ap, am, Lp, Li, Ww0, Wwb, Wwi, Ri | |
| Melanochelys tricarinata | ap, am, Lb, Lp, Li, Wwb, Wwi, Ri, t‐L, L‐Ww | Kumar et al. (2010) |
| Melanosuchus niger | ab, am, Lp, Li, Wwb, Wwi, Ri, L‐L | Herron (1991) |
| Myuchelys bellii | ab, ap, am, Lb, Lp, Li, Ww0, Wwi, Ri, t‐L | Fielder et al. (2015) |
| Natator depressus | ah, ab, ap, am, Lh, Lb, Lp, Li, Ww0, Wwh, Wwp, Wwi, Ri, E0, T‐ah, L0‐Lt, L‐Ww, t‐Ww | Bentley (2017), Limpus (2007), Rusli et al. (2016), Salmon (2017), Stubbs et al. (2019), Venkatesan et al. (2005), Wine (2016) |
| Osteolaemus tetraspis | ab, ap, am, Lp, Li, Ww0, Wwb, Wwi, Ri | |
| Paleosuchus palpebrosus | ab, ap, am, Lb, Lp, Li, Wwb, Wwi, Ri, t‐L | Campos et al. (2013) |
| Paleosuchus trigonatus | ab, ap, am, Lp, Li, Wwb, Wwi, Ri, t‐L, t‐Ww | |
| Pangshura tecta | ab, ap, am, Lb, Lp, Li, Wwb, Wwi, Ri, t‐L, t‐Ww | Vyas (1979) |
| Pelodiscus sinensis | am, Lp, Li, Wwb, Wwi, Ri, t‐Ww, T‐ab | Ji et al. (2003) |
| Pelomedusa subrufa | ab, ap, am, Lb, Lp, Li, Wwb, Wwp, Wwi, L‐N | Strydom (2001) |
| Pelusios castanoides | ab, ap, am, Lb, Lp, Li, Wwp, Wwi, Ri, t‐L | Gerlach (2008) |
| Pelusios subniger | ab, ap, am, Lb, Lp, Li, Wwp, Wwi, Ri, t‐L | Gerlach (2008) |
| Platysternon megacephalum | ab, ap, am, Lp, Li, Wwb, Ri, L‐Ww | Sung et al. (2014), Sung et al. (2015) |
| Podocnemis expansa | ab, ap, am, Lb, Lp, Li, Wwb, Wwp, Wwi, Ri, t‐L_e, t‐L | Chinsamya and Valenzuela (2008), Magalhāes et al. (2017) |
| Podocnemis lewyana | ap, am, Lb, Lp, Li, Wwb, Wwi, Ri, L‐dL, T‐ab | Páaez et al. (2015), Páez et al. (2009) |
| Podocnemis unifilis | ab, ap, am, Lb, Lp, Li, Wwb, Wwp, Wwi, Ri, t‐L_f, t‐Ww_f | Meers et al. (2016), Miorando et al. (2015) |
| Psammobates geometricus | ab, ap, am, Lb, Lp, Li, Wwi, Ri, L‐dL | Baard (1995) |
| Psammobates oculiferus | am, Lb, Lp, Li, Wwp, Ri, t‐L, t‐Ww | Keswick (2012) |
| Pseudemydura umbrina | ab, ap, am, Lb, Lp, Li, Wwb, Wwp, Wwi, Ri, L‐Ww, t‐L_f, t‐Ww_f, T‐JO | Arnall (2018), Arnall et al. (2015), Burbidge (1981), Burbidge et al. (2010) |
| Pseudemys alabamensis | ab, ap, am, Lb, Li, Ri, t‐L, L‐Ww | Graham (1971) |
| Pseudemys concinna | ab, ap, am, Lb, Li, Wwb, Wwi, Ri, t‐L | Dreslik (1997) |
| Pseudemys nelsoni | ab, ap, am, Lb, Li, Wwb, Wwi, Ri, L0‐Lt | Munscher et al. (2015) |
| Pseudemys peninsularis | ap, am, Lb, Li, Wwi, Ri, L0‐Lt | Munscher et al. (2015) |
| Pseudemys texana | ab, ap, am, Lb, Lp, Li, Wwi, Ri, t‐L | Lindeman (2007) |
| Rhinemys rufipes | ab, ap, am, Lb, Lp, Li, Wwp, Wwi, Ri, L0‐Lt | Magnusson et al. (1997) |
| Sternotherus depressus | ab, ap, am, Lb, Li, Wwi, Ri, L‐r | Melancon et al. (2011) |
| Sternotherus minor | ab, ap, am, Lb, Lp, Li, Wwb, Wwi, Ri, L‐r | Becker (2003), Cox et al. (1991) |
| Sternotherus odoratus | ab, ap, am, Lb, Li, Wwi, Ri, t‐L | Ernst (1986) |
| Stigmochelys pardalis | ab, ap, am, Li, Wwb, Wwi, Ri, t‐Ww, L‐Ww | Ritz, Hammer, et al. (2010) |
| Terrapene carolina | ab, ap, am, Lb, Lp, Li, Wwi, Ri, t‐L | Ernst et al. (1998) |
| Terrapene ornata | ab, ap, am, Lb, Li, Wwi, Ri, t‐L, L‐Ww | Skorczewski and Andersen (2021) |
| Testudo graeca | ab_T, ap, am, Wwb, Ri, t‐Ww | Hichami et al. (2016), Ritz et al. (2012) |
| Testudo hermanni | ab, ap, am, Lp, Li, Wwb, Wwi, Ri, t‐Ww | Ritz et al. (2012) |
| Tomistoma schlegelii | ab, ap, am, Lp, Li, Ww0, Wwi, Ri | |
| Trachemys scripta | ab, ap, am, Lb, Li, Wwb, Wwi, Ri, t‐L | Frazer et al. (1990) |
| Trionyx triunguis | am, Lp, Li, Ww0, Wwb, Wwi, Ri, t‐Wwe, t‐Wde, t‐JOe | Leshem et al. (1991) |
TABLE A2.
The codes of the data types as presented in Table 1. Zero variate data left, uni‐variate data right. Life history events: 0 start development, h hatch, b birth, p puberty, m death, i death. T stands for temperature
| Code | Description | Code | Description |
|---|---|---|---|
| ah | age at h | t‐Le | time, embryo length |
| ab | age at birth | t‐L | time, length |
| ab_T | age at birth (several T) | t‐L_T | time, length (several T) |
| ap | age (or time since birth) at p | t‐L_f | time, length (several f) |
| am | age at death (life span) | t‐L_fT | time, length (several f, T) |
| Lh | length at h | t‐Wwe | time, embryo wet weight |
| Lb | length at b | t‐WwYe | time, embryo yolk wet weight |
| Lp | length at p | t‐WwVe | time, embryo wet weight excluding yolk |
| Li | length at i | t‐Ww | time, wet weight |
| L_t | length at time t | t‐Ww_f | time, wet weight (several f) |
| Ww0 | wet weight at 0 | t‐Ww_T | time, wet weight (several T) |
| Wwh | wet weight at h | t‐Wde | time, embryo dry weight (total) |
| Wwb | wet weight at b | t‐JOe | time, embryo O2 consumption |
| Wwp | wet weight at p | t‐JOe_T | time, embryo O2 cons (several T) |
| Wwi | wet weight at i | L‐L | length, length (different length measures) |
| Ww_L | wet weight at length | L‐dL | length, change in length |
| Ww_t | wet weight at time | L0‐Lt | length at capture, length at recapture |
| E0 | reserve energy at 0 | L‐Ww | length, wet weight |
| Ri | reproduction rate at i | L‐r | length, specific growth rate |
| R_L | reproduction rate at length | L‐N | length, number of eggs/offspring |
| pAi | maximum assimilation rate (energy) | Ww‐WwR | wet weight, clutch wet weight |
| JXi | food consumption at i | T‐ah | temperature, age at h |
| T‐ab | temperature, age at b | ||
| T‐JO | temperature, O2 consumption |
FIGURE A1.

Supply stress for reptiles as function of ultimate weight (on a semi‐log scale on panel a, and log‐log scale on panel b) for: turtles (blue circles), crocodiles (red triangles), squamates and tuatara (black dots) and extinct reptiles (gray dots). Turtles show the largest range for this trait of the three reptile groups, implying a big diversity within this group: those living in the extreme conditions ‐ such as the desert serrated tortoise (Psammobates oculiferus) have a five times lower supply stress than those turtles living in freshwater ponds and rivers of temperate areas. The extremes are matched by a desert snake (Psammophylax rhombeatus) on the extreme supply‐end and mountain grasslizard (Takydromus hsuehshanensis) on the extreme demand‐end of the spectrum
FIGURE A2.
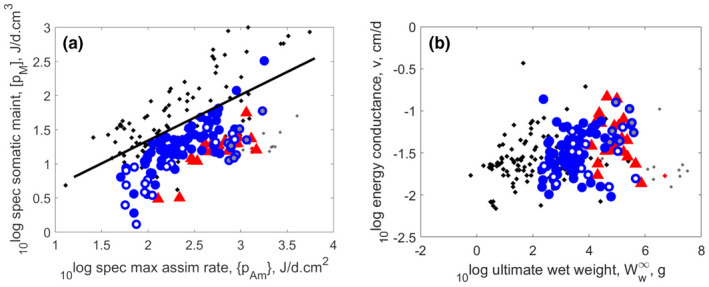
Panel (a): Volume specific maintenance rate, , as function of area‐specific maximum assimilation rate . Slope 2/3 is plotted in panel a, as the ration between surface area and volume of structure. Panel b: Conductance, , as function of ultimate wet weight
FIGURE A3.

Panel (a): Precociality coefficient as a function of maximum specific assimilation rate . Panel (b): as function of allocation to soma (). There is substantial scatter in the traits, but lines could be drawn for illustration; slope between −0.5 and −0.6 fits well in panel a. There is no clear relationship between and for reptiles in general, except for tortoises (empty blue circles) where there seems to be a slight negative correlation. Even though crocodiles (red triangles) as a group have the lowest median precociality coefficient of all the reptiles (see also Figure 1), sea turtles (grey blue circles) have even lower values for than crocodiles
Marn, N. , & Kooijman, S. A. L. M. (2022). The comparative energetics of the turtles and crocodiles. Ecology and Evolution, 12, e8996. 10.1002/ece3.8996
Funding information
This work was supported by Croatian science foundation (HRZZ) [project AqADAPT no. IP‐2018‐01‐3150 to NM].
DATA AVAILABILITY STATEMENT
The underlying data come from published literature. The data and the references to where it comes from can be found on the Add‐my‐Pet website https://www.bio.vu.nl/thb/deb/deblab/add_my_pet as well as on its mirror at https://debtheory.fr/add_my_pet/. There you can also find the code that has been used to estimate parameter values for each species. This code uses the software packages AmPtool AmP, 2021 and DEBtool DEBtool, 2021, which are freely available via Github: https://github.com/orgs/add‐my‐pet/repositories. A selection of references to data for each species is also given in the Appendix.
REFERENCES
- AmP (2021). AmP collection. https://www.bio.vu.nl/thb/deb/deblab/add_my_pet/, https://debtheory.fr/add_my_pet/ Add‐my‐Pet collection, online database of DEB parameters, implied properties and referenced underlying data
- AmPtool (2021). Software package AmPtool. https://github.com/add‐my‐pet/AmPtool
- Arnall, S. (2018). Unpublished data.
- Arnall, S. G. , Kuchling, G. , & Mitchell, N. J. (2014). A thermal profile of metabolic performance in the rare Australian chelid, Pseudemydura umbrina . Australian Journal of Zoology, 62, 448–453. [Google Scholar]
- Arnall, S. , Kuchling, G. , & Mitchell, N. (2015). A thermal profile of metabolic performance in the rare Australian chelid, Pseudemydura umbrina . Australian Journal of Zoology, 62, 448–453. [Google Scholar]
- Arnall, S. G. , Mitchell, N. J. , Kuchling, G. , Durell, B. , Kooijman, S. A. L. M. , & Kearney, M. R. (2019). Life in the slow lane? A dynamic energy budget model for the western swamp turtle, Pseudemydura umbrina . Journal of Sea Research, 143, 89–99. [Google Scholar]
- Augustine, S. , Lika, K. , & Kooijman, S. A. L. M. (2019). Altricial‐precocial spectra in animal kingdom. Journal of Sea Research, 143, 27–34. [Google Scholar]
- Augustine, S. , Lika, K. , & Kooijman, S. A. L. M. (2021). The comparative energetics of the chondrichthyans. Journal of Sea Research accepted. 10.1016/j.seares.2022.102228 [DOI] [Google Scholar]
- Averill‐Murray, R. C. , Christopher, T. E. , & Henen, B. T. (2018). Reproductive ecology and life history of female Sonoran desert tortoises (Gopherus morafkai). Herpetological Monographs, 32(1), 34–50. [Google Scholar]
- Baard, E. H. W. (1995). Growth, age at maturity and sexual dimorphism in the geometric tortoise, Psammobates geometricus . The Journal of the Herpetological Association of Africa, 44(1), 10–15. [Google Scholar]
- Balazs, G. , & Chaloupka, M. (2004). Spatial and temporal variability in the somatic growth of green sea turtles Chelonia mydas resident in the hawaiian archipelago. Marine Biology, 145(5), 1043–1059. [Google Scholar]
- Balazs, G. , & Ross, E. (1974). Observations on the preemergence behaviour of the green turtle. Copeia, 1974(4), 986–988. [Google Scholar]
- Becker, H. (2003). Comments on keeping and breeding the loggerhead musk turtle, Sternotherus minor minor (Agassiz, 1857). Radiata, 12(1), 3–10. [Google Scholar]
- Beekman, M. , Thompson, M. B. , & Jusup, M. (2019). Thermodynamic constraints and the evolution of parental provisioning in vertebrates. Behavioral Ecology, 30(3), 583–591. [Google Scholar]
- Bell, C. , Parsons, J. , Austin, T. , Broderick, A. , Ebanks‐Petrie, G. , & Godley, B. (2005). Some of them came home: the cayman turtle farm headstarting project for the green turtle Chelonia mydas . Oryx, 39(2), 137–148. [Google Scholar]
- Bell, I. , & Pike, D. A. (1980). Somatic growth rates of hawksbill turtles Eretmochelys imbricata in a northern Great Barrier Reef foraging area. Marine Ecology Progress Series, 446, 275–283. [Google Scholar]
- Bentley, B. (2017). Lab data collected at UWA, Perth by Blair Bentley. Data is unpublished. University of Western Australia (UWA). [Google Scholar]
- Bjorndal, K. A. , Bolten, A. B. , & Martins, H. R. (2000). Somatic growth model of juvenile loggerhead sea turtles Caretta caretta: duration of pelagic stage. Marine Ecology Progress Series, 202, 265–272. [Google Scholar]
- Bjorndal, K. , & Carr, A. (1989). Variation in clutch size and egg size in the green turtle nesting population at torteguero, costa rica. Herpetologica, 45(2), 181–189. [Google Scholar]
- Bjorndal, K. A. , Schroeder, B. A. , Foley, A. M. , Witherington, B. E. , Bresette, M. , Clark, D. , Herren, R. M. , Arendt, M. D. , Schmid, J. R. , Meylan, A. B. , Meylan, P. A. , Provancha, J. A. , Hart, K. M. , Lamont, M. M. , Carthy, R. R. , & Bolten, A. B. (2013). Temporal, spatial, and body size effects on growth rates of loggerhead sea turtles (Caretta caretta) in the Northwest Atlantic. Marine Biology, 160(10), 2711–2721. [Google Scholar]
- Bolten, A. B. , Crowder, L. B. , Dodd, M. G. , MacPherson, S. L. , & Musick, J. A. (2011). Quantifying multiple threats to endangered species: an example from loggerhead seaturtles. Frontiers in Ecology and the Environment, 9(5), 295–301. [Google Scholar]
- Braun‐McNeill, J. , Epperly, S. P. , Avens, L. , Snover, M. L. , & Taylor, J. C. (2008). Growth rates of loggerhead sea turtles (Caretta caretta) from the western North Atlantic. Herpetological Conservation and Biology, 3(2), 273–281. [Google Scholar]
- Bridges, A. (2012). Sonoran Desert Tortoise (Gopherus morafkai) Growth and Juvenile Habitat Selection at a Long‐term Study Site in Central Arizona, USA. PhD thesis, Arizona State University. [Google Scholar]
- Brien, M. L. (2015). Growth and survival of hatchling saltwater crocodiles (Crocodylus porosus) in captivity: the role of agonistic and thermal behaviour. PhD thesis, Research Institute for the Environment and Livelihoods, Charles Darwin University. [Google Scholar]
- Broderick, A. C. , Glen, F. , Godley, B. J. , & Hays, G. C. (2003). Variation in reproductive output of marine turtles. Journal of Experimental Marine Biology and Ecology, 288, 95–109. [Google Scholar]
- Buhlmann, K. A. , Congdon, J. D. , Gibbons, J. W. , & Greene, J. L. (2009). Ecology of chicken turtles (Deirochelys reticularia) in a seasonal wetland ecosystem: Exploiting resource and refuge environments. Herpetologica, 65(1), 39–53. [Google Scholar]
- Burbidge, A. A. (1981). The ecology of the western swamp tortoise Pseudemydura umbrina (Testudines: Chelidae). Australian Wildlife Research, 8, 203–223. [Google Scholar]
- Burbidge, A. A. , Kuchling, G. , Olejnik, C. , & Mutter, L. (2010). Western swamp tortoise (Pseudemydura umbrina) recovery plan, 4th ed. Technical report. Govement of Western Australia, Department of Environment and Conservation. https://www.awe.gov.au/sites/default/files/documents/western‐swamp‐tortoise‐recovery‐plan.pdf [Google Scholar]
- Byrd, J. , Murphy, S. , & von Harten, A. (2005). Morphometric analysis of the northern subpopulation of Caretta caretta in South Carolina, USA. Marine Turtle Newsletter, 107, 1–4. [Google Scholar]
- Calder, W. A. III (1984). Size, function and life history. Harvard University Press. [Google Scholar]
- Campos, Z. , Magnusson, W. E. , & Marques, V. (2013). Growth rates of Paleosuchus palpebrosus at the southern limit of its range. Herpetologica, 69(4), 405–410. [Google Scholar]
- Campos, Z. , Magnusson, W. E. , Sanaiotti, T. , & Coutinho, M. (2008). Reproductive trade‐offs in Caiman crocodilus crocodilus and Caiman crocodilus yacare: implications for size‐related management quotas. Herpetological Journal, 18, 91–96. [Google Scholar]
- Casale, P. , Conte, N. , Freggi, D. , Cioni, C. , & Argano, R. (2011). Age and growth determination by skeletochronology in loggerhead sea turtles (Caretta caretta) from the Mediterranean sea. Scientia Marina, 75(1), 197–203. [Google Scholar]
- Casale, P. , dAstore, P. P. , & Argano, R. (2009). Age at size and growth rates of early juvenile loggerhead sea turtles (Caretta caretta) in the Mediterranean based on length frequency analysis. Herpetological Journal, 19, 29–33. [Google Scholar]
- Cateau, S. (2014). Personal communication.
- Chaloupka, M. , Limpus, C. , & Miller, J. (2004). Green turtle somatic growth dynamics in a spatially disjunct great barrier reef metapopulation. Coral Reefs, 23, 325–335. [Google Scholar]
- Chen, T.‐H. , & Lue, K.‐Y. (1998). Ecology of the chinese stripe‐necked turtle, Ocadia sinensis (Testudines: Emydidae), in the Keelung River, Northern Taiwan. Copeia, 4, 944–952. [Google Scholar]
- Chen, T.‐H. , & Lue, K.‐Y. (2002). Growth patterns of the yellow‐margined box turtle (Cuora flavomarginata) in Northern Taiwan. Journal of Herpetology, 36(2), 201–208. [Google Scholar]
- Chentanez, T. , Huggins, S. E. , & Chentanez, V. (1983). Allometric relationships of th Siamese crocodile, Crocodylus siamensis . J. Sci. Soc. Thailand, 9, 5–26. [Google Scholar]
- Chinsamya, A. , & Valenzuela, N. (2008). Skeletochronology of the endangered side‐neck turtle, Podocnemis expansa . South African Journal of Science, 104, 311–314. [Google Scholar]
- Christens, E. (1990). Nest emergence lag in loggerhead sea turtles. Journal of Herpetology, 24(4), 400–402. [Google Scholar]
- Çiçek, K. , Kumas, M. , Ayaz, D. , & Tok, C. V. (2016). A skeletochronological study of age, growth and longevity in two freshwater turtles, Emys orbicularis and Mauremys rivulata, from Mediterranean Turkey (Reptilia: Testudines). Zoology in the Middle East, 62, 29–38. [Google Scholar]
- Congdon, J. D. , & van Loben Sels, R. C. (1991). Growth and body size in blanding's turtles (Emydoidea blandingi): relationships to reproduction. Canadian Journal of Zoology, 69, 239–245. [Google Scholar]
- Cooke, S. , Sack, L. , Franklin, C. , Farrell, A. , Beardall, J. , Wikelski, M. , & Chown, S. (2013). What is conservation physiology? perspectives on an increasingly integrated and essential science. Conservation . Physiology, 1(1), cot001. [DOI] [PMC free article] [PubMed] [Google Scholar]
- Cox, W. A. , Hazelrig, J. B. , Turner, M. E. , Aangus, R. A. , & Marion, K. R. (1991). A model for growth in the musk turtle, Sternotherus minor, in a North Florida spring. Copeia, 1991(4), 954–968. [Google Scholar]
- DEBtool (2021). Software package DEBtool_M. https://github.com/add‐my‐pet/DEBtool_M [Google Scholar]
- Deeming, D. C. , & Ferguson, M. W. J. (1991). Egg incubation; its effects on embryonic development in birds and reptiles. Cambridge University Press. [Google Scholar]
- Dobie, J. L. (1971). Reproduction and growth in the alligator snapping turtle, Macroclemys temmincki (troost). Copeia, 1971(4), 645–658. [Google Scholar]
- Doody, J. S. , Georges, A. , & Young, J. E. (2003). Twice every second year: reproduction in the pig‐nosed turtle, Carettochelys insculpta, in the wet‐dry tropics of Australia. Journal of Zoology, 259, 179–188. [Google Scholar]
- dos Santos Braga, B. S. , Fernandes‐Neto, D. L. , Silva, R. P. L. S. R. , Ferreira, M. A. P. , Oliveira‐Bahia, V. R. , Marques, J. R. F. , & de Araújo Guimarães, D. A. (2021). Embryonic development of Kinosternon scorpioides (Testudines: Kinosternidae). Zoomorphology, 140, 279–290. [Google Scholar]
- Dreslik, M. J. (1997). Ecology of the river cooter, Pseudemys concinna, in a southern Illinois floodplain lake. Herpetological Natural History, 5(2), 135–145. [Google Scholar]
- Du, W.‐G. , Shen, J.‐W. , & Wang, L. (2009). Embryonic development rate and hatchling phenotypes in the Chinese three‐keeled pond turtle (Chinemys reevesii): The influence of fluctuating temperature versus constant temperature. Journal of Thermal Biology, 34, 250–255. [Google Scholar]
- Ehrhart, L. M. , & Yoder, R. G. (1978). Marine turtles of Merritt island national wildlife refuge, Kennedy space center, Florida. In Florida marine research publication (Vol. 33, pp. 25–30). Proceedings of the Florida and interregional conference on sea turtles, July 1976, Jensen Beach, Florida, USA. [Google Scholar]
- Ekanayake, E. , Kapurusinghe, T. , Saman, M. , Rathankumara, D. , Samaraweera, P. , & Rajakaruna, R. (2016). Reproductive output and morphometrics of green turtle, Chelonia mydas nesting at the kosgoda rookery in Sri lanka. Ceylon Journal of Science, 45(3), 103–116. [Google Scholar]
- Erickson, G. M. , & Brochu, C. A. (1999). How the terror crocodile grew so big. Nature, 398, 205–206. [Google Scholar]
- Ernst, C. H. (1975). Growth of the spotted turtle, Clemmys guttata . Journal of Herpetology, 9(3), 313–318. [Google Scholar]
- Ernst, C. H. (1986). Ecology of the turtle, Sternotherus odoratus, in southeastern Pennsylvania. Journal of Herpetology, 20(3), 341–352. [Google Scholar]
- Ernst, C. H. , & Barbour, R. W. (1989). Turtles of the world. Smithsonian Institution Press. [Google Scholar]
- Ernst, C. H. , Wilgenbusch, J. C. , Boucher, T. P. , & Sekscienski, S. W. (1998). Growth, allometry and sexual dimorphism in the Florida box turtle, Terrapene carolina Bauri. Herpedological Journal, 8, 72–78. [Google Scholar]
- Ewert, M. A. (1979). The embryo and its egg: Development and natural history. In Harless M., & Morlock H. (Eds.), Turtles, perspectives and research (pp. 333–413). Wiley. [Google Scholar]
- Ewert, M. A. , Hatcher, R. E. , & Goode, J. M. (2004). Sex determination and ontogeny in Malacochersus tornieri, the pancake tortoise. Journal of Herpetology, 38(2), 291–295. [Google Scholar]
- Fielder, D. P. , Limpus, D. J. , & Limpus, C. J. (2015). Reproduction and population ecology of the vulnerable western sawshelled turtle, Myuchelys bellii, in the Murray‐Darling Basin, Australia. Australian Journal of Zoology 62(6), 463–476. [Google Scholar]
- Frazer, N. , & Ehrhart, L. (1985). Preliminary growth models for green, Chelonia mydas, and loggerhead, Caretta caretta, turtles in the wild. Copeia, 1985, 73–79. [Google Scholar]
- Frazer, N. B. , Gibbons, J. W. , & Greene, J. L. (1990). Exploring fabens’ growth interval model with data on a long‐lived vertebrate, Trachemys scripta (Reptilia: Testudinata). Copeia, 1990(1), 112–118. [Google Scholar]
- Frazer, N. , & Ladner, R. (1986). A growth curve for green sea turtles, Chelonia mydas, in the us virgin islands, 1913–14. Copeia, 1986(3), 789–802. [Google Scholar]
- Gaikhorst, G. S. , Clarke, B. R. , McPharlin, M. , Larkin, B. , McLaughlin, J. , & Mayes, J. (2011). The captive husbandry and reproduction of the pink‐eared turtle (Emydura victoriae) at Perth Zoo. Zoo Biology, 30, 79–94. [DOI] [PubMed] [Google Scholar]
- Gall, S. , & Thompson, R. (2015). The impact of debris on marine life. Marine Pollution Bulletin, 92(1), 170–179. [DOI] [PubMed] [Google Scholar]
- García‐Grajales, J. , Buenrostro‐Silva, A. , & Charruau, P. (2012). Growth and age of juvenile American crocodiles (Crocodylus acutus in la Ventanilla estuary, Oaxaca, Mexico. Herpetological Conservation and Biology, 7, 330–338. [Google Scholar]
- Gerlach, J. (2008). Fragmentation and demography as causes of population decline in Seychelles freshwater turtles (genus Pelusios). Chelonian Conservation and Biology, 7(1), 78–87. [Google Scholar]
- Germano, D. J. , & Riedle, J. D. (2015). Population structure, growth, survivorship, and reproduction of Actinemys marmorata from a high elevation site in the Tehachapi Mountains, California. Herpetologica, 71(2), 102–109. [Google Scholar]
- Godfrey, M. H. , & Mrosovsky, N. (1997). Estimating the time between hatching of sea turtles and their emergence from the nest. Chelonian Conservation and Biology, 2, 581–585. [Google Scholar]
- Goetz, M. (2007). Husbandry and breeding of the spiny turtle Heosemys spinosa (Gray, 1931) at the Durrell Wildlife Conservation Trust. RADIATA, 16(2), 2–15. [Google Scholar]
- Goshe, L. , Avens, L. , Scharf, F. , & Southwood, A. (2010). Estimation of age at maturitaion and growth of atlantic green turtles Chelonia mydas using skeletochronology. Marine Biology, 157(8), 1725–1740. [Google Scholar]
- Graham, T. E. (1971). Growth rate of the red‐bellied turtle, Chrysemys rubriventris, at Plymouth, Massachusetts. Copeia, 1971(2):353–356. [Google Scholar]
- Groombridge, B. (1990. ). Marine turtles in the Mediterranean: distribution, population status, and conservation. Technical Report 48, Report to the Council of Europe, Environmental Conservation and Management Division.
- Guinea, M. L. (2009). Long term marine turtle monitoring at scott reef. Unpublished report to Sinclair Knight Merz.
- Hairul, M. , & Shahrul Anuar, M. (2014). Developmental stages of southern river terrapin (Batagur affinis) in wildlife conversation center Bota Kanan, Perak, Malaysia. Journal of Wildlife and Parks, 28, 1–7. [Google Scholar]
- Hawkes, L. , Broderick, A. , Godfrey, M. , & Godley, B. (2005). Status of nesting loggerhead turtles Caretta caretta at Bald Head island (North Carolina, USA) after 24 years of intensive monitoring and conservation. Oryx, 39, 65–72. [Google Scholar]
- Hays, G. C. , & Speakman, J. R. (1991). Reproductive investment and optimum clutch size of loggerhead sea turtles (Caretta caretta). Journal of Animal Ecology, 60(2), 455–462. [Google Scholar]
- Hedges, S. B. , & Poling, L. L. (1999). A molecular phylogeny of reptiles. Science, 283(5404), 998–1001. [DOI] [PubMed] [Google Scholar]
- Hendrickson, J. (1958). The green sea turtle, Chelonia mydas (linn) in malaya and sarawak. Journal of Zoology, 130(4), 455–535. [Google Scholar]
- Hensley, F. R. , Jones, T. R. , Maxwell, M. S. , Adams, L. J. , & Nedella, N. S. (2010). Demography, terrestrial behavior, and growth of Sonora mud turtles (Kinosternon sonoriense) in an extreme habitat. Herpetological Monographs, 24, 174–193. [Google Scholar]
- Herbert, J. , Coulson, T. , & Coulson, R. (2002). Growth rates of Chinese and American alligators. Comparative Biochemistry and Physiology Part A, 131, 909–916. [DOI] [PubMed] [Google Scholar]
- Herron, J. C. (1991). Growth rates of black caiman Melanosuehus niger and spectacled caiman Caiman crocodilus, and the recruitment, of breeders in hunted caiman populations. Biological Conservation, 55, 103–113. [Google Scholar]
- Hichami, N. , Znari, M. , Naimi, M. , & Namous, S. (2016). Clutch, egg and hatchling characteristics in the Souss valley tortoises, Testudo graeca soussensis Pieh, 2001 (Testudines: Testudinidae) from an arid steppe‐land of West‐Central Morocco, Africa. Journal of Herpetology, 65, 21–32. [Google Scholar]
- Hildebrand, S. F. , & Hatsel, C. (1927). On the growth, care and behavior of loggerhead turtles in captivity. Proceedings of the National Academy of Sciences of the United States of America, 13(6), 374–377. [DOI] [PMC free article] [PubMed] [Google Scholar]
- Hochscheid, S. , Bentivegna, F. , Bradai, M. N. , & Hays, G. C. (2007). Overwintering behaviour in sea turtles: Dormancy is optional. Marine Ecology Progress Series, 340, 287–298. [Google Scholar]
- Hoyt, D. F. , & Rahn, H. (1980). Respiration of avian embryos‐ a comparative analysis. Respiration Physiology, 39, 255–264. [DOI] [PubMed] [Google Scholar]
- IUCN‐Crocodile‐Specialist‐Group (2021). Conservation status of crocodiles. http://www.iucncsg.org/pages/Conservation‐Status.html
- Iverson, J. B. (1979). Reproduction and growth of the mud turtle, Kinosteron subrubrum (Reptilia, Testudines, Kinosternidae), in Arkansas. Journal of Herpetology, 13(1), 105–111. [Google Scholar]
- Iverson, J. B. (1991). Life history and demography of the yellow mud turtle, Kinosternon flavescens . Herpetologica, 25(1), 373–395. [Google Scholar]
- Iverson, J. B. (2010). Reproduction in the red‐cheeked mud turtle (Kinosternon scorpioides cruentatum) in Southeastern Mexico and Belize, with comparisons across the species range. Chelonian Conservation and Biology, 9(2), 250–261. [Google Scholar]
- Iverson, J. B. , Barthelmess, E. L. , Smith, G. R. , & Derivera, C. E. (1991). Growth and reproduction in the mud turtle Kinosternon hirtipes in chihuahua, mexico. Journal of Herpetology, 25(1), 64–72. [Google Scholar]
- Jacobson, T. , & Kushlan, J. A. (1989). Growth dynamics in the American alligator (Alligator mississipiensis). Journal of Zoology, 219, 309–328. [Google Scholar]
- Ji, X. , Chen, F. , Du, W.‐G. , & Chen, H.‐L. (2003). Incubation temperature affects hatchling growth but not sexual phenotype in the Chinese soft‐shelled turtle, Pelodiscus sinensis (Trionychidae). Journal of Zoology, 261, 409–416. [Google Scholar]
- Jones, R. L. , & Hartfield, P. D. (1995). Population size and growth in the turtle Graptemys oculifera . Journal of Herpetology, 29(3), 426–436. [Google Scholar]
- Jones, T. T. (2009). Energetics of the leatherback turtle, Dermochelys coriacea . PhD thesis, Univ. Britisch columbia (Vancouver). [Google Scholar]
- Judd, F. W. , & McQueen, J. C. (1980). Incubation, hatching, and growth of the tortoise, Gopherus berlandieri . Journal of Herpetology, 14(4), 377–380. [Google Scholar]
- Jusup, M. , Sousa, T. , Domingos, T. , Labinac, V. , Marn, N. , Wang, Z. , & Klanjšek, T. (2017). The universality and the future prospects of physiological energetics: Reply to comments on Physics of metabolic organization . Physics of Life Reviews, 20, 78–84. [DOI] [PubMed] [Google Scholar]
- Kanwatakid‐Savini, P. , Pliosungnoen, M. , Pattanavibool, A. , Thorbjarnarson, J. B. , Limlikhitaksorn, C. , & Platt, S. G. (2012). A survey to determine the conservation status of Siamese crocodiles in Kaeng Krachan National Park, Thailand. Herpetological Conservation and Biology, 7(2), 157–168. [Google Scholar]
- Kearney, M. R. (2020). What is the status of metabolic theory one century after Pütter invented the von Bertalanffy growth curve. Biological Reviews, 356, 331–349. [DOI] [PubMed] [Google Scholar]
- Kearney, M. R. , McGeoch, M. , & Chown, S. (2019). Where do functional traits come from? the role of theory and models. Biodiversity Information Science and Standards, 3, e37500. conference abstract. [Google Scholar]
- Kearney, M. , & Porter, W. (2009). Mechanistic niche modelling: combining physiological and spatial data to predict species’ ranges. Ecology Letters, 12(4), 334–350. [DOI] [PubMed] [Google Scholar]
- Kearney, M. , Simpson, S. J. , Raubenheimer, D. , & Helmuth, B. (2010). Modelling the ecological niche from functional traits. Philosophical Transactions of the Royal Society B, 365, 3469–3483. [DOI] [PMC free article] [PubMed] [Google Scholar]
- Kennett, R. (1996). Growth models for two species of freshwater turtle, Chelodina rugosa and Elseya dentata from the wet‐dry tropics of Northern Australia. Herpetologica, 50(3), 383–395. [Google Scholar]
- Keswick, T. (2012). Ecology and morphology of the Kalahari tent tortoise, Psammobates oculifer, in a semi‐arid environment. PhD thesis, University of the Western Cape. [Google Scholar]
- Konarzewski, M. (1988). A model of growth in altricial birds based on changes in water content of the tissues. Ornis Scandinavica (Scandinavian Journal of Ornithology), 19(4), 290–296. [Google Scholar]
- Kooijman, S. A. L. M. (1986a). Energy budgets can explain body size relations. Journal of Theoretical Biology, 121, 269–282. [Google Scholar]
- Kooijman, S. A. L. M. (1986b). What the hen can tell about her egg; egg development on the basis of budgets. Journal of Mathematical Biology, 23, 163–185. [DOI] [PubMed] [Google Scholar]
- Kooijman, S. A. L. M. (2010). Dynamic Energy Budget theory for metabolic organisation. Cambridge University Press. [DOI] [PubMed] [Google Scholar]
- Kooijman, S. A. L. M. (2013). Waste to hurry: Dynamic Energy Budgets explain the need of wasting to fully exploit blooming resources. Oikos, 122, 348–357. [Google Scholar]
- Kooijman, S. A. L. M. (2020). The comparative energetics of petrels and penguins. Ecol. Mod, 427, 109052. [Google Scholar]
- Kooijman, S. A. L. M. , & Augustine, S. (2022a). The comparative energetics of the carnivorans and pangolins. Conservation Physiology. page subm. [DOI] [PMC free article] [PubMed] [Google Scholar]
- Kooijman, S. A. L. M. , & Augustine, S. (2022b). The comparative energetics of the cephalopods; they do not grow and reproduce fast. Journal of Sea Research, 184, 102205. 10.1016/j.seares.2022.102205 [DOI] [Google Scholar]
- Kooijman, S. A. L. M. , & Lika, K. (2014). Comparative energetics of the 5 fish classes on the basis of dynamic energy budgets. Journal of Sea Research, 94, 19–28. [Google Scholar]
- Kooijman, S. A. L. M. , Lika, K. , Augustine, S. , & Marn, N. (2021). Multidimensional scaling for animal traits in the context of dynamic energy budget theory. Conservation . Physiology, 9, coab086. [DOI] [PMC free article] [PubMed] [Google Scholar]
- Kooijman, S. A. L. M. , Lika, K. , Augustine, S. , Marn, N. , & Kooi, B. W. (2020). The energetic basis of population growth in animal kingdom. Ecol. Mod, 428, 109055. [Google Scholar]
- Kumar, R. S. , Harihar, A. , & Pandav, B. (2010). Population characteristics of a terrestrial geoemydid, Melanochelys tricarinata, from the Doon Valley, northern India. Herpetological Journal, 20, 139–146. [Google Scholar]
- Lee, L. , Montiel, E. E. , Navarro‐Domínguez, B. M. , & Valenzuela, N. (2019). Chromosomal rearrangements during turtle evolution altered the synteny of genes involved in vertebrate sex determination. Cytogenet Genome Research, 157(1–2), 77–88. [DOI] [PubMed] [Google Scholar]
- Legler, J. M. , & Vogt, R. C. (2013). Turtles of Mexico; land and freshwater forms. University of Calif Press. [Google Scholar]
- Leshem, A. , Ar, A. , & Ackerman, R. A. (1991). Growth, water, and energy metabolism of the soft‐shelled turtle (Trionyx triunguis) embryo: Effects of temperature. Physiological Zoology, 64(2), 568–594. [Google Scholar]
- Lika, K. , Augustine, S. , & Kooijman, S. A. L. M. (2019). Body size as emergent property of metabolism. Journal of Sea Research, 143, 8–17. [Google Scholar]
- Lika, K. , Augustine, S. , & Kooijman, S. A. L. M. (2022). The comparative energetics of the ray‐finned fish. Conservation Physiology. [DOI] [PMC free article] [PubMed] [Google Scholar]
- Lika, K. , Augustine, S. , Pecquerie, L. , & Kooijman, S. A. L. M. (2014). The bijection from data to parameter space with the standard DEB model quantifies the supply‐demand spectrum. Journal of Theoretical Biology, 354, 35–47. [DOI] [PubMed] [Google Scholar]
- Limpus, C. (1993). The green turtle, Chelonia mydas, in queensland: breeding males in the southern great barrier reef. Wildlife Research, 20(4), 513–523. [Google Scholar]
- Limpus, C. (2007). A biological review of Australian marine turtle species. 5. Flatback turtle, Natator depressus, (Garman). Technical report, Queensland Government Environmental Protection Agency. [Google Scholar]
- Limpus, C. (2008). Freshwater turtles in the Mary River: Review of biological data for turtles in the Mary River, with emphasis on Elusor macrurus and Elseya albagula . Technical report, Queensland Government. [Google Scholar]
- Limpus, C. , & Fien, L. (2009). A biological review of Australian marine turtles. Environmental Protection Agency. [Google Scholar]
- Limpus, C. J. , Limpus, D. J. , Arthur, K. , & Parmenter, J. C. (2005). Monitoring green turtle population dynamics in shoalwater bay: 2000–2004. Technical Report 83, Queensland Environmenal Protection Agency. [Google Scholar]
- Limpus, C. , & Nicholls, N. (1988). The southern oscillation regulates the annual numbers of green turtles (Chelonia mydas) breeding around northern Australia. Wildlife Research, 15(2), 157–161. [Google Scholar]
- Lindeman, P. V. (1999). Growth curves for Graptemys, with a comparison to other emydid turtles. American Midland Naturalist, 142, 141–151. [Google Scholar]
- Lindeman, P. V. (2005). Aspects of the life history of the texas map turtle (Graptemys versa). American Midland Naturalist, 153, 378–388. [Google Scholar]
- Lindeman, P. V. (2007). Diet, growth, body size, and reproductive potential of the Texas river cooter (Pseudemys texana) in the south Llano River, Texas. The Southwestern Naturalist, 52(4), 586–594. [Google Scholar]
- Loehr, V. J. (2004). Growth of the Namaqualand speckled padloper, Homopus signatus signatus (Reptilia: Testudinidae). African Zoology, 39(2), 309–313. [Google Scholar]
- Lovich, J. E. , Ernst, C. H. , Zappalort, R. T. , & Harman, D. W. (1998). Geographic variation in growth and sexual size dimorphism of bog turtles (Clemmys muhlenbergii). American Midland Naturalist, 139, 69–78. [Google Scholar]
- Magalhāes, M. S. , Vogt, R. C. , Sebben, A. , Dias, L. C. , de Oliveira, M. F. , & de Moura, C. E. B. (2017). Embryonic development of the giant South American river turtle, Podocnemis expansa (Testudines: Podocnemididae). Zoomorphology, 136, 523–537. [DOI] [PubMed] [Google Scholar]
- Magnusson, W. E. , de Lima, A. C. , de Costa, V. L. , & de Lima, O. P. (1997). Growth of the turtle, Phrynops rufipes in central Amazônia, Brazil. Chelonian Conservation and Biology, 2(4), 78–87. [Google Scholar]
- Marchand, K. A. , Hughes, G. N. , & Litzgus, J. D. (2018). Geographic variation in somatic growth rate of wood turtles (Glyptemys insculpta). Copeia, 106(3), 477–484. [Google Scholar]
- Margaritoulis, D. , Argano, R. , Baran, I. , Bentivegna, F. , Bradai, M. , Caminas, J. , Casale, P. , Metrio, G. D. , Demetropoulos, A. , Gerosa, G. , Godley, B. , Haddoud, D. , Houghton, J. , Laurent, L. , & Lazar, B. (2003). Loggerhead turtles in the Mediterranean sea: Present knowledge and conservation perspectives. In Bolten A., & Witherington B. (Eds.), Loggerhead sea turtles (pp. 175–198). Smithsonian Books. [Google Scholar]
- Markham, J. , & Kirkwood, J. K. (1988). Rearing the olve ridley Lepidochelys olivacea hand‐reared at the London zoo. International Zoo Yearbook, 27, 316–319. [Google Scholar]
- Marn, N. , Jusup, M. , Cateau, S. , Kooijman, S. , & Klanjsček, T. (2019). Comparative physiological energetics of Mediterranean and North Atlantic loggerhead turtles. Journal of Sea Research, 143, 100–108. 10.1016/j.seares.2018.06.010 [DOI] [Google Scholar]
- Marn, N. , Jusup, M. , Kooijman, S. A. L. M. , & Klanšek, T. (2020). Quantifying the impact of plastic debris on marine wildlife identifies ecological breakpoints. Ecology Letters, 23, 1479–1487. 10.1111/ele.13574 [DOI] [PubMed] [Google Scholar]
- Marques, G. M. , Augustine, S. , Lika, K. , Pecquerie, L. , Domingos, T. , & Kooijman, S. (2018). The AmP project: Comparing species on the basis of Dynamic Energy Budget parameters. PLOS Computational Biology, 14(5), e1006100. [DOI] [PMC free article] [PubMed] [Google Scholar]
- Marques, G. M. , Lika, K. , Augustine, S. , Pecquerie, L. , & Kooijman, S. A. L. M. (2019). Fitting multiple models to multiple data sets. Journal of Sea Research, 143, 48–56. [Google Scholar]
- Martins, F. I. , & Souza, F. L. (2008). Estimates of growth of the Atlantic rain forest freshwater turtle Hydromedusa maximiliani (Chelidae). Journal of Herpetology, 42(1), 54–60. [Google Scholar]
- Marzola, M. , Russo, J. , & Mateus, O. (2014). Identification and comparison of modern and fossil crocodilian eggs and eggshell structures. Historical Biology. 10.1080/08912963.2013.871009 [DOI] [Google Scholar]
- Masin, S. , Ficetola, G. F. , & Bottoni, L. (2015). Head starting european pond turtle (Emys orbicularis) for reintroduction: Patterns of growth rates. Herpetological Conservation and Biology, 10(Symposium), 516–524. [Google Scholar]
- Medica, P. A. , Nussear, K. E. , Esque, T. C. , & Saethre, M. B. (2012). Long‐term growth of desert tortoises (Gopherus agassizii) in a southern Nevada population. Journal of Herpetology, 46(2), 213–220. [Google Scholar]
- Meers, M. B. , Robinson, K. L. , Smith, D. , Scordino, A. , & Fisher, L. (2016). Effect of diet on growth in captive Podocnemis unifilis: assessing optimal diets for turtles in head‐starting programs. Bullitin Florida Museum Natural History, 54(4), 58–68. [Google Scholar]
- Melancon, S. R. , Angus, R. A. , & Marion, K. R. (2011). Growth of the flattened musk turtle, Sternotherus depressus Tinkle and Webb. Southeastern Naturalist, 10(3), 399–408. [Google Scholar]
- Miller, J. D. , Limpus, C. L. , & Godfrey, M. H. (2003). Nest site selection, oviposition, eggs, development, hatching, and emergence of loggerhead sea turtles. In Bolten A., & Witherington B. (Eds.), Ecology and conservation of loggerhead sea turtles (pp. 125–143). University Press of Florida. [Google Scholar]
- Miorando, P. S. , Giarrizzo, T. , & Pezzuti, J. C. B. (2015). Population structure and allometry of Podocnemis unifilis (Testudines, Podocnemididae) in a protected area upstream Belo Monte dam in Xingu River, Brazil. Anais Da Academia Brasileira De Ciências, 87(4), 2067–2079. [DOI] [PubMed] [Google Scholar]
- Miranda, M. P. , de Moraes, G. V. , Martins, E. N. , Maia, L. C. P. , & Barbosa, O. R. (2002). Thermic variation in incubation and development of Pantanal caiman (Caiman crocodilus yacare) (Daudin, 1802) kept in metabolic box. Brazilian Archives of Biology and Technology, 45, 333–342. 10.1590/S1516--89132002000300012 [DOI] [Google Scholar]
- Moll, E. O. , Platt, S. G. , Chan, E. H. , Horne, B. D. , Platt, K. , Praschag, P. , Chen, P. N. , & van Dijk, P. P. (2015). Batagur affinis (Cantor 1847) – Southern River Terrapin, Tuntong. Technical report, Chelonian Research Foundation. [Google Scholar]
- Moreira, L. , Baptistotte, C. , Scalfone, J. , Thom, J. , & de Almeida, A. (1995). Occurrence of Chelonia mydas on the island of trindade, brazil. Marine Turtle Newsletter, 70(2), 2–5. [Google Scholar]
- Mourao, Z. C. G. , Coutinho, M. , & Magnusson, W. E. (2014). Growth of Caiman crocodilus yacare in the Brazilian pantanal. PLoS One, 9(2), e89363. [DOI] [PMC free article] [PubMed] [Google Scholar]
- Mrosovsky, N. (1980). Thermal biology of sea turtles. American Zoologist, 20, 531–547. [Google Scholar]
- Munscher, E. C. , Walde, A. D. , Stratmann, T. , & Butterfield, B. P. (2015). Exceptional growth rates observed in immature Pseudemys from a protected spring system in Florida. Herpetology Notes, 8, 133–140. [Google Scholar]
- Mushinsky, J. H. R. , Wilson, D. S. , & McCoy, E. D. (1994). Growth and sexual dimorphism of gopherus polyphemus in central Florida. Herpetologica, 50(2), 119–128. [Google Scholar]
- Nelms, S. E. , Duncan, E. M. , Broderick, A. C. , Galloway, T. S. , Godfrey, M. H. , Hamann, M. , Lindeque, P. K. , & Godley, B. J. (2016). Plastic and marine turtles: a review and call for research. ICES Journal of Marine Science, 73(2), 165–181. [Google Scholar]
- Ngwanya, A. , Patzke, N. , Sprocter, M. A. , Kruger, J.‐L. , Dell, L.‐A. , Chawana, R. , Mazengenya, P. , Billings, B. K. , Olaleye, O. , Herculano‐Houzel, S. , & Manger, P. R. (2013). The continuously growing central nervous system of the Nile crocodile (Crocodylus niloticus). The Anatomical Record, 296, 1489–1500. [DOI] [PubMed] [Google Scholar]
- Norton, T. M. (2005). Sea turtle conservation in Georgia and an overview of the Georgia sea turtle center on Jekyll island, Georgia. Georgia Journal of Science, 63, 287–289. [Google Scholar]
- Novelli, I. A. , & de Sousa, B. M. (2008). Hydromedusa maximiliani (Brazilian snake‐necked turtle). Hatchling size and body mass. Herpetological Review, 39(3), 344–345. [Google Scholar]
- Nussear, K. E. , Esque, T. C. , Haines, D. F. , & Tracey, C. R. (2007). Desert tortoise hibernation: Temperatures, timing, and environment. Copeia, 2007(2), 378–386. [Google Scholar]
- Páaez, V. P. , Bock, B. C. , Espinal‐Garcí, P. A. , Rendón‐Valencia, B. H. , Alzate‐Estrada, D. , Cartagena‐Otálvaro, V. M. , & Heppel, S. S. (2015). Life history and demographic characteristics of the Magdalena river turtle (Podocnemis lewyana): Implications for management. Copeia, 103, 1058–1074. [Google Scholar]
- Páez, V. P. , Correa, J. C. , Cano, A. M. , & Bock, B. C. (2009). A comparison of maternal and temperature effects on sex, size, and growth of hatchlings of the Magdalena river turtle (Podocnemis lewyana) incubated under field and controlled laboratory conditions. Copeia, 2009, 698–704. [Google Scholar]
- Parker, G. H. (1926). The growth of turtles. Proceedings of the National Academy of Sciences, 12(7), 422–424. [DOI] [PMC free article] [PubMed] [Google Scholar]
- Parker, G. H. (1929). The growth of the loggerhead turtle. The American Naturalist, 63(687), 367–373. [Google Scholar]
- Pen, I. , Uller, T. , Feldmeyer, B. , Harts, A. , While, G. M. , & Wapstra, E. (2010). Climate‐driven population divergence in sex‐determining systems. Nature, 468, 436–438. [DOI] [PubMed] [Google Scholar]
- Pereia, C. , Booth, D. , & Limpus, C. (2011). Locomotor activity during the frenzy swim: analysig early swimming behaviour in hatchling sea turtles. Journal of Experimental Biology, 214(23), 3972–3976. [DOI] [PubMed] [Google Scholar]
- Pérez‐Higareda, G. , Rangel‐Rangel, A. , Chiszar, G. , & Smith, H. M. (1995). Growth of Morelet's crocodile (Crocodylus moreletii) during the first three years of life. Zoo Biology, 14, 173–177. [Google Scholar]
- Peters, R. H. (1983). The ecological implications of body size. Cambridge Univ. Press. [Google Scholar]
- Piovano, S. , Clusa, M. , Carreras, C. , Giacoma, C. , Pascual, M. , & Cardona, L. (2011). Different growth rates between loggerhead sea turtles (Caretta caretta) of Mediterranean and Atlantic origin in the Mediterranean sea. Marine Biology, 158(11), 2577–2587. [Google Scholar]
- Plummer, M. V. (1977). Reproduction and growth in the turtle Trionyx muticus . Copeia, 1977(3), 440–447. [Google Scholar]
- Plummer, M. V. , & Mills, N. E. (2015). Growth and maturity of spiny softshell turtles (Apalone spinifera) in a small urban stream. Herpetological Conservation and Biology, 10(2), 688–694. [Google Scholar]
- Prince, R. (2017). Personal communication.
- Prithard, P. C. H. (2008). Chelus frimbriata (Schneider 1783) – matamata turtle. In Rhodin A. G. J., Pritchard P. C. H., van Dijk P. P., Saumure R. A., Buhlmann K. A., & Iverson J. B. (Eds.), Conservation Biology of Freshwater Turtles and Tortoises: A Compliation Project of the IUCN/SSC Tortoise and Freshwater Turtle Specialist Group, Vol. 5. Chelonian Research Foundation and Turtle Conservation; Chelonian Research Monographs. [Google Scholar]
- Reich, K. J. , Bjorndal, K. A. , & del Rio, C. M. (2008). Effects of growth and tissue type on the kinetics of 13C and 15N incorporation in a rapidly growing ectotherm. Oecologia, 155, 651–663. [DOI] [PubMed] [Google Scholar]
- Reid, K. A. , Margaritoulis, D. , & Speakman, J. R. (2009). Incubation temperature and energy expenditure during development in loggerhead sea turtle embryos. Journal of Experimental Marine Biology and Ecology, 378, 62–68. [Google Scholar]
- Rhodin, A. G. J. , Stanford, C. B. , Van Dijk, P. P. , Eisemberg, C. , Luisell, L. , Mittermeier, R. A. , Hudson, R. , Horne, B. D. , Goode, E. V. , Kuchling, G. , Wald, A. , Baard, E. H. W. , Berry, K. H. , Bertolero, A. , Blanck, T. E. G. , Bour, R. , Buhlmann, K. A. , Cayot, L. J. , Collett, S. , … Vogt, R. C . (2018). Global conservation status of turtles and tortoises (order testudines). Chelonian Conservation and Biology, 17(2), 135–161. [Google Scholar]
- Ritz, J. , Clauss, M. , Streich, W. J. , & Hatt, J.‐M. (2012). Variation in growth and potentially associated health status in Hermann's and spur‐thighed tortoise (Testudo hermanni and Testudo graeca). Zoo Biology, 31, 705–717. [DOI] [PubMed] [Google Scholar]
- Ritz, J. , Griebeler, E. M. , Huber, R. , & Clauss, M. (2010). Body size development of captive and free‐ranging African spurred tortoises (Geochelone sulcata): high plasticity in reptilian growth rates. Herpetological Journal, 20, 213–216. [Google Scholar]
- Ritz, J. , Hammer, C. , & Clauss, M. (2010). Body size development of captive and free‐ranging leopard tortoises (Geochelone pardalis). Zoo Biology, 29, 517–525. [DOI] [PubMed] [Google Scholar]
- Roosenburg, W. M. , & Kelley, K. C. (1996). The effect of egg size and incubation temperature on growth in the turtle, Malaclemys terrapin . Journal of Herpetology, 30(2), 198–204. [Google Scholar]
- Rowe, J. W. (1994). Reproductive variation and the egg size‐clutch size trade‐off within and among populations of painted turtles (Chrysemys picta bellii). Oecologia, 99, 35–44. [DOI] [PubMed] [Google Scholar]
- Rusli, M. , Booth, D. , & Joseph, J. (2016). Synchronous activity lowers the energetic cost of nest escapt for sea turtle hatchlings. Journal of Experimental Biology, 219(10), 1505–1513. [DOI] [PubMed] [Google Scholar]
- Salmon, M. (2017). Turtles reared from hatching at AQWA, Perth by Mike Salmon and Jeanette Wyneken. Unpublished data.
- Salmon, M. , Hamann, M. , Wyneken, J. , & Schauble, C. (2009). Early swimming activity by hatchling flatback sea turtles Natator depressus: a test of the "predation risk" hypothesis. Endangered Species Research, 9, 41–47. [Google Scholar]
- Schuyler, Q. , Hardesty, B. D. , Wilcox, C. , & Townsend, K. (2014). Global analysis of anthropogenic debris ingestion by sea turtles. Conservation Biology, 28, 129–139. [DOI] [PMC free article] [PubMed] [Google Scholar]
- Schwarzkopf, L. , Caley, M. J. , & Kearney, M. R. (2016). One lump or two? Explaining a major latitudinal transition in reproductive allocation in a viviparous lizard. Functional Ecology, 30, 1373–1383. [Google Scholar]
- Scott, R. , Marsh, R. , & Hays, G. C. (2012). Life in the really slow lane: loggerhead sea turtles mature late relative to other reptiles. Functional Ecology, 26(1), 227–235. [Google Scholar]
- Seijas, Y. , Andrés, E. (2016). Regional differences in growth rates of Orinoco crocodiles (Crocodylus intermedius) from the Venezuelan Llanos. Herpetological Journal, 26, 263–269. [Google Scholar]
- Seymour, R. S. , Bennett‐Stamper, C. L. , Johnston, S. D. , Carrier, D. R. , & Grigg, G. C. (2004). Evidence for endothermic ancestors of crocodiles at the stem of archosaur evolution. Physiological and Biochemical Zoology, 77(6), 1051–1067. [DOI] [PubMed] [Google Scholar]
- Seymour, R. S. , & Bradford, D. F. (1995). Respiration of amphibian eggs. Physiological Zoology, 68(1), 1–25. [Google Scholar]
- Shine, R. (2013). Reptiles. Current Biology, 23(8), R227–R231. [DOI] [PubMed] [Google Scholar]
- Skorczewski, T. , & Andersen, B. (2021). A dynamic energy budget model of ornate box turtle shell growth. Spora, 7(2), 8–16. [Google Scholar]
- Smith, L. L. , Pedrono, M. , Dorazio, R. M. , & Bishko, J. (2001). Morphometrics, sexual dimorphism, and growth in the Angonoka tortoise (Geochelone yniphora) of western Madagascar. African Journal of Herpetology, 50(1), 9–18. [Google Scholar]
- Snover, M. L. , Avens, L. , & Hohn, A. A. (2007). Back‐calculating length from skeletal growth marks in loggerhead sea turtles Caretta caretta . Endangered Species Research, 3, 95–104. [Google Scholar]
- Spencer, R.‐J. (2002). Growth patterns in two widely distributed freshwater turtles and a comparison of methods used to estimate age. Australian Journal of Zoology, 50, 477–490. [Google Scholar]
- Spotila, J. R. (2004). Sea Turtles: A Complete Guide to their Biology, Behavior, and Conservation. The Johns Hopkins University Press and Oakwood Arts. [Google Scholar]
- Standora, E. A. (1982). Regional endothermy in the sea turtle, Chelonia mydas . Journal of Thermal Biology, 7, 159–165. [Google Scholar]
- Staples, J. F. (2016). Metabolic flexibility: Hibernation, torpor, and estivation. Comprehensive Physiology, 6, 737–771. [DOI] [PubMed] [Google Scholar]
- Stokes, L. (2014). Personal communication.
- Stokes, L. , Wyneken, J. , Crowder, L. B. , & Marsh, J. (2006). The influence of temporal and spatial origin on size and early growth rates in captive loggerhead sea turtles (Caretta caretta) in the United States. Herpetological Conservation and Biology, 1, 71–80. [Google Scholar]
- Stoneburner, D. L. (1980). Body depth: An indicator of morphological variation among nesting groups of adult loggerhead sea turtles (Caretta caretta). Journal of Herpetology, 14(2), 205–206. [Google Scholar]
- Strydom, A. V. (2001). Seasonal reproduction and sexual size dimorphism of the African Helmeted Turtle, Pelomedusa subrufa (Family Pelomedusidae). PhD thesis, University of Stellenbosch. [Google Scholar]
- Stubbs, J. L. , Mitchell, N. J. , Marn, N. , Vanderklift, M. A. , Pillans, R. D. , & Augustine, S. (2017). A full life cycle Dynamic Energy Budget (DEB) model for the green sea turtle (Chelonia mydas) fitted to data on embryonic development. Journal of Sea Research, 143, 78–88. [Google Scholar]
- Stubbs, J. L. , Mitchell, N. J. , Marn, N. , Vanderklift, M. A. , Pillans, R. D. , & Augustine, S. (2019). A full life cycle dynamic energy budget (DEB) model for the green sea turtle (Chelonia mydas) fitted to data on embryonic development. Journal of Sea Research, 143, 78–88. [Google Scholar]
- Sung, Y.‐H. , Hau, B. C. H. , & Karraker, N. E. (2014). Reproduction of endangered big‐headed turtle, Platysternon megacephalum (Reptilia: Testudines: Platysternidae. Acta Herpetologica, 9(2), 243–247. [Google Scholar]
- Sung, Y.‐H. , Hau, B. C. H. , Lau, M. W. N. , Crow, P. A. , Kendrick, R. C. , Buhlmann, K. A. , Ades, G. W. J. , & Karraker, N. E. (2015). Growth rate and an evaluation of age estimation for the endangered big‐headed turtle (Platysternon megacephalum) in China. Journal of Herpetology, 49(1), 99–103. [Google Scholar]
- Targarona, R. R. , Soberón, R. R. , Tabet, M. A. , & Thorbjarnarson, J. B. (2010). Cuban crocodile Crocodylus rhombifer . In Manolis S., & Stevenson C. (Eds.), Crocodiles. Status survey and conservation action plan, pp. 114–119. Crocodile Specialist Group. [Google Scholar]
- Tazawa, H. , Visschedijk, A. H. J. , & Piiper, J. (1983). Blood gas and acid‐base status in chicken embryos with naturally varying egg shell conductance. Respiration Physiology, 54, 137–144. [DOI] [PubMed] [Google Scholar]
- Tiwari, M. , & Bjorndal, K. A. (2000). Variation in morphology and reproduction in loggerheads, Caretta caretta, nesting in the United States, Brazil, and Greece. Herpetologica, 56(3), 343–356. [Google Scholar]
- Troeng, S. , & Chaloupka, M. (2007). Variation in adult annual survival probability and remigration intervals of sea turtles. Marine Biology, 151(5), 1721–1730. [Google Scholar]
- Tucker, A. D. (2010). Nest site fidelity and clutch frequency of loggerhead turtles are better elucidated by satellite telemetry than by nocturnal tagging efforts: Implications for stock estimation. Journal of Experimental Marine Biology and Ecology, 383, 48–55. [Google Scholar]
- Valenzuela, N. , & Adams, D. C. (2011). Chromosome number and sex determination coevolve in turtles. Evolution, 65(6), 1808–1813. [DOI] [PubMed] [Google Scholar]
- Van Houtan, K. , Hargrove, S. , & Balazs, G. (2014). Modelling sea turtle maturity age from partial life history records. Pacific Science, 68(4), 465–477. [Google Scholar]
- Venkatesan, S. , Kannan, P. , Rajagopalan, M. , & Vivekanandan, E. (2005). Embryonic energetics in the egg of the green turtle Chelonia mydas . Journal of the Marine Biological Association of India, 47(2), 193–197. [Google Scholar]
- Viotto, E. V. , Navarro, J. L. , & Piña, C. I. (2020). Growth curves of wild and reintroduced broad‐snouted caimans (Caiman latirostris) and their management implications. South American Journal of Herpetology, 16, 34–41. [Google Scholar]
- Visschedijk, A. H. J. (1968). The air space and embryonic respiration. British Poultry Science, 9, 173–210. [DOI] [PubMed] [Google Scholar]
- Visschedijk, A. H. J. , & Rahn, H. (1983). Replacement of diffusive by convective gas transport in the developing hen's egg. Respiration Physiology, 52, 137–147. [DOI] [PubMed] [Google Scholar]
- Vyas, R. (1979). Notes on growth and maturity in the Indian roofed turtle (Kachuga tecta). Bombay Natural Hist, Society, 94, 160–162. [Google Scholar]
- Vyas, R. (1997). Notes on the growth and maturity of the Indian star tortoise (Geochelone elegans). Zoo's Print, 12(1), 6–7. [Google Scholar]
- Wabnitz, C. , & Pauly, D. (2008). Length‐weight relationships and additional growth parameters for sea turtles. In Palomares M. L. D., & Pauly D. (Eds.), Von Bertalanffy growth parameters of non‐fish marine organisms, volume 16 of 10 (pp. 138). Fisheries Centre Research Report. [Google Scholar]
- Webb, G. J. W. , Choqeunot, D. , & Whitehead, P. J. (1986). Nests, eggs, and embryonic development of Carettochelys insculpta (Chelonia: Carettochelidae) from Northern Australia. Journal of Zoology, 1, 521–550. [Google Scholar]
- Webb, R. G. (1961). Observations on the life histories of turtles (genus Pseudemys and Graptemys) in Lake Texoma, Oklahoma. The American Midland Naturalist, 65(1), 193–214. [Google Scholar]
- Weissenbacher, A. , Preininger, D. , Ghosh, R. , Morshed, A. G. J. , & Praschag, P. (2015). Conservation breeding of the Northern river terrapin Batagur baska at the Vienna Zoo, Austria, and in Bangladesh. International Zoo Yearbook, 49, 31–41. [Google Scholar]
- Whitehead, P. J. (1987). Respiration of Crocodylus johnstoni embryos. In Webb G. J. W., Manolis S. C., & Whitehead P. J. (Eds.), Crocodiles and alligators (pp. 473–497). Beatty. [Google Scholar]
- Whitehead, P. J. , Webb, G. J. W. , & Seymour, R. S. (1990). Effect of incubation temperature on development of Crocodylus johnstoni embryos. Physiological Zoology, 63, 949–964. [Google Scholar]
- Whiting, S. D. , & Whiting, A. U. (2011). Predation by the saltwater crocodile (Crocodylus porosus) on sea turtle adults, eggs, and hatchlings. Chelonian Conservation and Biology, 10(2), 198–205. [Google Scholar]
- Wilbur, H. M. (1975). A growth model for the turtle Chrysemys picta . Copeia, 1975(2), 78–87. [Google Scholar]
- Williamson, L. U. , Spotila, J. R. , & Standora, E. A. (1989). Growth, selected temperature and CTM of young snapping turtles, Chelydra serpentina . Journal of Thermal Biology, 14(1), 33–39. [Google Scholar]
- Wine, C. (2016). Sea turtle energectis. Hohonu, 14, 82–88. [Google Scholar]
- Withers, P. C. (1992). Comparative animal physiology. Saunders College Publishing. [Google Scholar]
- Witzell, W. N. (1980). Growth of captive hawsbill turtles, Eretmochelys imbricata, in western Samoa. Bulletin of Marine Science, 30(4), 909–912. [Google Scholar]
- Wood, K. A. , Stillman, R. A. , & Hilton, G. M. (2018). Conservation in a changing world needs predictive models. Animal Conservation, 21(2), 87–88. [Google Scholar]
- Yabe, T. (1989). Population structure and growth of the Japanese pond turtle, Mauremys japonica . Japanese Journal of Herpetology, 13(1), 7–9. [Google Scholar]
- Yntema, C. L. (1978). Incubation times for eggs of the turtle Chelydra serpentina (Testudines: Chelydridae) at various temperatures. Herpetologica, 34(3), 274–277. [Google Scholar]
- Zbinden, J. A. , Margaritoulis, D. , & Arlettaz, R. (2006). Metabolic heating in Mediterranean loggerhead sea turtle clutches. Journal of Experimental Marine Biology and Ecology, 334, 151–157. [Google Scholar]
- Zonneveld, C. , & Kooijman, S. A. L. M. (1993). Comparative kinetics of embryo development. Bulletin of Mathematical Biology, 3, 609–635. [DOI] [PubMed] [Google Scholar]
- Zug, G. R. , Wynn, A. H. , & Ruckdeschel, C. (1986). Age determination of loggerhead sea turtles, Caretta caretta, by incremental growth marks in the skeleton. Smithsonian Contribution to Zoology, 427, 1–34. 10.5479/si.00810282.427 [DOI] [Google Scholar]
- Zurita, J. , Herrera, R. , Arenas, A. , Negrete, A. , Gomez, L. , Prezas, B. , & Sasso, C. (2012). Age at first nesting of green turtles in the mexican caribbean. In Proceedings of the thirty‐first annual symposium on sea turtle biology and conservation (pp. 75). National Oceanic and Atmospheric Administration Fisheries Service, Southeast Fisheries Science Centre. [Google Scholar]
Associated Data
This section collects any data citations, data availability statements, or supplementary materials included in this article.
Data Availability Statement
The underlying data come from published literature. The data and the references to where it comes from can be found on the Add‐my‐Pet website https://www.bio.vu.nl/thb/deb/deblab/add_my_pet as well as on its mirror at https://debtheory.fr/add_my_pet/. There you can also find the code that has been used to estimate parameter values for each species. This code uses the software packages AmPtool AmP, 2021 and DEBtool DEBtool, 2021, which are freely available via Github: https://github.com/orgs/add‐my‐pet/repositories. A selection of references to data for each species is also given in the Appendix.