

Abstract
The Coronavirus Disease (COVID-19) caused by SARS-CoV-2, continues to be a global threat. The major global concern among scientists and researchers is to develop innovative digital solutions for prediction and control of infection and to discover drugs for its cure. In this paper we developed a strategic technical solution for surveillance and control of COVID-19 in Delhi-National Capital Region (NCR). This work aims to elucidate the Delhi COVID-19 Data Management Framework, the backend mechanism of integrated Command and Control Center (iCCC) with plugged-in modules for various administrative, medical and field operations. Based on the time-series data extracted from iCCC repository, the forecasting of COVID-19 spread has been carried out for Delhi using the Auto-Regressive Integrated Moving Average (ARIMA) model as it can effectively predict the logistics requirements, active cases, positive patients, and death rate. The intelligence generated through this research has paved the way for the Government of National Capital Territory Delhi to strategize COVID-19 related policies formulation and implementation on real time basis. The outcome of this innovative work has led to the drastic reduction in COVID-19 positive cases and deaths in Delhi-NCR.
Keywords: COVID-19 pandemic, SARS-CoV-2, ARIMA, Forecasting, Data analytics
Introduction
In response to COVID-19, the countries worldwide, including India, have adopted effective measures to combat the infection via containing the spread and treating the infection as best as possible. Finding and improvising better detection techniques and treatments against infection is an ongoing area of research. For monitoring patients and the quarantined citizens, the COVID Patient and Facility Management Information System1 was conceptualized to manage quarantined citizens including covid positive symptoms detection, hospital admission, recovery and deaths. The COVID Patient and Facility Management Information System supports end-to-end pandemic-oriented facilities in districts. District Supply Offices (DSOs), Chief District Medical Offices (CDMOs), State Health Authorities, Delhi Disaster Management Authority (DDMA), revenue department have been the key users of the said solution. The major features of the technical solution include the provision to upload the data in Indian Council of Medical Research (ICMR) line list, district wise segregation of the line list, facilitate CDMOs to provide the Home Isolation to the patients etc. Moreover, hospitals can admit the patient from the line list and can update the daily clinical status of the patient. Hospitals can also avail, refer or discharge provisions, entry provision if a patient expires, shifting of the patient from one center to another, infrastructure details entry by the hospitals, and integration of the data received from the home isolation agency.
The comprehensive Management Information System (MIS) provides effective monitoring of facilities and patients across Delhi. Around 20,000+ dedicated COVID-19 beds and 2500+ ICU beds are available in various facilities. Multiple stakeholders i.e., DDMA, Revenue, and Health, Hospitals, DSOs, etc. were previously managing data in their own local system [1]. This was non-calibrated data. In this work the COVID-19 Data Management portal was developed for managing this multi-source originated data. The portal consolidates the data to generate various statistical and graphical reports for better analysis and monitoring. It also has provision to generate daily reports that contain information related to RT-PCR and Rapid Antigen test, containment zone information across Delhi, Centralised Accident and Trauma Services (CATS),2 and ambulance data, etc. Moreover, a module has been developed to generate Delhi State Health Bulletin by extracting real-time data from various other modules integrated with Delhi COVID-19 Management Portal. The Delhi State Health Bulletin3 is closely monitored by the Chief Secretary who is also chairman of State Disaster Management Authority and other senior officials involved in decision making. The Health Bulletin contains important COVID-19 related information like the number of positive cases, active, and recovered cases, number of deaths, tests done, reports received, and statistics of beds at various types of facilities designated for COVID-19 like hospital, covid care centers (CCC), community health center (CHC), etc.
A Home Isolation module is developed to monitor the status of the patients recommended by the concerned DSO for the home isolation. There is also a provision to shift the patient to CCC/CHC or Hospital as per the requirements. A comprehensive MIS is provided to monitor the daily status of the patients. At some stage 80,000+ COVID-19 positive persons were under home isolation.4
To supplement the future planning and better decision making regarding COVID19 pandemic a predictive analytics model viz, Auto-Regressive Integrated Moving Average (ARIMA) model is used for data analytics of data generated by the different modules which is discussed in Sect. 5.
The Sect. 2 of this paper covers the literature survey and state-of-the-art comparative studies of research methods associated to previous research models developed or implemented for COVID-19 pandemic study. The Sect. 3 describes the Artificial Intelligence (AI) and data analytics approaches used for the pandemic management and control The Sect. 4 comprehensively describes the Delhi COVID-19 Data Management Framework followed by Visual Analytics, and Dashboards and ARIMA model-based prediction and results for modelling in Sect. 5. Lastly, the conclusion describes the effectiveness of the research performed in COVID-19 mitigation and control.
Literature survey
The data analytics is extensively used in epidemiology research that involves techniques for uncovering relationships, patterns, trends, and other meaningful information from data. Researchers have used many data analytics and AI techniques to detect and predict COVID-19 cases and estimate the progression of the disease to take effective preventive and control measures. Descriptive, predictive, and perspective approaches of data analytics are being used to serve decision making, take the appropriate response, and combat the challenges associated with the pandemic. This section presents various state-of-the-art AI and ML-based predictive models and approaches for the logistics requirements, active cases, positive patients, death rate, etc. regarding pandemic outbreaks including COVID-19.
It has been observed that the prediction models based on AI, ML, cloud computing, and improved susceptible infected (ISI) have outperformed the traditional models and produced more accurate prediction of the pandemic advancement [2–5]. Mariappan et al. [6] applied an AI and ML-based prediction approach to predict the shipment times of resources such as diagnostics, therapeutics, drug, vaccines etc. amid COVID-19. They developed multiclass classification models RF, DT, multilayer perceptron (MLP), extra trees (XRT), XGBoost (XGB), linear stochastic gradient descent (SGD), CatBoost (CB) and Naïve Bayes with ten-fold cross validation and trained over triplet dataset of source, destination, shipper. The result interpreted that the turn-around-time taken by the therapeutic supply logistics providers has accuracy of 62.91% as compared to real time taken. Moreover, within a week, the accuracy improved to 93.5% than previous with 48.62% improvisation, displaying the improved performance trend each week. Ye et al. [7] proposed an information technology-based framework for effectively managing the COVID-19 pandemic in China that consisting Health IT partners including different stakeholders, service recipient, and emerging technologies for control and prevention of the pandemic and the application scenario including online service, screening, case detection, intelligent diagnosis, and risk assessment. Majhi et al. [8] developed a predictive model that can successfully predict the number of COVID positive cases with a higher accuracy. The patient data from China was used to train the DT and RF based models and validated over sample dataset from Indian population. The successful prediction with minimal error was achieved. Devraj et al. [9] developed an ML-based forecasting model using the time series data to analyze the COVID-19 progression trend and use predictive analytics for better healthcare operations with model prediction error to be 0.039 over fresh COVID cases and 0.006 for active ones with respect to mean absolute percentage error. Sinha and Rathi [10] analyzed the demographical factors influencing the pandemic spread. The cluster analysis of age factor concluded increase in mortality rate with the age with maximum ranging between 60 and 80 years. Further the survival rate was predicted with AI-based statistical approach over Korean population dataset. The hyperparameters tuning and deep learning models along with an autoencoder-based approach was applied to estimate the feature influence over pandemic spread. Hassan et al. [11] leverages beyond 5G (B5G) networks communication architecture and fusion of heterogeneous set of AI models aiming in COVID-19 outbreak prediction. They proposed distributed architecture for training AI enabled edge devices resulting in AI edge-trained models traversing towards the central cloud system. These in turn combines all the results globally (presently from United States, India, Italy, Bangladesh, and Saudi Arabia) and making a final reliable prediction model. Khanday et al. [12] presented a machine learning model for detecting and diagnosis COVID-19 patients using clinical data. The text had been classified into four major categories like COVID-19, acute respiratory distress syndrome (ARDS), SARS, and both using eight different machine learning algorithms. Among all the classifications algorithms, the multinomial Naive Bayes and logistic regression provide the best accuracy of 96.2% with a 91% f1 Score. Likewise, El-Din et al. [13] proposed an AI) driven Internet of Things (IoT) technique for the smart health system based on hybrid fusion (consisting of decision fusion and feature fusion) for determining irregularities by monitoring blood pressure, heart rate, pulse, temperature, and respiratory rate of patients that helped for enhanced decision making. Wynants et al. [14] observed that the predictive models were optimistic, however, most of them were poorly reported, and explained an immediate requirement of COVID-19 patient data for developing a well-defined and more rigorous prediction model. Whitelaw et al. [15] discussed the applications of digital technology in the response and planning of the COVID-19 pandemic. Shastri et al. [16] suggested a framework to manage the epidemic by adopting the technologies for pandemic planning, contact tracing, quarantine management, and testing in health care. Yang et al. [17] elaborated and predicted the impact of the COVID-19 pandemic using Susceptible exposed infectious recovered (SEIR) applying the policies of large-scale quarantine, strict traveling rules, and widespread monitoring of the suspected patients. They used most recent COVID-19 data from Hubei and found that the delay of five days in implementing the policies would result in an increase in the number of cases and later lifting the quarantine from Hubei resulted in another epidemic peak around mid-March. Yuan et al. [18] proposed a framework based on an individual-SEIR (iSEIR) model to observe the epidemic curve using data provided by the Chinese government officials since January 2020. The prediction based on iSEIR model helped in fulfilling the peak demands of government officials, essential industry sectors, hospitals, and other essential services and also for the preparation of aftermath planning. Zhang et al. [19] developed three different SEIQR models to simulate the COVID-19 epidemic in nine different provinces and observed that the number of infected individuals reduced significantly within 30 days by incorporating the intervention of epicenter lockdown and social distancing. Wangping et al. [20] used time-series data for predicting the COVID-19 trend in Italy to assist in developing public health strategies by applying an eSIR model, which incorporates the impact of various intervention measures at different times period to estimate the trend. Homayouni et al. [21] proposed an LSTM-autoencoder based data quality testing approach for sequential records that applies two-level reshaping approach for splitting COVID-19 data sets into several temporary sub-sequences while generating a data visualization plot explaining the anomalies and detected anomaly. Ghosh et al. [22] utilized three growth models (logistic, the exponential, and the susceptible-infectious-susceptible (SIS) model) to develop a unified data-driven ensemble of predictions for model-free maximum daily infection rate (DIR) in India state wise. This DIR was used to measure the effectiveness of nationwide lockdown to categorize the states as severe, moderate, or controlled. They found Delhi, Madhya Pradesh, Gujarat, Maharashtra, Uttar Pradesh, Andhra Pradesh, and West Bengal severely hit by pandemic whereas Bihar, Punjab, Tamil Nadu, Rajasthan were moderately hit and Jammu and Kashmir, Haryana, Kerala, Haryana, Telangana, and Karnataka were in controlled status. Yadav [23] has applied regression models by changing the degree of the regression equation for predicting the COVID-19 cases across India. The author has used a Kaggle dataset for between March 2020 to April 2020 and found the Root Mean Square Error (RMSE) of the six-degree regression equation are comparatively lower than quadratic, third, fourth, fifty, and polynomials degrees. Hamzah et al. [24] developed an online platform named Corona Tracker to predict the death and recovery rate of patients and provides authentic news related to the COVID-19 pandemic using data delivered by the website. Moreover, the author analyses the positive and negative sentiments of the comments and news related to the pandemic and also evaluated economic and political influence due to the spread.
Saba et al. [25] applied time-series and machine learning (ML) techniques (random forests, support vector machines (SVM), decision trees (DTs), K-nearest neighbors (KNNs), polynomial regression, Holt winter, SARIMA, and ARIMA) over time-series data of three countries with various type of lockdown to forecast the daily number of confirmed cases and deaths due to COVID-19. Elsheikh et al. [26] proposed a robust deep learning approach called long short-term memory (LSTM) network to forecast the total counts of confirmed COVID-19 cases, total recovered cases, and total deaths in Saudi Arabia. The model utilized statistical based ML model called Auto-Regressive Integrated Moving Average (ARIMA), followed by another AI based nonlinear autoregressive ANN (NARANN) model. Finally, the proposed LSTM model was applied. A better forecasting was obtained by the proposed model when compared with two other models.
The ARIMA is an ML based model that is one of the statistical models based on time series data that enables a productive evaluation of infectious and non-infectious disease management through its predictive potential. The ARIMA model estimations have successfully predicted the number of hospital beds occupied by severe acute respiratory syndrome (SARS) patients in Singapore opening newer avenues in the applicability of the model [27]. Moreover, ARIMA model has proven to be an efficient tool in supply chain management via planning the epidemic resource allocations like hospital beds, vaccines, drugs, and emergency teams in the health department [28]. A Chinese study by Liu et al. [28] forecasted the cases of hemorrhagic fever with kidney syndrome based on patient’s historical data using ARIMA model. Likewise, Singh et al. [30] implemented the ARIMA model to predict the estimated confirmed cases, deaths, and recoveries following the next 2 months for the top 15 nations based on the spatial mapping. Benvenuto et al. [31] predicted the probable cause of the evolution of the COVID-19 pandemic using various mathematical models including ARIMA.
AI & data analytics in pandemic management
Many organizations, research institutions both in public and private sector are working on exploiting the Machine learning and data analytics for COVID-19 related solutions in India. National Informatics Centre (NIC) has setup a Centre of Excellence in AI5 at Bangalore and Centre of Excellence in Data Analytics6 at Delhi where a number of public sector applications are undertaken apart from healthcare for development of tailored solution as per the requirements of concerned user group. These centers also help in capacity building related to AI and Data Analytics for the government departments. Big Data Analytics and Artificial Intelligence-based solutions are being actively used from tracking COVID-19 progression across country to sourcing secondary lifesaving drugs to streamlining the supply chain of vaccination. AI is helping in mining and structuring critical information related to tracking movements, social media analysis for identifying the sensitive areas, managing supply chain of life-saving drugs, hospitals, oxygen concentrators, streamlining healthcare infrastructure, food and civil supplies to affected areas, post pandemic healthcare etc. The healthcare and pharma sectors are the lead sectors in adoption of data analytics and AI.
The epidemic forecasting models, built on complex algorithms guide the decision-making process for public servants in enhancing testing capabilities, creating quarantine zones and imposing lockdowns. The AI based solution are being used for tracking the affected persons right from entry into the country through airports, seaports and land routes and up to last point movement within the country. The machine learning and data analytics-based solutions are deployed at country, state and district level both by NIC and private agencies. NIC and Defense Research and Development Organisation (DRDO) have developed intelligent COVID detection application software powered by a Deep Convolutional Neural Network. The intelligent web-based software can classify images under ‘normal’, ‘COVID-19’, and ‘pneumonia’, using chest X-rays. IIT developed COVIRAP diagnostic tools consists of a pre-programmable control unit, a special detection unit on genomic analysis and customized mobile app. A data Analytics Platform, Aarogya Setu ITIHAS has been developed by NIC where Aarogya Setu data is analyzed to predict the likely hotspots under guidance of “Empowered group on technology and data management” of Govt. of India. The ITIHAS data analytics ecosystem is also integrated with Bluetooth based mobile apps developed by state govts. and local bodies.
Dynamic COVID-19 Data Management (DCDM) framework
A major highlight of the present work is developing a comprehensive mechanism for collecting the field data. Initially the data was entered in google sheets and excel and forwarded to central team. In June 2020, the portal7 for collecting field data through 14,000 Foot Warriors (field officials of Delhi government) was launched. Later Resident Welfare Association (RWAs) and NGOs joined the efforts in making the field data available to government for decision making. The present COVID-19 Data Management framework is focused on managing and monitoring COVID-19 patient data at a single point from various sources like Geospatial Delhi Limited (GSDL), Hospitals, Quarantine facilities, Labs, Districts, and Dispensaries. The Framework consists of four portals namely Corona Foot Warriors, COVID-19 Data Management, Corona Facility Management and Sample Collection Monitoring system. Each system has a number of modules. The system is exchanging data with other systems through APIs. A number of mobile apps and district level applications are also functional under the umbrella of DCDM. The Framework is depicted in Figs. 1 and 2.
Fig. 1.

COVID-19 data management framework
Fig. 2.

DCDM deployment architecture and interfaces
The Fig. 1 depicts the four verticals under the framework and their features and sub-systems under each category. The Fig. 2 depicts the deployment architecture, interfaces with other systems, the data analytics and forecasting solution, operational units and user groups. The solution is deployed on NIC cloud, whereas the external systems from which data is being exchanged are deployed on private clouds. The data lake of Delhi COVID-19 framework is being used extensively for informed decision making by state administration and for research purposes related to prediction and control. Various time series graphs have been plotted in this paper to visualize the trends associated with daily positive cases, active cases, death reports, bed occupancy, oxygen supply, demand and consumption by the various hospitals, distribution of oximeter, hand sanitizer, and daily vaccination trend by dose. Moreover, a time series ARIMA model has been developed for forecasting the trends of active cases, positive patients’ rate and death rate of COVID-19 patients. The objective of developing a time series model is twofold, to comprehend the stochastic mechanism that gives rise to an observed series and to forecast or predict the forthcoming values for the series based on the given dataset values.
Integrated COVID-19 Command and Control Centre (iCCC)
The DCDM portal as mentioned in Fig. 1 comprises of 11 subsystems. A dynamic dashboard based on the DCDM data repository and other data sources has been built using Azure and Microsoft BI for visual data analytics. As part of the efforts to curb COVID-19 infections in the national capital, Delhi Government has set up an Integrated Command and Control Centre (iCCC) to manage the COVID-19 situation in Delhi. The iCCC has a dynamic dashboard using power BI for real-time data analytics of COVID-19 related data (medical, infrastructure, and logistics). The position under different heads are monitored through iCCC. Data associated with hospitals, vaccination, oxygen supply and other aspects of COVID management are accumulated, classified, and analyzed on a real-time basis. The iCCC is using data from DCDM portal and Central repositories of ICMR and other central agencies as mentioned in Fig. 2.
The iCCC is an authentic source of dynamic status change for top administration and field forces in monitoring current and changing situation and facilitates informed decision-making. The status is updated at regular interval. The iCCC dashboard consists of trends of daily active positive cases, number of tests performed, total number of positive cases, trend of bed occupancy within a time period, daily vaccination trend split by the age of respondents, the trend of oxygen demand received and consumed, the trend of daily reported deaths, the distribution of Oximeter and the new cases added to home isolation, trend of hospitalization against active cases, daily challan issues, and mask and sanitizer distribution.
COVID-19 visual analytics dashboard
iCCC dashboard (https://covid.dashboard.jantasamvad.org/) has taken a significant amount of dataset of last one years which helps in evaluating and plotting the time-series graphs. In this section Fig. 3 illustrates a time series trend based on active cases, positive cases, and daily tests. Whereas Fig. 4, represents the trend of daily reported death due to COVID-19, and Fig. 5 represents the positivity trend of patients. The overall fluctuation within the dataset shows a random pattern and the peeks after February 2021 show the annihilation caused by the third wave of COVID-19 in New Delhi, India. Many people have died due to a shortage of oxygen during the third wave of COVID-19 in Delhi. Due to the sudden abrupt rise in the cases, as there was a limited oxygen stock in hospitals and the Government needed to maintain the record of consumption of oxygen at different levels among all the hospitals in Delhi.
Fig. 3.

Active cases, positive cases and daily test Trends 4.3 Oxygen consumption, demand and supply
Fig. 4.

Trends of daily reported deaths
Fig. 5.
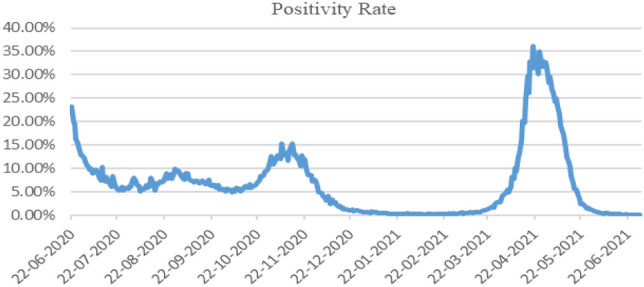
Positivity trend of patients
The time series plots in Fig. 6 show the “Total Daily oxygen requirement”, “Oxygen Distributed in Home Quarantine individuals”, “Oxygen Requirement for both ICU/Non-ICU patients”, and “ICU bed oxygen requirement” in MT. It is seen in this figure that the requirement of oxygen for ICU, non-ICU, and home quarantine patients rose sharply from April to June which signifies the third wave of the pandemic. Furthermore, we have compared the overall demand and consumption of oxygen supply in Delhi-NCR including all the central government hospitals, state government hospitals, and private hospitals, since last year using the time series graphs, shown in Fig. 7.
Fig. 6.

Total daily oxygen requirement
Fig. 7.

Oxygen demand v/s consumption in Delhi NCR
Results
This section holds the result of the experiment starting from the data acquisition followed ARIMA model incorporated for forecasting the active number of cases, positive patients’ rate, and death rates of all the people who were infected with the COVID-19 virus. The generalized algorithm for the experiment is illustrated as follows:

Moreover, the implemented ARIMA model contains three different parameters (p, d, q), where p is the “lag order”, d is “degree of differencing”, and q is the “order of moving average”.
A linear regression model is built containing number and terms type. Degrees of differencing has been used to make data stationary by removing seasonality and trends from the structures exhibiting negative effect on the model.
Let be any original time series and is time series lag by p, is error lag by p, q is the order of moving average and d = t-i is degree of differencing, then the ARIMA model is given by,
for i = 1 to n do
End for
Also, the mean square error for the generated model has been calculated using the formula:
The maximum absolute error is given by
Mean absolute scaled error is calculated using the formula
The ARIMA model or sometimes called the Box-Jenkins model, was developed in 1970s, implements a mathematical approach in describing variations in time series data Liu et al. [32].
Initially, we have drawn a time series plot using a dataset of Active cases in Delhi. It is clearly shown in Fig. 8 that data is not stationary, and it does not follow any trends and patterns.
Fig. 8.

The trend of active cases in Delhi
Moreover, a differenced data plot was drawn in Fig. 9, which help in making the series stationary to deliver viable forecast using the ARIMA model.
Fig. 9.

Differenced data plot
The best fit model has been chosen by selecting the minimum values of Akaike information criterion (AIC) and Bayesian information criterion (BIC) The AIC and BIC values evaluated using R programming is shown in Table 1. After applying the auto ARIMA function in R the best-selected model is ARIMA (4, 0, 3) for forecasting active cases of COVID-19 patients.
Table 1.
Best fit forecasting model given by ARIMA (active cases)
| Coefficients: | ar1 | ar2 | ar3 | ar4 |
|---|---|---|---|---|
| 0.5281 | 1.1891 | − 0.0973 | − 0.6324 | |
| s.e | 0.141 | 0.1664 | 0.1311 | 0.1239 |
| ma1 | ma2 | ma3 | Mean | |||
|---|---|---|---|---|---|---|
| 0.6514 | − 0.3266 | − 0.2535 | 21,171.278 | |||
| s.e | 0.1618 | 0.0793 | 0.1196 | 4631.191 | ||
| sigma^2 estimated as 1141870: | log likelihood = − 3138.77 | |||||
| AIC = 6295.54 | AICc = 6296.03 | BIC = 6330.86 | ||||
Now, the autocorrelation factor (ACF) shown in Fig. 10 and partial autocorrelation factor (PACF) shown in Fig. 11 were plotted to find out the stationary pattern around the value of mean and variance. The crux is to recognize the existence of MA and AR components within the residuals. As there are number of spikes outside the significant zone, therefore the residuals are not random has been concluded. Further, the Box-Ljung test was applied for finding the autocorrelation status of time series data. The null-hypothesis (Ho) of the Box-Ljung Test is that the model has no autocorrelation issue (does not shows the lack of fit). Whereas the alternate-hypothesis (Ha) is that autocorrelation issue does exists within the model (reveal a lack of fit).
Fig. 10.

Auto correlation function (ACF)
Fig. 11.

Partial auto correlation function (PACF)
Here in Table 2, we have calculated p-values at three different lags (5, 15, 25) to evaluate the Box-Ljung test, we have found that the test is statistically non-significant as p-values are greater than 0.05 (at 95% CI), so we fail to reject the Ho and conclude that our model doesn’t have any autocorrelation issue. Moreover, the Q–Q plot is shown in Fig. 12, has been used to compare two different distributions of residuals and also confirms the normality of distribution error.
Table 2.
Box-Ljung statistics for active cases
| X-squared = 0.52761 | lag/df = 5 | p-value = 0.9911 |
| X-squared = 10.549 | lag/df = 15 | p-value = 0.7839 |
| X-squared = 10.806 | lag/df = 25 | p-value = 0.9938 |
Fig. 12.

Normal Q–Q Plot
The evaluated results are ordered and equated to the idealized Gaussian distribution. The scatter plot diagram is used to compare the two distributions, presented as a diagonal line from the left bottom side to the right top of the plot. (where x-axis presents the theoretical and y-axis presents observed values). The next step is to predict active cases for the next 25 weeks starting from June 2021, through the above model. The forecast ARIMA model is shown in Fig. 13.
Fig. 13.

Forecast from ARIMA
The summary and accuracy matrix given by ARIMA model for forecasting active cases is shown in Table 3.
Table 3.
Summary and accuracy matrix given by ARIMA model for forecasting active cases
| Training set error measures: | ME | RMSE | MAE | MASE |
|---|---|---|---|---|
| Training set | 1.45826 | 57.093 | 7.859 | 0.02094449 |
A time series plot using a dataset of positive patients rate in Delhi has drawn. It is clearly shown in Fig. 14 that data is not stationary, and it does not follow any trends and patterns. Moreover, a differenced data plot was drawn in Fig. 15, which help in making the series stationary to deliver viable forecast using the ARIMA model.
Fig. 14.

The trend of positive patients rate in Delhi
Fig. 15.

Differenced data plot
ARIMA (2, 1, 2) is the best selected model after applying the ARIMA function for forecasting positive patients rate with non-zero mean is shown in Table 4. Further, the autocorrelation factor (ACF) shown in Fig. 16 and partial autocorrelation factor (PACF) shown in Fig. 17 were plotted to identify patterns in the data which is stationary on both mean and variance.
Table 4.
Best fit forecasting model is given by ARIMA (positive patients rate)
| Coefficients: | ar1 | ar2 | ma1 | ma2 |
|---|---|---|---|---|
| 0.2253 | − 0.724 | − 0.3278 | 0.977 | |
| s.e | 0.0426 | 0.0406 | 0.0149 | 0.0147 |
| sigma^2 estimated as: 836952 | log likelihood = − 3072.06 | |||
| AIC = 6154.13 | AICc = 6154.29 | BIC = 6173.73 | ||
Fig. 16.

Auto correlation function (ACF)
Fig. 17.

Partial auto correlation function (PACF)
Further, the Box-Ljung test was applied for finding the autocorrelation status of time series data. Here in Table 5, we have calculated p-values at three different lags (5, 15, 25) to evaluate the Box-Ljung test, we have found that the test is statistically non-significant as p-values are greater than 0.05 (at 95% CI), so we reject fail to reject the Ho and conclude that our model does not have any autocorrelation issue.
Table 5.
Box-Ljung statistics for positive patients rate
| X-squared = 1.8186 | lag/df = 5 | p-value = 0.8736 |
| X-squared = 24.679 | lag/df = 15 | p-value = 0.05442 |
| X-squared = 33.131 | lag/df = 25 | p-value = 0.1278 |
Moreover, the Q-Q plot, or quantile plot shown in Fig. 18, compares two distributions and can be used to see how similar or different they happen to be. The scatter plot diagram is used to compare the two distributions, presented as a diagonal line from the left bottom side to the right top of the plot. (where x-axis presents the theoretical and y-axis presents observed values). The next step is to predict positive patients rate for the next 25 weeks starting from June 2021, through the above model. The forecast ARIMA model is shown in Fig. 19. The summary and accuracy matrix given by ARIMA model for forecasting positive patient rate is shown in Table 6.
Fig. 18.

Normal Q–Q plot
Fig. 19.

Forecast model of positive patients rate by ARIMA
Table 6.
Summary and accuracy matrix given by ARIMA model for forecasting positive patient rate
| Training set error measures: | ME | RMSE | MAE | MASE |
|---|---|---|---|---|
| Training set | 0.050663 | 18.715 | 5.1237 | 0.08238156 |
A time series plot using a dataset of Death rate in Delhi has been drawn. It is clearly shown in Fig. 20 that data is not stationary, and it does not follow any trends and patterns. Moreover, a differenced data plot was drawn in Fig. 21, which help in making the series stationary to deliver viable forecast using the ARIMA model. ARIMA (1, 1, 2) is the best selected model after applying the ARIMA function for forecasting Death rate in Delhi with non-zero mean is shown in Table 7.
Fig. 20.

The trend of Death rate in Delhi
Fig. 21.

Differenced data plot
Table 7.
Best fit forecasting model given by ARIMA (death cases)
| Coefficients: | ar1 | ma1 | ma2 |
|---|---|---|---|
| 0.8918 | − 1.4062 | 0.6152 | |
| s.e | 0.0341 | 0.0476 | 0.0397 |
| sigma^2 estimated as 208.8: | log likelihood = − 1524.47 | ||
| AIC = 3056.93 | AICc = 3057.04 | BIC = 3072.62 | |
Further, the ACF and PACF for death rate dataset has been plotted which is shown in Figs. 22 and 23 to help identifying the patterns in the data which is stationary on both mean and variance.
Fig. 22.

Auto correlation function (ACF)
Fig. 23.

Partial auto correlation function (PACF)
Furthermore, the Box-Ljung test was applied for finding the autocorrelation status of time series data. Here in Table 8, we have calculated p-values at three different lags (5, 15, 25) to evaluate the Box-Ljung test, we have found that the test is statistically significant as p-values are less than 0.05 (at 95% CI), so we reject Ho and conclude that our model does have autocorrelation issue.
Table 8.
Box-Ljung statistics for death cases
| X-squared = 13.065 | lag/df = 5 | p-value = 0.02277 |
| X-squared = 43.388 | lag/df = 15 | p-value = 0.000137 |
| X-squared = 82.662 | lag/df = 25 | p-value = 4.341e-08 |
Moreover, the Q–Q plot, shown in Fig. 24, compares two different distributions and can be used to see how similar or different they happen to be. The scatter plot diagram is used to compare the two distributions, presented as a diagonal line from the left bottom side to the right top of the plot. (where x-axis presents the theoretical and y-axis presents observed values). The next step is to predict death rate for the next 25 weeks starting from June 2021, through the above model. The forecast ARIMA model is shown in Fig. 25.
Fig. 24.

Normal Q–Q plot
Fig. 25.

Forecast model of death rate by ARIMA
The summary and accuracy matrix given by ARIMA model for forecasting death rate is shown in Table 9.
Table 9.
Summary and accuracy matrix given by ARIMA model for forecasting death cases
| Training set error measures: | ME | RMSE | MAE | MASE |
|---|---|---|---|---|
| Training set | 0.08819 | 14.37282 | 8.0759 | 0.0735 |
For performance and outcome review, the model of Delhi state was compared with COVID management model prevailing in Kerala and Maharashtra. These three were the most affected states and the mitigation and control mechanism developed by them were replicated by other states. On the basis of enumerated model features as shown in Table 10, it was observed that this Delhi model has built in-depth data analytics and most exhaustive features and has performed better for the third pandemic wave in terms of COVID-19 detection, monitoring and control than the other two state models.
Table 10.
Pandemic mitigation and control features of model prevalent in Delhi Kerala and Maharashtra
| Features | Delhi | Kerala | Maharashtra |
|---|---|---|---|
| ICMR Line List Integration | ✓ | × | × |
| COVID Bed Inventory Management | ✓ | ✓ | ✓ |
| Pediatric Bed Inventory Management | ✓ | × | × |
| Oxygen Inventory Management | ✓ | ✓ | ✓ |
| Drugs Stock Management | ✓ | × | ✓ |
| Drugs Demand & Supply System | ✓ | × | × |
| Human Resource Management | ✓ | × | × |
| Oxygen Tracking Module | ✓ | ✓ | ✓ |
| Patient Management | ✓ | ✓ | × |
| Containment Zone Management | ✓ | ✓ | × |
| Home Isolation Management | ✓ | ✓ | × |
| COVID Death Management | ✓ | × | × |
| Sample Collection Monitoring | ✓ | × | × |
| Contact Tracing Module | ✓ | ✓ | × |
| ODAS Integration | × # | ✓ | ✓ |
| Citizen’s Dashboard | ✓ | ✓ | ✓ |
| Health Bulletin | ✓ | × | × |
| Citizen Financial Relief | ✓ | × | × |
| Curfew e-Pass | ✓ | ✓ | ✓ |
| Mobile App | ✓ | ✓ | ✓ |
| Chatbot | × | × | ✓ |
| Virtual Interaction | ✓ | ✓ | |
| Visual Analytics | ✓ | × | × |
| Predictive Analytics | ✓ | × | × |
| Big Data Analytics | Azure | × | × |
| AI application | ✓ | × | ✓ |
| Integrated Command and Control Centre | ✓ | ✓ | × |
| Design, Development, Technical Support | NIC | NIC+ others | MahaIT + others |
Conclusion
Each wave of COVID-19 is showing the emergence of new variants which are relatively more ferocious than the earlier ones resulting in the wider spread and a loss of life. Worldwide more than 3 million deaths have occurred so far, and 29.9 million positive cases were recorded wherein more than 3.74 lakh people were deceased in India alone. The present solution has been instrumentation in mitigating the second wave to the extent that at present the number of positive cases and deaths are the lowest in the last fifteen months. The extensive Data Analytics & Knowledge Management integrated Command and Control Centre (iCCC) helps in guiding the authorities in making informed decisions for comprehensive management of the COVID-19 pandemic. The iCCCs dynamic dashboard based on the DCDM data repository and other time-series data sources has been built using Azure and Power BI for current and predictive data analytics. Data related to hospitals, vaccination, oxygen, recoveries/deaths, rehabilitation, and other aspects of COVID management are accumulated, classified, and analyzed on a real-time basis. The iCCC is guiding top administration and field forces in monitoring current and changing statistics and facilitate informed decision-making.
Based on the given time series datasets the trends have been plotted for daily active positive cases, the tests performed, the positive number of cases, the trend of oxygen received, demanded, and consumed, the trend of daily reported deaths, a trend of hospitalization against active cases. Moreover, in this paper, an Auto-Regressive Integrated Moving Average (ARIMA) model was implemented for forecasting the active number of cases, positive patients’ rate, and death rates of all the patients who are infected with the COVID-19 virus. The Box-Ljung statistic was applied for finding the autocorrelation issues within the developed models. We have found that only Death rate cases have autocorrelation issue, however, Active Cases and Positive Patients rate does not have autocorrelation issue. The data was forecasted for the next 25 weeks’ time period in order to provide better surveillance and control of COVID-19 patients in Delhi state. The adequate level of accuracy measure is provided by the respective ARIMA model while forecasting the active cases, positive patients rate, and death cases. The values of Root Mean Squared Error (RMSE) and Mean Absolute Error (MAE) generated by the forecasting model of active cases are 57.093, 7.859 while values provided by positive patients rate and death cases are 18.715, 5.1237, and 14.37282, 8.0759, respectively.
The future work includes the development of a model to visualize new variants of COVID-19, psychological impacts of COVID-19, and to assesses the cause and effect of different COVID-19 vaccinations received by people all over the state, also by controlling several external factors like age, gender, pre-existing medical conditions, etc. Hence, a unified model covering all the states can be worked out which will reflect the predictive approach and mitigation strategies of the epidemic.
The novelty of the work is proven, as there is no state level model with such exhaustive features. The Delhi govt. has started using this framework for seasonal epidemics and plans to integrate the Citizens Health card with this framework. Many Indian states have adopted several modules of the present solution.
Acknowledgements
This research work is supported by Visvesvaraya PhD Scheme, under Ministry of Electronics & IT (MeitY), Govt. of India and Govt. of NCT Delhi
Footnotes
Contributor Information
Iqbal Hasan, Email: dafkdci@gmail.com.
Prince Dhawan, Email: princedhawan@gmail.com.
S. A. M. Rizvi, Email: sarizvi@jmi.ac.in
Sanjay Dhir, Email: sanjaydhir.iitd@gmail.com.
References
- 1.Hasan I, Rizvi SAM, Geelani A (2021) Digital response framework for COVID-19 pandemic monitoring and control in India. 10.21203/rs.3.rs-815744/v1
- 2.Sheela MS, Arun CA. Hybrid PSO-SVM algorithm for Covid-19 screening and quantification. Int J Inf Technol. 2022;12:1–8. doi: 10.1007/s41870-021-00856-y. [DOI] [PMC free article] [PubMed] [Google Scholar]
- 3.Mbunge E, Akinnuwesi B, Fashoto SG, Metfula AS, Mashwama P. A critical review of emerging technologies for tackling COVID?19 pandemic. Hum Behavior Emerg Technol. 2021;3(1):25–39. doi: 10.1002/hbe2.237. [DOI] [PMC free article] [PubMed] [Google Scholar]
- 4.Zheng N, Du S, Wang J, Zhang H, Cui W, Kang Z, Xin J. Predicting Covid-19 in China using hybrid AI model. IEEE Trans Cybern. 2020;5(7):2891–2904. doi: 10.1109/TCYB.2020.2990162. [DOI] [PubMed] [Google Scholar]
- 5.Tuli S, Tuli S, Tuli R, Gill SS. Predicting the growth and trend of COVID-19 pandemic using machine learning and cloud computing. Internet Things. 2020;11:100222. doi: 10.1016/j.iot.2020.100222. [DOI] [PMC free article] [PubMed] [Google Scholar]
- 6.Mariappan MB, Devi K, Venkataraman Y, Lim MK, Theivendren P. Using AI and ML to predict shipment times of therapeutics, diagnostics and vaccines in e-pharmacy supply chains during COVID-19 pandemic. Int J Logist Manage. 2022 doi: 10.1108/IJLM-05-2021-0300. [DOI] [Google Scholar]
- 7.Ye Q, Zhou J, Wu H. Using information technology to manage the COVID-19 pandemic: development of a technical framework based on practical experience in China. JMIR Med Inform. 2020;8(6):e19515. doi: 10.2196/19515. [DOI] [PMC free article] [PubMed] [Google Scholar]
- 8.Majhi R, Thangeda R, Sugasi RP, Kumar N. Analysis and prediction of COVID?19 trajectory: a machine learning approach. J Public Aff. 2021;21(4):e2537. doi: 10.1002/pa.2537. [DOI] [PMC free article] [PubMed] [Google Scholar]
- 9.Devaraj J, Elavarasan RM, Pugazhendhi R, Shafiullah GM, Ganesan S, Jeysree AK, Hossain E, et al. Forecasting of COVID-19 cases using deep learning models: is it reliable and practically significant? Results Phys. 2021;21:103817. doi: 10.1016/j.rinp.2021.103817. [DOI] [PMC free article] [PubMed] [Google Scholar]
- 10.Sinha A, Rathi M. COVID-19 prediction using AI analytics for South Korea. Appl Intell. 2021;51(12):8579–8597. doi: 10.1007/s10489-021-02352-z. [DOI] [PMC free article] [PubMed] [Google Scholar]
- 11.Hassan MR, Hassan MM, Altaf M, Yeasar MS, Hossain MI, Fatema K, Ahmed AF, et al. B5G-enabled distributed artificial intelligence on edges for COVID-19 pandemic outbreak prediction. IEEE Netw. 2021;35(3):48–55. doi: 10.1109/MNET.011.2000713. [DOI] [Google Scholar]
- 12.Khanday AMUD, Rabani ST, Khan QR, et al. Machine learning based approaches for detecting COVID-19 using clinical text data. Int J Inf Technol. 2020;12:731–739. doi: 10.1007/s41870-020-00495-9. [DOI] [PMC free article] [PubMed] [Google Scholar]
- 13.El-Din DM, Hassanein AE, Hassanien EE, Hussein WM (2020) E-Quarantine: a smart health system for monitoring coronavirus patients for remotely quarantine. arXiv:2005.04187
- 14.Wynants L, Calster BV, Collins GS, Riley RD, Heinze G, Schuit E, et al. Prediction models for diagnosis and prognosis of covid-19: systematic review and critical appraisal. BMJ. 2020;369:1–9. doi: 10.1136/bmj.m1328. [DOI] [PMC free article] [PubMed] [Google Scholar]
- 15.Whitelaw S, Mamas MA, Topol E, Van Spall HG. Applications of digital technology in COVID-19 pandemic planning and response. Lancet Dig Health. 2020;2(8):e435–e440. doi: 10.1016/S2589-7500(20)30142-4. [DOI] [PMC free article] [PubMed] [Google Scholar]
- 16.Shastri S, Singh K, Kumar S, Kour P, Mansotra V. Deep-LSTM ensemble framework to forecast Covid-19: an insight to the global pandemic. Int J Inf Technol. 2021;3:1–1. doi: 10.1007/s41870-020-00571-0. [DOI] [PMC free article] [PubMed] [Google Scholar]
- 17.Yang Z, Zeng Z, Wang K, Wong SS, Liang W, Zanin M, et al. Modified SEIR and AI prediction of the epidemics trend of COVID-19 in China under public health interventions. J Thorac Dis. 2020;12(3):165–174. doi: 10.21037/jtd.2020.02.64. [DOI] [PMC free article] [PubMed] [Google Scholar]
- 18.Yuan GX, Di L, Gu Y, Qian G, Qian X. The framework for the prediction of the critical turning period for outbreak of COVID-19 spread in China based on the iSEIR model. medRxiv. 2020;5:256. doi: 10.1101/2020.04.05.20054346. [DOI] [Google Scholar]
- 19.Zhang Y, Jiang B, Yuan J, Tao Y. The impact of social distancing and epicenter lockdown on the COVID-19 epidemic in mainland China: A data-driven SEIQR model study. medRxiv. 2020 doi: 10.1101/2020.03.04.20031187. [DOI] [Google Scholar]
- 20.Wangping J, Yang HKES, Wenzhe C, Shengshu W, Shanshan Y, Yao H. Extended SIR prediction of the epidemics trend of COVID-19 in Italy and compared with Hunan, China. Front Med. 2020;7:169. doi: 10.3389/fmed.2020.00169. [DOI] [PMC free article] [PubMed] [Google Scholar]
- 21.Homayouni H, Ray I, Ghosh S, Gondalia S, Kahn MG. Anomaly detection in COVID-19 time-series data. SN Comput Sci. 2021;2(4):1–17. doi: 10.1007/s42979-021-00658-w. [DOI] [PMC free article] [PubMed] [Google Scholar]
- 22.Ghosh P, Ghosh R, Chakraborty B. COVID-19 in India: statewise analysis and prediction. JMIR Public Health Surveill. 2020;6(3):e20341. doi: 10.2196/20341. [DOI] [PMC free article] [PubMed] [Google Scholar]
- 23.Yadav RS. Data analysis of COVID-2019 epidemic using machine learning methods: a case study of India. Int J Inf Technol. 2020;12:1321–1330. doi: 10.1007/s41870-020-00484-y. [DOI] [PMC free article] [PubMed] [Google Scholar]
- 24.Hamzah FB, Lau C, Nazri H, Ligot DV, Lee G, Tan CL. CoronaTracker: worldwide COVID-19 outbreak data analysis and prediction. Bull World Health Organ. 2020;1(32):1–32. doi: 10.2471/BLT.20.255695. [DOI] [Google Scholar]
- 25.Saba T, Abunadi I, Shahzad MN, Khan AR. Machine learning techniques to detect and forecast the daily total COVID?19 infected and deaths cases under different lockdown types. Microsc Res Tech. 2021;84(7):1462–1474. doi: 10.1002/jemt.23702. [DOI] [PMC free article] [PubMed] [Google Scholar]
- 26.Elsheikh AH, Saba AI, Abd Elaziz M, Lu S, Shanmugan S, Muthuramalingam T, Shehabeldeen TA, et al. Deep learning-based forecasting model for COVID-19 outbreak in Saudi Arabia. Process Saf Environ Prot. 2021;149:223–233. doi: 10.1016/j.psep.2020.10.048. [DOI] [PMC free article] [PubMed] [Google Scholar]
- 27.Earnest A, Chen MI, Ng D, Sin LY. Using autoregressive integrated moving average (ARIMA) models to predict and monitor the number of beds occupied during a SARS outbreak in a tertiary hospital in Singapore. BMC Health Serv Res. 2005;5(1):1–8. doi: 10.1186/1472-6963-5-36. [DOI] [PMC free article] [PubMed] [Google Scholar]
- 28.Rathlev NK, Chessare J, Olshaker J, Obendorfer D, Mehta SD, Rothenhaus T. Time series analysis of variables associated with daily mean emergency department length of stay. Ann Emerg Med. 2007;49(3):265–271. doi: 10.1016/j.annemergmed.2006.11.007. [DOI] [PubMed] [Google Scholar]
- 29.Liu Q, Liu X, Jiang B, Yang W. Forecasting incidence of hemorrhagic fever with renal syndrome in China using ARIMA model. BMC Infect Dis. 2011;11(1):218–218. doi: 10.1186/1471-2334-11-218. [DOI] [PMC free article] [PubMed] [Google Scholar]
- 30.Singh RK, Rani M, Bhagavathula AS, Sah R, Rodriguez-Morales AJ, Kalita H, Nanda C, Sharma S, Sharma YD, Rabaan AA, Rahmani J, Kumar P. Prediction of the COVID-19 pandemic for the Top 15 affected countries: advanced autoregressive integrated moving average (ARIMA) Model. JMIR Public Health Surveil. 2020;6(2):1–10. doi: 10.2196/19115. [DOI] [PMC free article] [PubMed] [Google Scholar]
- 31.Benvenuto D, Giovanetti M, Vassallo L, AngelettiS CM. Application of the ARIMA model on the COVID-2019 epidemic dataset. Data Brief. 2020;29:105340. doi: 10.1016/j.dib.2020.105340. [DOI] [PMC free article] [PubMed] [Google Scholar]
- 32.Liu K, Chen Y, Lin R, Han K. Clinical features of COVID-19 in elderly patients: a comparison with young and middle-aged patients. J Infect. 2020;80(6):e14–e18. doi: 10.1016/j.jinf.2020.03.005. [DOI] [PMC free article] [PubMed] [Google Scholar]