

Abstract
A push-pull method, previously used in groundwater analyses, was successfully adapted for measuring sulfide turnover rates in situ at different depths in the meromictic Lake Cadagno. In the layer of phototrophic bacteria at about 12 m in depth net sulfide consumption was observed during the day, indicating active bacterial photosynthesis. During the night the sulfide turnover rates were positive, indicating a net sulfide production from the reduction of more-oxidized sulfur compounds. Because of lack of light, no photosynthesis takes place in the monimolimnion; thus, only sulfide formation is observed both during the day and the night. Sulfide turnover rates in the oxic mixolimnion were always positive as sulfide is spontaneously oxidized by oxygen and as the rates of sulfide oxidation depend on the oxygen concentrations present. Sulfide oxidation by chemolithotrophic bacteria may occur at the oxicline, but this cannot be distinguished from spontaneous chemical oxidation.
Lakes, like most ecosystems, are open systems in a steady state with different trophic levels. To understand the interactions between organisms and the environment, inputs and outputs of the nutrients at each trophic level must be known. Rates describe the turnover of chemical species at specific sites and therefore describe elemental fluxes in biogeochemical cycles as well as microbial activities in an ecosystem.
In physiology and ecology several methods for evaluating rates have been described. In sediments microbial reaction rates are calculated from concentration-depth profiles by using flux calculations based on a modified Fick's first law; however, as incubations of several days are necessary, only a low temporal resolution is achieved. Primary production rates from phytoplankton are obtained by the use of radioactive carbon isotopes. Samples are collected in a depth profile and incubated with 14CO2 at the originating depth for a few hours. But such results will also not give the actual in situ reaction rates for rapidly cycling elements.
In this paper we present a new approach for determining in situ reaction rates for production and consumption of sulfide in the open water. Experiments were done in a meromictic alpine lake with a pronounced biological sulfur cycle (7, 11, 12, 15, 20). Under anoxic conditions sulfide is produced by sulfate-reducing bacteria, which reduce sulfate to sulfide at the expense of organic substrates. At the same time, if light is present, sulfide is oxidized by anoxygenic phototrophic bacteria, which use it as an electron donor. Concentration profiles for Lake Cadagno often show no sulfide in the layer with the highest biomass concentration of the water column and thus cannot give information on actual turnover rates of the sulfur compounds because, in a steady state, sources and sinks are balanced. The “push-pull” technique, which has been previously applied in groundwater systems (9, 10, 17) was used to obtain real in situ sulfide turnover rates with a high temporal resolution in an undisturbed ecosystem.
MATERIALS AND METHODS
Site description.
Lake Cadagno is a meromictic alpine lake about 21 m in depth and 300 by 500 m in size. It is located at an altitude of 1,920 m in the southern part of the Alps in Switzerland. The chemistry of the lake water is determined by the geology of the region. A band with dolomite and gypsum in the catchment area of the lake is surrounded by crystalline rock. Sulfate is leached from the gypsum and enters the lake at the surface and by underwater springs. The monimolimnion is constantly anoxic, and there sulfate is reduced to sulfide by sulfate-reducing bacteria. At the redoxcline between the oxic mixolimnion and the anoxic monimolimnion steep gradients of oxygen and sulfide are observed (Fig. 2) (7, 11, 15). Just below this interphase the high turbidity indicates a dense population of anoxygenic phototrophic bacteria composed mainly of Chromatium okenii and Amoebobacter purpureus (6, 15, 20). These bacteria use sulfide as the electron donor during photosynthesis and oxidize it mainly to S0 and SO42−. In the dark these phototrophs reduce elemental sulfur again to sulfide in an anaerobic respiration (4, 21). This zone of primary production is of great importance for the food web in the lake. Sulfate-reducing bacteria, which are present in the same layer as the phototrophic bacteria as well as in the deeper water and the sediments, reduce sulfate to sulfide using products of the degradation of settling biomass as electron donors. Besides these processes, sulfide is oxidized at the edge of the oxic mixolimnion by chemolithotrophs as well as by spontaneous chemical reactions (1, 14, 18). Many profiles of chemical parameters including sulfide concentrations have been collected during the past years. Interestingly enough, the depth of highest bacterial density is often completely devoid of sulfide during daytime (Fig. 2) (7, 11, 12), while the cells of Chromatium species present in this layer are usually full of sulfur droplets (S0, polysulfide).
FIG. 2.

Different profiles of Lake Cadagno (17 September 1997, morning). Profiles for conductivity (▾), oxygen (▴), temperature (□), turbidity (●), and pH (■) are shown.
Push-pull experiments.
The push-pull method was originally developed in the oil technology field to determine residual oil saturations in petroleum reservoirs (19). Recently, Istok et al. (9, 10, 17) adapted the technique to quantify rates of microbial processes such as aerobic respiration, denitrification, sulfate reduction, and methanogenesis in a petroleum-contaminated aquifer.
In a push-pull experiment a pulse-type injection of a defined test solution followed by a chaser for rinsing the test solution completely into the analyzed site (groundwater or open water) is followed by the extraction of the test solution-water mixture from the same site after a defined reaction time, i.e., the time between injection and retrieval. The test solution contains a conservative tracer (sodium ions) and the reactant (sulfide). The conservative tracer is not changed by a spontaneous chemical reaction or by microbial activity and serves to compensate for losses of the reactant by diffusion and fluxes. In contrast, the reactant may be changed by both spontaneous chemical reactions and by microbial activity. During the extraction phase the concentrations of the reactant and the conservative tracer are continuously monitored in a flow cell.
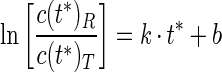
The first-order reaction rate of the reactant is calculated using the simplified method of push-pull test data analysis by fitting the natural logarithm of the ratio of the relative recovered concentrations of the reactant to the tracer versus the time since the injection ended in accordance with the following equations (9):
 |
1 |
 |
2 |
where k is the sulfide reaction rate (turnover rate) for netto sulfide consumption (equation 1) or production (equation 2), t* is the time since the end of injection, tinj is the injection time, cR is the relative concentration of the reactant (sulfide), and cT is the relative concentration of the conservative tracer (Na+).
Because in the open-water system high concentrations of conservative tracer and reactant have to be injected, the concentrations of both rise rapidly in the flow cell at the beginning of the extraction phase. As the flow cell is not always free of oxygen at the beginning of the extraction phase, only the data obtained after pumping up the dead volume of the tube and flow cell were used for calculations. Therefore the intercept on the y axis (equations 1 and 2) is not considered, and the sulfide turnover rate is calculated with linear regression by using the ratio of the relative sulfide and sodium concentrations versus the time since the injection ended, as given by
 |
3 |
where k is the sulfide reaction rate for both consumption (k < 0) and production (k > 0) and b is the term of correction for production or consumption of sulfide during the injection time and for losses.
The largest amounts of reactant and conservative tracer are detected after pumping up the dead volume of the system. In the monimolimnion the high background concentration of sulfide (reactant) has to be considered, and only sulfide concentrations which were higher than the background concentration were used for data analyses.
This model does not require the solution of a flow or transport model. With respect to the open-water system considered here, the main assumptions are that the volume of test solution is well mixed within itself, that the reactant shows a pseudo-first-order kinetics, and that the retardation factors of tracer and reactant are identical. To measure the sulfide turnover in the open water of Lake Cadagno, the test solution contained 3 to 15 g of Na2S · 9H2O liter−1, 0.02 M Ti(III) citrate as the antioxidant, and 6.05 g of Tris-HCl buffer (pH 7.5 to 8) liter−1. Water from the anoxic part of the lake was used as the chaser. The analytical instruments and the pump were placed on a working platform situated above the deepest point of the lake (Fig. 1). To ensure that the injection and extraction sites were the same, the injection/retrieval tube was fixed on an underwater buoy, which was stabilized with cables and weights to the bottom of the lake.
FIG. 1.

Installation for push-pull test experiments in Lake Cadagno. 1, working platform; 2, underwater buoy; 3, tube; 4, distributor; 5, weight; 6, cable; 7, buoy stones.
A homemade flow cell of polyvinyl chloride contained a pH electrode (6.0202.100; Metrohm, Herisau, Switzerland), a sodium electrode (Na61; Schott Glaswerke, Mainz, Germany), a temperature sensor (TF 185; Wissenschaftlich-Technische-Werkstätten, Weilheim, Germany), an amperometric sulfide sensor (sulfide sensor type II; Analysenmesstechnik, Rostock, Germany) and a butyl rubber septum for sampling. Besides the flowthrough measurements, the sulfide concentration was determined potentiometrically after sampling. Two-milliliter samples were immediately stabilized with an equal volume of antioxidant solution (250 g of sodium salicylate, 65 g of ascorbic acid, and 85 g of NaOH liter−1), and the sulfide concentrations were measured with a sulfide microelectrode (ION-1MS and REF-1; Toepffer Lab Systems).
During the retrieval phase of the push-pull experiments, samples for protein, bacteriochlorophyll a, and colorimetric sulfide determination were collected and kept in the dark until analysis.
Analytics.
Protein was determined with Folin reagent (13), and bacteriochlorophyll a was measured by absorption spectroscopy after extraction with acetone-methanol (3).
Profiles of conductivity, oxygen, pH, temperature, and turbidity were obtained with an Aqua-Check multisensor (water analyzer; Perstop Analytical Environmental) combined with a homemade turbidity sensor described by Egli et al. (5). Vertical sampling in the layer with high spatial resolution for determining concentrations of protein, bacteriochlorophyll a and sulfide in the redoxcline was done with a syringe sampler. The syringes were placed at intervals of 10 cm and were opened at the sampling site with compressed air. For sulfide determinations samples were fixed immediately with 4% zinc acetate to prevent oxidation and the sulfide was determined later spectrophotometrically (8).
RESULTS
Chemical and biological profiles in Lake Cadagno.
Figure 2 shows typical profiles in Lake Cadagno during summer stratification in 1997. Oxygen drops to zero below a depth of about 10 m, and a redoxcline from oxic to anoxic conditions is formed with increasing concentrations of sulfide towards the bottom of the lake. At the redox boundary the turbidity is strongly increased and large concentrations of bacteriochlorophyll a are detected during the summer season. This indicates a dense layer of anoxygenic phototrophic bacteria, dominated by C. okenii and A. purpureus (5, 11, 15, 20). Gradients of conductivity and temperature below 7 m in depth cause an increase in the density of the water, which results in a stable stratification of the lake. High-resolution profiles of sulfide show a steep gradient in the redoxcline. Maximum sulfide concentrations are detected at the lower edge of the redoxcline, with a decrease to 0 mM towards the top of the bacterial layer. Thus, at maximum cell density often no sulfide is detected (Fig. 3).
FIG. 3.

High-resolution profiles (22 July 1998, afternoon) of bacteriochlorophyll a (●), protein (■), and sulfide (▴) in the redoxcline.
Sulfide turnover rates.
The first push-pull experiments were done at the lower part of the bacterial layer to ensure absolute anoxic experimental conditions. In the absence of oxygen, sulfide turnover rates will mainly originate from biological activities. Interestingly, at this depth, which receives only small amounts of light, both sulfide production and sulfide consumption have been measured at different times during the day (Fig. 4 and 5). In contrast, during the night, sulfide turnover rates were always positive, indicating sulfide formation.
FIG. 4.

(Left) Breakthrough curve during the extraction (19 September 1997). Conditions: 600-ml test solution; pump rate during retrieval, 40 ml · min−1. (Right) Tracer (Na+) and reactant (S2−) breakthrough curves during the extraction phase (19 September 1997). Conditions: 600-ml test solution; pump rate during retrieval, 40 ml · min−1.
FIG. 5.

(Left) Breakthrough curve during the extraction phase (6 October 1997). Conditions: 600-ml test solution; pump rate during retrieval, 40 ml · min−1. (Right) Tracer (Na+) and reactant (S2−) breakthrough curves during the extraction phase (6 October 1997). Conditions: 600-ml test solution; pump rate during retrieval, 40 ml · min−1.
For a better understanding of the dynamics of the sulfur cycle in situ, sulfide turnover profiles were obtained at different times of the day and at different depths. Results from different depths are presented in Table 1. During the day, at the site of maximum bacterial density all sulfide turnover rates were negative, i.e., they showed net sulfide consumption. Rates ranged from −0.93 to −23.48 h−1, indicating the high variability in the extent of anoxygenic photosynthesis. Both the bacteriochlorophyll a concentrations and the specific bacteriochlorophyll a content (bacteriochlorophyll a/protein ratio) were highest at this depth in the lake.
TABLE 1.
Results of different push-pull test experiments in the redoxcline, redoxcline/monimolimnion boundary, and in the monimolimnion
| Date (mo/day/yr) and timea | Data for push-pull experiments at:
|
|||||||||||
|---|---|---|---|---|---|---|---|---|---|---|---|---|
| Maximum turbidity in the redoxcline
|
Redoxcline/monimolimnion boundary
|
Monimolimnion
|
||||||||||
| Depth (m) | k (h−1) | Protein level (mg/liter) | Bacteriochlorophyll a level (mg/liter) | Depth (m) | k (h−1) | Protein level (mg/liter) | Bacteriochlorophyll a level (mg/liter) | Depth (m) | k (h−1) | Protein level (mg/liter) | Bacteriochlorophyll a level (mg/liter) | |
| 8/27/98, p.m. | 12.5 | −2.79 | 114.52 | 0.11 | 13.6 | +3.34 | 534.52 | 0.04 | 15.2 | +3.35 | 242.35 | 0.03 |
| 8/28/98, a.m. | 12.6 | −0.93 | 187.57 | 0.09 | 13.6 | +3.29 | 81.80 | 0.05 | 15.2 | +2.35 | 57.46 | 0.04 |
| 9/1/98, p.m. | 12.5 | −23.48 | 46.80 | 0.08 | 13.5 | +3.86 | 104.63 | 0.05 | 15.0 | +0.87 | 132.02 | 0.04 |
| 9/23/98, p.m. | 11.75 | −4.16 | 91.70 | 0.05 | 13.5 | −3.04 | 135.83 | 0.04 | 16.0 | +0.91 | 344.30 | 0.02 |
p.m., afternoon; a.m., morning.
At the lower edge of the redoxcline towards the monimolimnion, both positive and negative sulfide turnover rates were observed, showing sulfide production and sulfide consumption rates ranging from −3.04 to +3.86 h−1. On average, the specific bacteriochlorophyll a content was about 10 times smaller than the one at the maximum turbidity, indicating a change from mainly phototrophs to heterotrophic bacteria with increasing depth. In the monimolimnion only positive sulfide turnover rates were calculated, indicating sulfide production also during the day, as essentially no light reaches this depth to drive anoxygenic photosynthesis. Rates ranged from +0.87 to +3.35 h−1. The specific bacteriochlorophyll a contents were similar to the ones at the lower edge of the redoxcline.
Results obtained during the daily cycle for the mixolimnion, the layer of maximum turbidity, and the monimolimnion are given in Table 2. During daytime all experiments in the oxic mixolimnion resulted in a net sulfide consumption (k < 0) due to spontaneous oxidation of sulfide by the oxygen present. Along the oxygen gradient between 8 and 10 m (Fig. 2) the sulfide turnover rates became less negative, as less oxygen was present. Negative rates increased again in the zone of the phototrophic bacteria.
TABLE 2.
Results of different push-pull test experiments in the mixolimnion, at the maximum turbidity in the redoxcline, and in the monimolimnion
| Date (mo/day/yr) and timea | Data for push-pull experiments at:
|
|||||||||||
|---|---|---|---|---|---|---|---|---|---|---|---|---|
| Mixolimnion
|
Maximum turbidity in the redoxcline
|
Monimolimnion
|
||||||||||
| Depth (m) | k (h−1) | Protein level (mg/liter) | Bacteriochlorophyll a level (mg/liter) | Depth (m) | k (h−1) | Protein level (mg/liter) | Bacteriochlorophyll a level (mg/liter) | Depth (m) | k (h−1) | Protein level (mg/liter) | Bacteriochlorophyll a level (mg/liter) | |
| 7/23/98, a.m. | 8.25 | −54.72 | 11.80 | 0.02 | 12.5 | −10.67 | 24.74 | 0.10 | 16 | +2.83 | 50.61 | 0.03 |
| 7/29/98, p.m. | 8.3 | −10.40 | 59.74 | 0.01 | 12.5 | −30.99 | 92.71 | 0.11 | 16 | +2.25 | 97.27 | 0.03 |
| 8/6/98, p.m. | 8.0 | −51.67 | 60.50 | 0.00 | 11.9 | −22.48 | 66.59 | 0.16 | 16 | +3.43 | 233.22 | 0.06 |
| 9/1/98, p.m. | 9.75 | −5.34 | 90.93 | 0.01 | 12.5 | −16.06 | 31.59 | 0.05 | 15 | +2.35 | 74.20 | 0.05 |
| 9/3/98, night | 9.0 | −3.37 | 259.09 | 0.01 | 12.0 | +1.95 | 55.17 | 0.02 | 16.75 | +1.53 | 140.39 | 0.02 |
a.m., morning; p.m., afternoon.
At maximum turbidity in the bacterial layer high rates of sulfide consumption (−30.99 to −10.67 h−1) were measured during the day. Because of the rapid decline of the light intensity within the bacterial layer (7), sulfide turnover rates below the maximum cell density turned rapidly positive, showing a net sulfide production. As expected, in the night, only the oxic mixolimnion gave negative sulfide turnover rates due to chemical sulfide oxidation. In contrast, in the bacterial layer, sulfide turnover rates were positive because sulfide is produced via the dark-adapted metabolism of the phototrophic bacteria (4, 21) as well as by the sulfate reducers.
DISCUSSION
Oxidation and reduction processes of inorganic sulfur compounds in nature are governed by both chemical and biological reactions. Besides the linear reaction sequence from sulfide to sulfate and back, compounds containing more than one sulfur atom are formed under certain conditions. Thiosulfate is used as an electron donor by various purple sulfur bacteria, and traces of thiosulfate are observed in the open water, but also tri-, tetra-, and polythionates may be formed. Thus, oxidation reactions starting from sulfide are diverse and complex and yield different products (18).
Sulfide is spontaneously chemically oxidized with a half-time ranging from 0.4 to 65 h. Millero and Hershey (14) determined a 50-h half-time in fresh water. Salts and increasing pH strongly accelerate the oxidation rate; metal ions, e.g., Ni2+ and Co2+, may increase the rate by a factor of up to 1,000 (1).
To quantify the formation and consumption of sulfide as a key species in anoxic environments, the push-pull technique was successfully adapted for in situ measurements of its turnover in the open water of the meromictic Lake Cadagno. The different processes, reduction to and oxidation of sulfide in the sulfur cycle, take place at different depths of the lake. In the mixolimnion sulfide is absent due to highly oxic conditions (Fig. 2). Sulfide produced in the anoxic part of the lake hardly reaches the oxicline, as a dense layer of mainly phototrophic bacteria acts as a filter for sulfide. The photosynthetic processes often lead to a complete sulfide depletion in the upper part of the bacterial layer. Spontaneous oxidation of sulfide by oxygen may, however, take place at the upper edge of the chemocline during the turnover of the water of the mixolimnion in late autumn. Clouds of dispersed elemental sulfur are often observed at sites closer to the shore where the oxic water reaches the sediment surface (12).
The layer of phototrophic bacteria can be separated into two zones. In the top zone down to the maximum turbidity enough light is available for bacterial photosynthesis (7). This results in high rates of sulfide consumption during the day. During the night sulfide is produced at the same sites in rates similar to the ones in the monimolimnion at greater depth, giving evidence for sulfur respiration and sulfate reduction in the layer dominated by the phototrophs. At the lower edge of the bacterial layer, photosynthesis may still be possible at high solar insolation, although only a small fraction of the incident light penetrates to the lower part of the layer (7). Sulfate reduction and elemental sulfur respiration are here the dominant processes, similar to what is found in the deeper regions of the monimolimnion. Within the bacterial layer the buoyant density of the water has often been found to be nearly constant, indicating that the density gradient is disturbed (see conductivity in Fig. 2) (see the results in references 7, 11, and 12). Calculations indicate that 105 to 106 actively swimming cells per ml may liberate enough energy to destroy the density gradient in the water. Under these conditions bioturbation may occur (16), with the result that the bacterial layer is in constant motion. This allows the bacteria to become transported from lower to higher parts in the bacterial layer and to collect both light and electrons from sulfide.
In this paper turnover rates are given as relative rates with the dimension of inverse hours. It would be of interest to convert these rates into absolute values to normalize them for biomass and sulfide concentration and to be able to compare them with available laboratory data. Our data do not allow us to properly calculate such specific oxidation and reduction rates. First, the actual sulfide concentration varies within the layer and often in the upper part is below the detection limit. Furthermore, although bacteriochlorophyll and total protein concentrations have been determined, the biomasses of the producers and the consumers of sulfide cannot be distinguished from these data. The rates obtained are real in situ rates, which means that they are determined by the actual values of light intensity, sulfide concentration, cell concentration, ratio between phototrophic and nonphototrophic cells, redox potential, temperature, pH, and more. As most of these factors vary in the region of the bacterial layer, such calculations would have large uncertainties. In contrast, it may be possible to convert absolute rates from laboratory experiments into relative ones for the conditions of the experiment. Given the initial rate of sulfide oxidation of a dense culture of Chlorobium at relatively high light intensity, we arrive at a turnover number of about 40 h−1, a value similar to the highest rates obtained in situ (2). It is still unclear what is meant by the turnover rates obtained by the pulse method at sites where the sulfide concentration is below or near the detection limit. Are these the potential rates at conditions when sulfide is not limiting, or are these the actual in situ rates before the pulse? Under light-limiting conditions in the lower part of the bacterial layer an increase in sulfide concentration will probably not change the turnover rate, but in the upper part of the bacterial layer sulfide may really be the rate-limiting parameter. If so, the measured rates are instead maximum rates under sulfide-saturated conditions at the available light intensity.
ACKNOWLEDGMENTS
We thank D. Bollier and H. P. Schmidhauser for technical assistance in the construction of the specific equipment and P. Bosshard and D. Grüter for their help in the field work. We greatly acknowledge M. Schroth for his cooperation in data analyses.
REFERENCES
- 1.Adewuyi Y G. Oxidation of biogenic sulfur compounds in aqueous media. In: Saltzman E S, Cooper W J, editors. Biogenic sulfur in the environment. Washington, D.C.: American Chemical Society; 1989. pp. 529–559. [Google Scholar]
- 2.Brune D C, Gonzalez I. Measurement of photosynthetic sulfide oxidation by Chlorobium using a sulfide ion selective electrode. Plant Cell Physiol. 1982;23:1323–1328. [Google Scholar]
- 3.Clayton R K. Absorption spectra of photosynthetic bacteria and their chlorophylls. In: Gest H, San Pietro A, Vernon L P, editors. Bacterial photosynthesis. Yellow Springs, Ohio: Antioch Press; 1963. pp. 495–500. [Google Scholar]
- 4.de Wit R, Van Gemerden H. Growth and metabolism of the purple sulfur bacterium Thiocapsa roseopersicina under combined light/dark and oxic/anoxic regimes. Arch Microbiol. 1990;154:459–464. [Google Scholar]
- 5.Egli K, Wiggli M, Klug J, Bachofen R. Spatial and temporal dynamics of the cell density in a plume of phototrophic microorganisms in their natural environment. Documenta dell'Istituto Italiano di Idrobiologia. 1998;63:121–126. [Google Scholar]
- 6.Eichler B, Pfennig N. A new purple sulfur bacterium from stratified freshwater lakes. Amoebobacter purpureus sp. nov. Arch Microbiol. 1988;149:395–400. [Google Scholar]
- 7.Fischer C, Wiggli M, Schanz F, Hanselmann K W, Bachofen R. Light environment and synthesis of bacteriochlorophyll by populations of Chromatium okenii under natural environmental conditions. FEMS Microbiol Ecol. 1996;21:1–9. [Google Scholar]
- 8.Gilboa-Garber N. Direct spectrophotometric determination of inorganic sulfide in biological materials and in other complex mixtures. Anal Biochem. 1971;43:129–133. doi: 10.1016/0003-2697(71)90116-3. [DOI] [PubMed] [Google Scholar]
- 9.Haggerty R, Schroth M H, Istok J D. Simplified method of “push-pull” test data analysis for determining in situ reaction rate coefficients. Ground Water. 1998;36:314–324. [Google Scholar]
- 10.Istok J D, Humphrey M D, Schroth M H, Hyman M R, O'Reilly K T. Single-well, “push-pull” test for in situ determination of microbial activities. Ground Water. 1997;35:619–631. [Google Scholar]
- 11.Joss A, Mez K, Känel B, Hanselmann K W, Bachofen R. Measurement of fluorescence kinetics of phototrophic bacteria in the natural environment. J Plant Physiol. 1994;144:333–338. [Google Scholar]
- 12.Lehmann C, Bachofen R. Images of concentrations of dissolved sulphide in the sediment of a lake and implications for internal sulphur cycling. Sedimentology. 1999;46:537–544. [Google Scholar]
- 13.Lowry O H, Rosebrough N J, Farr A L, Randall R J. Protein measurement with the Folin phenol reagent. J Biol Chem. 1951;193:265–275. [PubMed] [Google Scholar]
- 14.Millero F J, Hershey J P. Thermodynamics and kinetics of hydrogen sulfide in natural waters. In: Saltzman E S, Cooper W J, editors. Biogenic sulfur in the environment. Washington, D.C.: American Chemical Society; 1989. pp. 282–313. [Google Scholar]
- 15.Peduzzi, R., R. Bachofen, and M. Tonolla (ed.). 1998. Lake Cadagno: a meromictic alpine lake. Documenta dell'Istituto Italiano di Idrobiologia 63.
- 16.Pfennig N. Beobachtungen über das Schwärmen von Chromatium okenii. Arch Microbiol. 1962;42:90–95. [PubMed] [Google Scholar]
- 17.Schroth M H, Istok J D, Hyman M R, O'Reilly K T. Field-scale measurements of in situ microbial metabolic activities. On-Site Bioremediation. 1997;4:387–392. [Google Scholar]
- 18.Suzuki I. Oxidation of inorganic sulfur compounds: chemical and enzymatic reactions. Can J Microbiol. 1999;45:97–105. [Google Scholar]
- 19.Tomich J F, Dalton R L, Deans H A, Shallenberger L K. Single-well tracer test method to measure residual oil saturation. J Petrol Technol. 1973;25:211–218. [Google Scholar]
- 20.Tonolla M, Demarta A, Peduzzi R, Hahn D. In situ analysis of phototrophic sulfur bacteria in the chemocline of meromictic Lake Cadagno (Switzerland) Appl Environ Microbiol. 1999;65:1325–1330. doi: 10.1128/aem.65.3.1325-1330.1999. [DOI] [PMC free article] [PubMed] [Google Scholar]
- 21.Van Gemerden H. On the ATP generation by Chromatium in darkness. Arch Microbiol. 1968;64:118–124. doi: 10.1007/BF00406970. [DOI] [PubMed] [Google Scholar]