

Abstract
Cardiomyocytes derived from human induced pluripotent stem (iPS) cells enable the study of cardiac physiology and the developmental testing of new therapeutic drugs in a human setting. In parallel, machine learning methods are being applied to biomedical science in unprecedented ways. Machine learning has also been used to distinguish healthy from diseased cardiomyocytes using calcium (Ca2+) transient signals. Most Ca2+ transient signals are obtained via terminal assays that do not permit longitudinal studies, although some recently developed options can circumvent these concerns. Here, we describe the use of machine learning to identify healthy and diseased cardiomyocytes by their contractility profile obtained from brightfield videos. This non-contact, label-free approach allows for continued cultivation of cells after they have been evaluated for use in other assays, and can be readily extended to organs-on-chip. To demonstrate utility, we assessed contractility profiles of cardiomyocytes obtained from patients with Timothy Syndrome (TS), a long QT disease which can lead to fatal arrhythmias, and healthy individuals. The videos were processed and classified using machine learning methods, and their performance was evaluated according to several parameters. The trained algorithms were able to distinguish the TS cardiomyocytes from healthy controls, and to classify two different healthy controls. The proposed computational machine learning evaluation of human iPS cell-cardiomyocytes contractility profiles have the potential to identify other genetic proarrhythmic events, screen therapeutic agents for inducing or suppressing long QT events, and predict drug-target interactions. The same approach could be readily extended to the evaluation of engineered cardiac tissues, within single-tissue and multi-tissue organs-on-chip.
Keywords: Machine learning, human iPS cells, cardiomyocytes, long QT, contractility profile
Graphical Abstract

1. Introduction
Cardiomyocytes derived from human induced pluripotent stem (iPS) cells are finding utility in the discovery of new therapeutic agents and modeling of human diseases in vitro.1 Because human iPS cells, when differentiated, retain the original genotype from the cell donor, they are being increasingly used in studies that go beyond measuring mere cardiac functionality, into the realm of modeling human cardiovascular diseases, such as long QT syndrome, myocarditis, acute ischemia, and further into high-throughput cardiotoxicity screening.2–9
An example of successful recapitulation of human disease in vitro by human iPS cell-derived cardiomyocytes is Timothy Syndrome (TS), a disease characterized by prolonged QT intervals.10 Patients with TS carry a spontaneous autosomal dominant gain-of-function mutation in the CACNA1C gene encoding Cav1.2 channels. Two known effects of this mutation are the slower inactivation of the ion channels, resulting in prolongation of the QT interval, and cardiac arrhythmia that can lead to sudden cardiac death.11 TS patients commonly exhibit bradycardia, an outcome that has been replicated in vitro using iPS cardiomyocytes from affected patients.10
Machine learning, the process of training an algorithm to make predictions or decisions based on experimental data, has been used to process multidimensional datasets in objective and automated fashion, providing the opportunity to store and analyze large datasets quickly, rather than having to manually preselect a limited number of parameters and overlooking potentially valuable information.12 Supervised machine learning is a subtype of machine learning in which a set of data with known classifications is used to train an algorithm by building a statistical model that fits the data. This trained model can then be applied to unknown data to predict their classification and performance.
One of the current challenges in treating cardiac disease and the development of new therapeutic agents is the need for their accurate and fast preclinical detection and screening. By integrating machine learning techniques with current models, preclinical drug screening and disease modeling can be accelerated in an automated, easy-to-use fashion. Machine learning algorithms can accelerate the classification of diseased cells, identify side effects of new cardioactive drugs under development, or evaluate the arrhythmic risk of patient-derived cells or cells exposed to new therapeutic agents.
Machine learning has been only rarely used for data obtained from human iPS cell-derived cardiomyocytes. Some groups have used machine learning techniques to predict the outcome of iPS cell differentiation protocols, while others focused on quality control their cardiomyocytes cultures.13–15 Machine learning has also been used in the development of high-throughput and sensitive drug screening platforms, and as an action potential classifiyer.16, 17 Machine learning algorithms have been trained to identify peaks of calcium (Ca2+) transients in arrhythmogenic cardiomyocytes and action potential of healthy cells exposed to antiarrhythmic drugs.18, 19 One study introduced a method for automated analysis of arrhythmic field potentials of cells exposed to cardioactive drugs, while another study reported a platform paired with machine learning algorithms to detect changes in cardiac functionality after drug exposure.20, 21
Recently, healthy and diseased cardiomyocytes were separated by machine learning algorithms based on analysis of calcium transient signals.22–24 Calcium signaling plays an important role in cardiac functionality, both under healthy and pathological conditions. However, calcium transients are frequently obtained by terminal assays, preventing the use of the evaluated cells in future experiments. Some recently developed options can circumvent these concerns but they are still not used routinely. Data obtained using a non-contact, online, label-free approach would allow classification of the cells without precluding their use in longitudinal studies (where the same cells are analyzed over time), in other assays, and in the screening of therapeutic agents. Machine learning algorithms can be further leveraged with new analysis tools in lieu of calcium signals from single cells. We previously developed a MATLAB script to analyze brightfield videos of beating cardiomyocytes and generate contractility trace that can be used to calculate contractility parameters.25, 26 This approach enabled us to assess contractility profiles without the need to label or dissociate cells, allowing cell labeling for other analysis.
We hypothesize that the contractility profiles obtained from brightfield videos can be used to reliably distinguish healthy and diseased cardiomyocytes. To test this hypothesis, we differentiated cardiomyocytes from three cell lines (two healthy and one from a TS patient). Their contractility traces were extracted from brightfield videos and analyzed using a custom MATLAB script. The calculated contractility parameters served as a data input to several machine learning algorithms that were trained to distinguish the contractile behaviors of diseased and healthy cells. We propose that these algorithms for automated analysis of contractility profiles can be used to detect pathologic phenotypes and evaluate therapeutic agents.
2. Experimental design
We obtained contractility profiles from 20-second long brightfield videos of contracting cardiomyocytes. The contractility parameters calculated from these contractility profiles were used to train and test supervised machine learning algorithms to distinguish cell phenotypes. The trained algorithms were designed for automated, high-throughput, unbiased evaluation of cells. To this end, we differentiated cardiomyocytes from three iPS cell lines: two from healthy donors and one from a TS patient (Fig. 1A). The contractility of differentiated cardiomyocytes was assessed via brightfield videos using a custom MATLAB script we previously developed.25, 26 This script generates a contractility trace and extracts several contractility parameters (Fig. 1B), which were used as input for different algorithms. Several supervised machine learning algorithms were trained and their predictability was assessed from their accuracy in distinguishing healthy and diseased cardiomyocytes (Fig. 1C). From the confusion matrices of each algorithm, we calculated the performance parameters as described below: the true positive rate (TPR) for each cell line being classified, and the accuracy, F1 score, and Matthew correlation coefficient (MCC) of the algorithm trained. Using these four parameters and the receiver operating characteristic (ROC) curve, we were able to assess how accurately each algorithm classified the samples, as detailed in the Experimental Methods section.
Figure 1. Experimental overview.
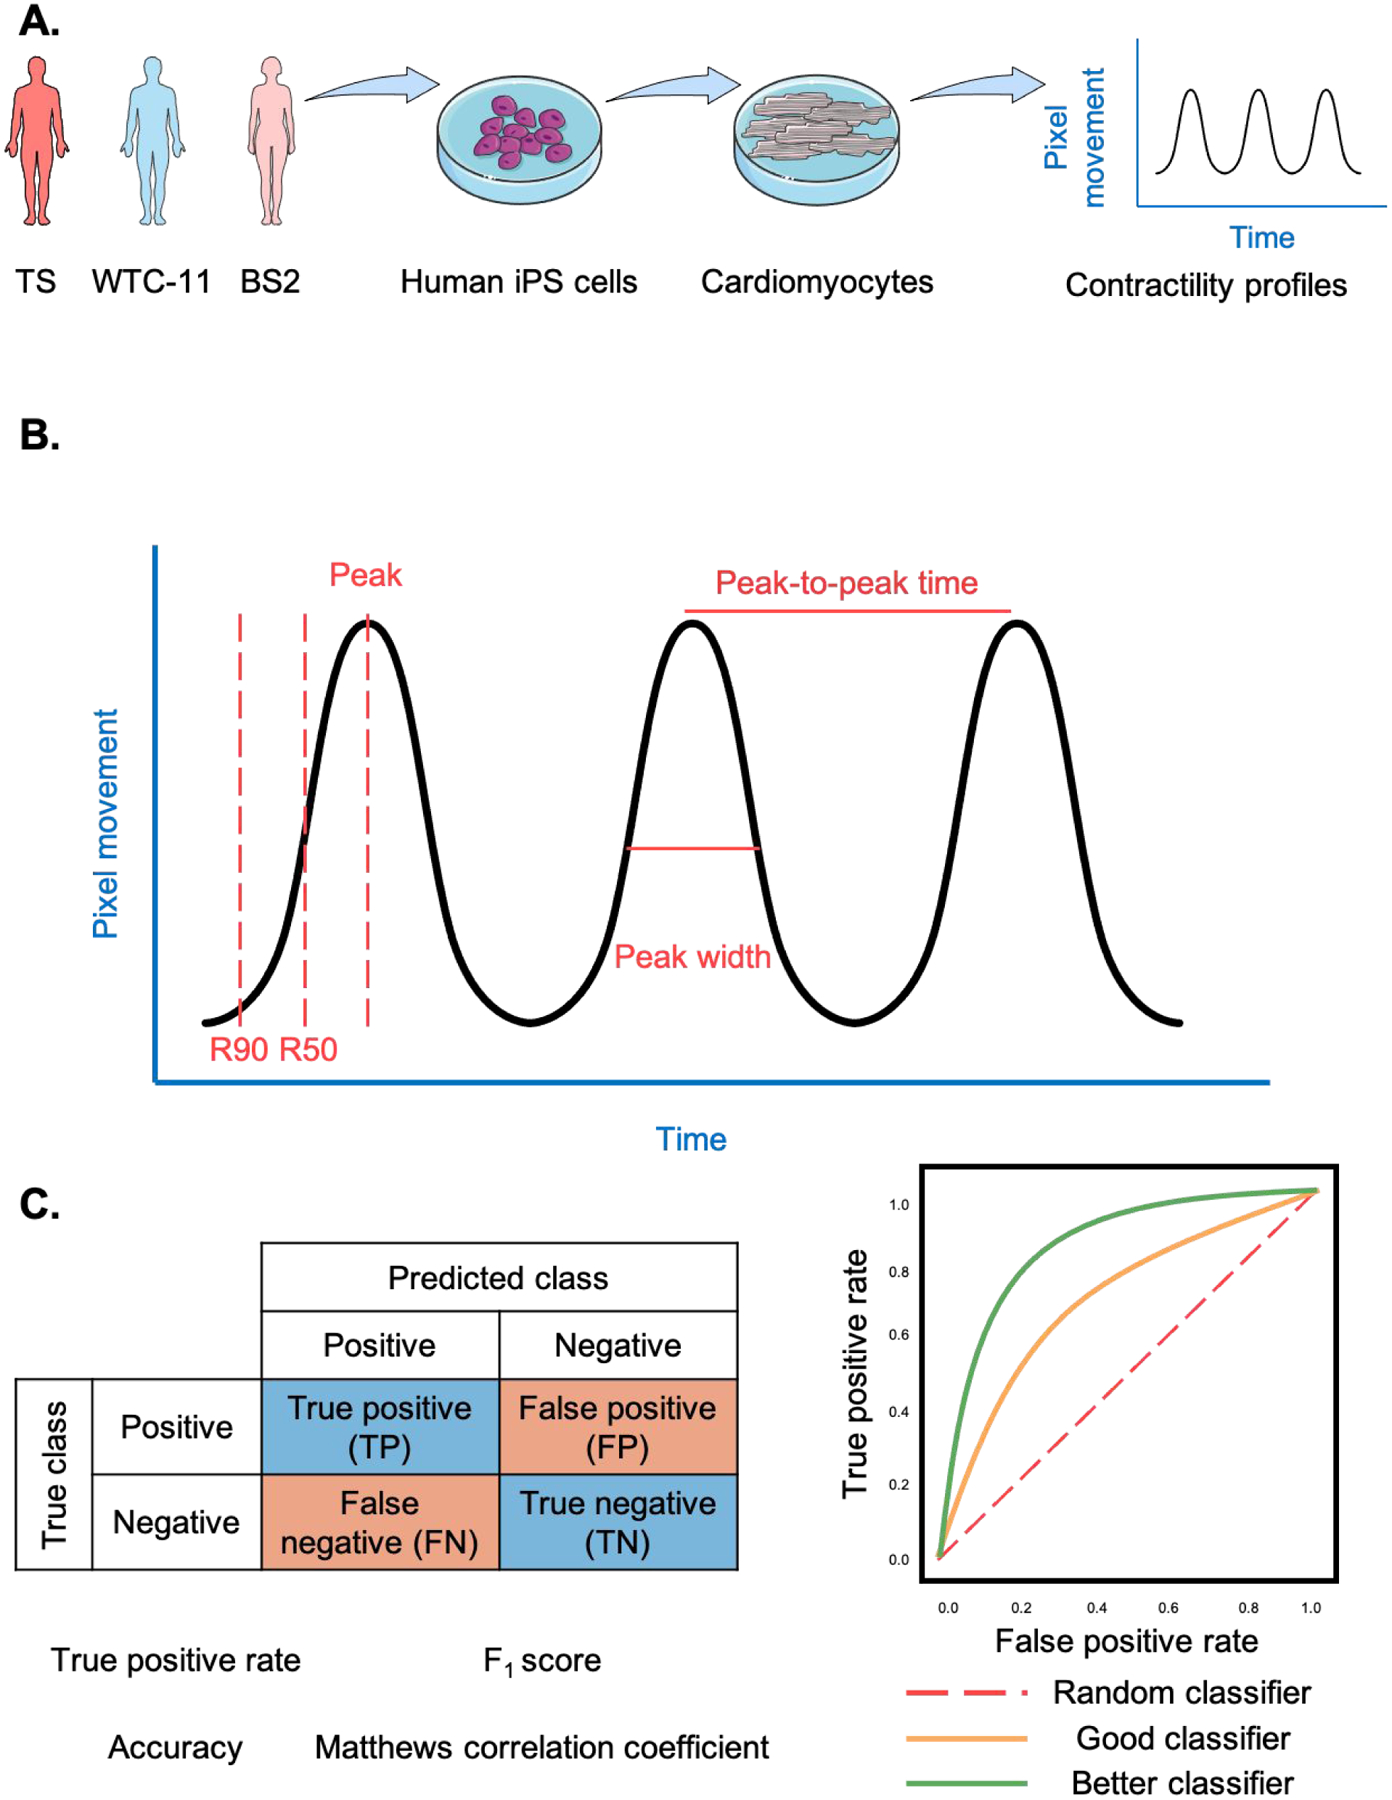
A. Human induced pluripotent stem (iPS) cells were differentiated into cardiomyocytes from 3 different cell lines. After differentiation, their contractile profile was evaluated using brightfield videos. B. Contractility trace obtained from brightfield videos. C. The performance of the algorithms was evaluated using parameters calculated from their confusion matrixes and receiver operating characteristic (ROC) curves.
3. Experimental methods
3.1. Cell culture and cardiomyocyte differentiation
Human iPS cells were obtained through material transfer agreements from B. Conklin, Gladstone Institute (WTC-11, healthy) and M. Yazawa, Columbia University (TS). A third cell line (BS2, healthy) was developed and validated for our research at the Columbia Stem Cell Core Facility. Cells were maintained on 1:60 growth factor reduced Matrigel (Corning) in mTeSR™1 medium (STEMCELL Technologies), supplemented with 1% penicillin/streptomycin, and changed on a daily basis. Cells were passaged at 85–90% confluent using 0.5 mM EDTA (Invitrogen). During the first 24 hours the culture medium was supplemented with 5 mM Y-27632 dihydrochloride (Tocris).
Using a previously established protocol, cardiac differentiation of human iPS cells was initiated in 90% confluent cell monolayers by replacing the mTeSR™1 medium with CDM3, a chemically defined medium with 3 components: RPMI Medium 1640 (1X, Gibco), 500 μg mL−1 of recombinant human albumin (Sigma-Aldrich), and 213 μg mL−1 of L-ascorbic acid 2-phosphate (Sigma-Aldrich), supplemented with 1% penicillin/streptomycin.27 Medium was changed every 48 hours. For the first 48 hours the medium was supplemented with 3 mM of glycogen synthase kinase 3 inhibitor CHIR99021 (Tocris). On day 2, the culture was switched to CDM3 medium supplemented with 2 mM of the Wnt inhibitor Wnt-C59 (Tocris). After day 4 of differentiation, the medium was changed to CDM3 with no supplements. Contracting cells were noted around day 10, when the medium was changed to RPMI 1640 supplemented with B-27™ (50X; Gibco). For this study, we used cardiomyocytes from separate, consecutive differentiations. By pooling the cells together, we reduced the impact of possible variations in cardiac function due to different differentiations and measured the average properties for a specific line of cells.
All cells were maintained at 37°C and 5% CO2 in Heracell 150 incubators (Thermo Fisher Scientific), using 2 ml of medium per 10 cm2 of surface area, and were routinely checked for mycoplasma contamination using a MycoAlert Plus Kit (Lonza). Pluripotent cells were routinely checked for expression of pluripotent markers.
3.2. Contractility profiles
Brightfield videos (20 seconds long, 100 frames per second) were recorded on a Nikon Ti-U inverted microscope using an ANDOR Zyla 5.5 sCMOs camera, and analyzed using the custom MATLAB script we previously developed.25, 26 Specifically, tissue contractility was measured by analyzing the changes in pixel intensity from a reference baseline frame and creating traces of pixel motion over time. Our approach is similar to other groups who developed comparable scripts to evaluate cardiac contractility and behavior using other measurable properties.28–30 Several contractility parameters were derived from these traces (Fig. 1B), as previously described.26 The contractility parameters included beat frequency, peak-to-peak time, and interbeat variability, defined as the standard deviation of the time between peaks. The R90 time to peak was defined as the time between 10% of the contraction and the peak amplitude. R90 time from peak was defined as the time between the peak and 90% of the relaxation. R50 times to and from the peak were defined analogously to R90 times, as the times between 50% of contraction and the peak, and from the peak to 50% of the relaxation. The peak width was defined as the distance from contraction to relaxation at 50% of the peak.
We obtained brightfield recording of macroscopically contracting cardiomyocytes, at days 15 through 36 of differentiation, that sustained synchronously contractions over 20 seconds of the video. Among hundreds of regions that were recorded, we randomly selected the samples from different cell culture plates to analyze for this project. This random selection resulted in a total of 138 videos of iPS cell derived cardiomyocytes from a TS patient, 148 videos of cardiomyocytes from healthy BS2 cells, and 174 videos of cardiomyocytes from healthy WTC-11 cells.
3.3. Supervised machine learning algorithms
Contractile behavior of different cell lines was computed by applying supervised machine learning methods to determine the best classification methods for this purpose. Before classification, the dataset was z-score standardized so that each parameter had a mean of zero and unit variance, ensuring that each parameter was assigned equal importance. The resulting dataset was analyzed separately by various machine learning algorithms, as detailed below.
To visualize the multi-dimensional dataset in a two-dimensional plot, we applied the t-distributed stochastic neighbor embedding (t-SNE) algorithm, an algorithm for dimensionality reduction, allowing the visualization of high-dimensional datasets. We implemented seven different frequently used and investigated distance measures (Chebyshev, City block, Correlation, Cosine, Euclidean, Mahalanobis, and Spearman), with perplexity set at 30.31,32
The k-nearest neighbor (k-NN) algorithm is one of the earliest developed classification algorithms, and it classifies an unlabeled data point based on the points that are closest to it.33–35 Its performance depends mainly on three factors: k value, distance measure, and distance weighing scheme. These factors are data-dependent, and for each dataset a suitable combination must be searched independently. The k value indicates the number of nearest neighbors of a data point to consider when classifying the data point. In this study, we tested odd values of k to avoid ties when classifying the samples. The k-NN algorithm can calculate the distance between the unlabeled data point and the surrounding neighbors using several distance measures. Here, we tested seven different frequently used and investigated distance measures (Chebyshev, City block, Correlation, Cosine, Euclidean, Mahalanobis, Spearman). In this algorithm, we can give different weights to the neighboring datapoints to automatically classify the unlabeled datapoints. We also tested three different distance weighting schemes (equal weights, inverse weighting, squared inverse weighting).
Decision trees are another group of algorithms commonly used in supervised machine learning.36 These algorithms are represented as a sequence of branching statements. They are easy to interpret, low on memory usage, and fast. We varied the number of trees from 1 to 100, with step size of 1. We also tested quadratic discriminant analysis-based algorithms.37, 38
Naïve Bayes classifiers are a class of probability-based algorithms.34, 39 We tested this class with four different types of kernel density estimation (normal, box, Epanechnikov, and triangle). We also used Support Vector Machine (SVM) algorithms.40 These are a class of methods commonly used and their performance is dependent on the selection of a kernel function and parameter values. We tested different box constraint (C) values with each kernel function (quadratic, cubic, and RBF) to ensure the best possible result.
We trained and tested every algorithm using a 5-fold cross validation process. Briefly, the data was randomly split into five equal sized subsets. Of these five, one was retained as the testing set and the remaining four were used as the training set. This cross-validation process was repeated four times, with each of the five subsets used once as the testing set. The results of the five rounds were then averaged to produce a single result. In each cross-validation process, 110 TS, 118 BS2, or 139 WTC-11 samples were used for training, while 28 TS, 30 BS2, or 35 WTC-11 samples were used for testing.
After testing each algorithm, its performance was described in a confusion matrix and ROC curve (Fig. 1C). A confusion matrix is a table often used to describe the performance of a supervised algorithm, summarizing how successful are the algorithm’s predictions.41 It has two dimensions, one indexed by the true class of the sample and the other by the class predicted by the algorithm. A true positive (TP) is when the algorithm correctly predicted its classification, while a false positive (FP) is when the algorithm mistakenly misclassified the sample.
Several performance metrics were defined based on the confusion matrixes: TPR, accuracy, F1 score, and MCC. These metrics can evaluate the performance of an algorithm as follows. TPR, also known as recall, is the probability that a cell line will be properly classified. It is calculated using Equation (1). Accuracy, which is defined as the fraction of predictions the algorithms got right, is calculated using Equation (2). The F1 score, the harmonic mean of precision and recall, is defined by Equation (3). MCC is a measure of the quality of binary classifications and is calculated from Equation (4).
| (1) |
| (2) |
| (3) |
| (4) |
A ROC curve presents the performance of the classification algorithm at all classification thresholds, plotting the true positive rate and false positive rate (Fig.1D). The area under the ROC curve (AUC) is the probability that the algorithm ranks a random positive sample (TS) more highly than a random negative sample (WTC-11 or BS2). AUC ranges from 0 to 1, and an algorithm whose predictions are 100% correct has an AUC of 1.0.
3.4. Statistical analysis
Data were analyzed and graphed in Excel (Microsoft), Prism (GraphPad), and MATLAB (MathWorks). Data are presented as mean + standard deviation. Differences between experimental groups were analyzed by Kruskal-Wallis test, followed by Dunn’s multiple comparisons test. Significant differences defined by P < 0.05 (*), P < 0.01 (**), P < 0.001 (***), and P < 0.0001 (****).
4. Results
The goal of this project was to determine if healthy and diseased cardiomyocytes could be classified independently using their contractility profiles. To this end, we tested several supervised learning algorithms as described above.
The means and standard deviations of all eight parameters show clear differences among the three cell lines, which indicate a favorable classification between the different groups (Table 1, Fig. 2). By implementing the t-SNE algorithm and applying several distance measures, we were able to reduce the dimensions of our dataset and visualize it in a two-dimension plot (Figure S1).
Table 1.
Means and standard deviations of the eight parameters obtained from the contractility traces.
| Contractility parameters | WTC-11 | BS2 | TS |
|---|---|---|---|
| Beat frequency (bpm) | 54.57 ± 19.69 | 52.17 ± 19.34 | 31.10 ± 18.51 |
| Peak to peak time (s) | 1.206 ± 0.305 | 1.425 ± 0.784 | 2.809 ± 1.647 |
| Interbeat variability (s) | 0.0356 ± 0.0884 | 0.1070 ± 0.1721 | 0.4905 ± 0.7116 |
| R90 time to peak (s) | 0.2424 ± 0.1394 | 0.3116 ± 0.2018 | 0.4030 ± 0.3473 |
| R50 time to peak (s) | 0.1081 ± 0.0961 | 0.1977 ± 0.1718 | 0.2857 ± 0.2682 |
| R90 time from peak (s) | 0.2247 ± 0.1204 | 0.3193 ± 0.1879 | 0.4975 ± 0.4382 |
| R50 time from peak (s) | 0.0955 ± 0.0700 | 0.1788 ± 0.1507 | 0.3113 ± 0.3138 |
| Peak width (s) | 0.1900 ± 0.1389 | 0.3393 ± 0.2330 | 0.4851 ± 0.3472 |
Figure 2. Contractility parameters.
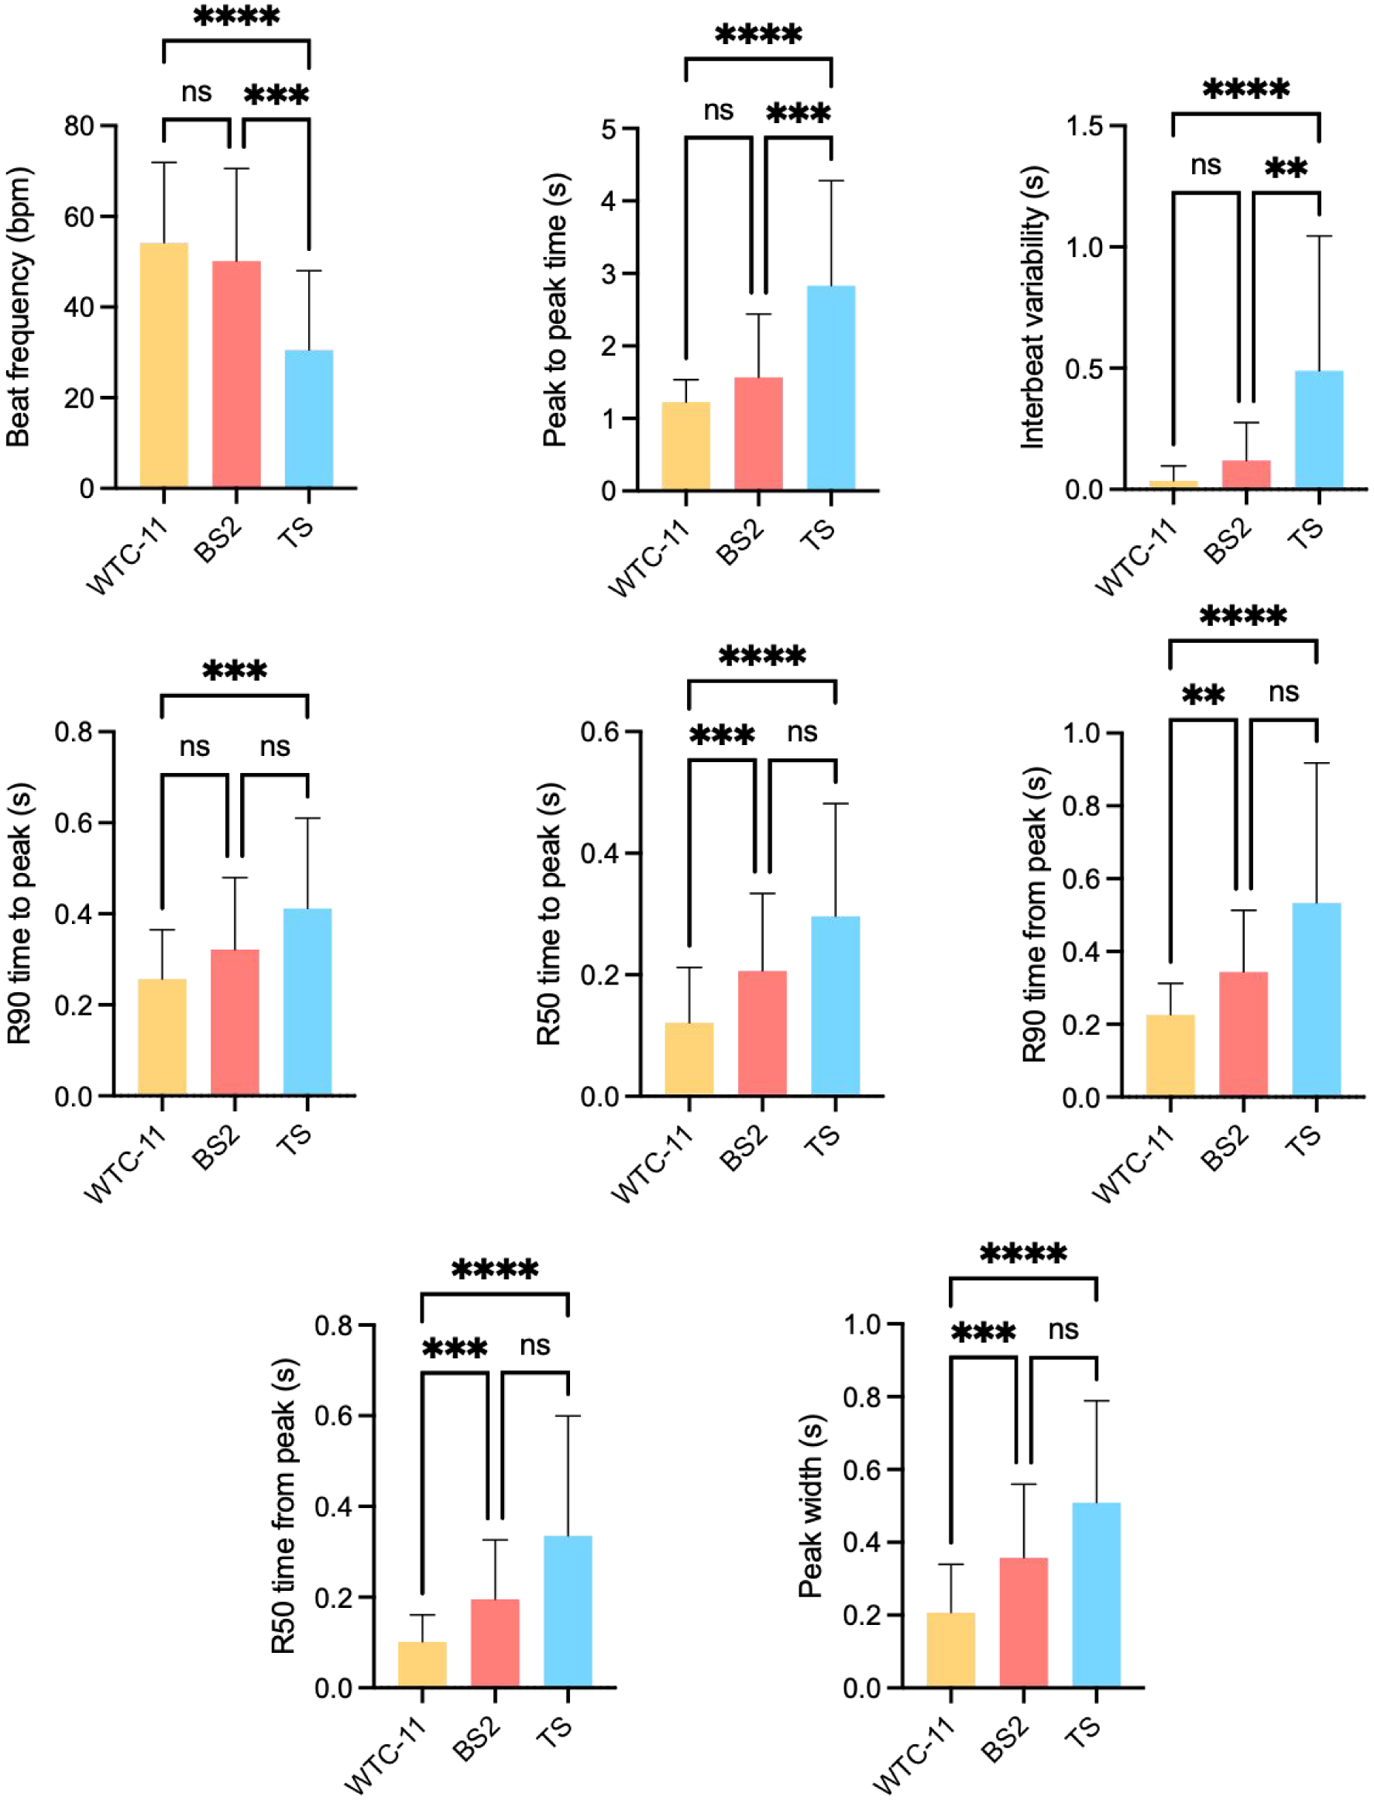
The eight parameters were calculated from the contractility traces of cardiomyocytes differentiated from three human iPS cells. Data presented as mean + standard deviation. Differences between experimental groups were analyzed by Kruskal-Wallis test, followed by Dunn’s multiple comparisons test. Significant differences defined by P < 0.05 (*), P < 0.01 (**), P < 0.001 (***), and P < 0.0001 (****).
The algorithms with the best performance when distinguishing WTC-11 and TS cardiomyocytes were quadratic discriminant analysis and decision trees, both with 92% accuracy (Table 2). These two algorithms had an AUC of 0.96 (Fig. 3A). High performance was also obtained using k-NN (Mahalanobis metric and squared inverse weighting, k = 3; 91% accuracy) and SVM with cubic kernel (C = 0.22859; 91% accuracy) (Tables 2). Other algorithms are listed in Table S1. Overall, the classification between WTC-11 and TS was very successful based on accuracy, F1 score, and the MCC of the algorithms.
Table 2. Classification of WTC-11 and TS cells.
Results of algorithms with the best performance.
| TPR WTC-11 (%) | TPR TS (%) | Accuracy (%) | F1 score (%) | MCC (%) | |
|---|---|---|---|---|---|
| Decision trees | 93 | 91 | 92 | 91 | 85 |
| Quadratic discriminant analysis | 98 | 84 | 92 | 90 | 84 |
| SVM with cubic kernel, C = 0.22859 | 94 | 87 | 91 | 90 | 83 |
| k-NN with Mahalanobis metric and squared inverse weighting, k = 3 | 94 | 87 | 91 | 89 | 82 |
| SVM with quadratic kernel, C = 998 | 92 | 87 | 90 | 88 | 80 |
| k-NN with Mahalanobis metric and equal weighting, k = 1 | 91 | 87 | 89 | 88 | 79 |
| k-NN with Mahalanobis metric and inverse weighting, k = 5 | 90 | 88 | 89 | 88 | 79 |
| Naïve Bayes with box kernel | 88 | 81 | 85 | 83 | 72 |
Figure 3. ROC curves of the algorithms with the greater AUC.

A. Classification of WTC-11 and TS. B. Classification of BS2 and TS. C. Classification of BS2 and WTC-11.
When distinguishing BS2 and TS cardiomyocytes, the best performing algorithms were the decision trees (88% accuracy) and SVM with cubic kernel (C = 18; 87% accuracy) (Table 3). These algorithms showed AUC of 0.90 and 0.91 (Fig. 3B). Other algorithms are listed in Table S2. The classification between BS2 and TS was not as successful as between WTC-11 and TS.
Table 3. Classification of BS2 and TS cells.
Results of algorithms with the best performances.
| TPR BS2 (%) | TPR TS (%) | Accuracy (%) | F1 score (%) | MCC (%) | |
|---|---|---|---|---|---|
| Decision trees | 91 | 85 | 88 | 88 | 77 |
| SVM with cubic kernel, C = 18 | 87 | 88 | 87 | 88 | 76 |
After successfully distinguishing healthy and control cardiomyocytes, we tested if the same algorithms could be used to distinguish the two healthy controls from different donors. The algorithms with best performance when distinguishing the healthy WTC-11 and BS2 derived cardiomyocytes were decision trees, Naïve Bayes with normal kernel, and SVM with quadratic and cubic kernel, all with accuracies above 90% (Table 4). Decision trees and SVM with quadratic kernel yielded the highest AUC (0.95 and 0.93, respectively, Fig. 3C). Other algorithms are listed in Table S3. Overall, the classification between the two healthy controls was also very successful when taking into consideration the four performance parameters and AUC of each algorithm.
Table 4. Classification of BS2 and WTC-11 cells.
Results of algorithms with the best performances.
| TPR BS2 (%) | TPR WTC-11 (%) | Accuracy (%) | F1 score (%) | MCC (%) | |
|---|---|---|---|---|---|
| Decision trees | 94 | 98 | 96 | 96 | 92 |
| Naïve Bayes with normal kernel | 93 | 94 | 93 | 93 | 87 |
| SVM with cubic kernel, C = 27 | 91 | 95 | 93 | 92 | 86 |
| SVM with quadratic kernel, C = 27 | 89 | 94 | 92 | 91 | 84 |
| k-NN with Mahalanobis metric and equal weighting, k = 1 | 91 | 88 | 89 | 88 | 79 |
| k-NN with Mahalanobis metric and inverse weighting, k = 1 | 91 | 88 | 89 | 88 | 79 |
| k-NN with Mahalanobis metric and squared inverse weighting, k = 1 | 91 | 88 | 89 | 88 | 79 |
| SVM with RBF kernel, C = 999 | 78 | 95 | 88 | 85 | 76 |
| Naïve Bayes with triangle kernel | 75 | 97 | 87 | 84 | 75 |
| Quadratic discriminant analysis | 79 | 93 | 87 | 84 | 75 |
| k-NN with Cosine metric and squared inverse weighting, k = 5 | 86 | 87 | 87 | 86 | 75 |
| k-NN with Cosine metric and equal weighting, k = 1 | 87 | 86 | 86 | 85 | 74 |
| k-NN with Cosine metric and inverse weighting, k = 1 | 87 | 86 | 86 | 85 | 74 |
| Naïve Bayes with Epanechnikov kernel | 72 | 97 | 86 | 82 | 73 |
| Naïve Bayes with box kernel | 70 | 98 | 85 | 81 | 72 |
| k-NN with City block metric and equal weighting, k = 1 | 85 | 85 | 85 | 84 | 72 |
| k-NN with City block metric and inverse weighting, k = 1 | 85 | 85 | 85 | 84 | 72 |
| k-NN with City block metric and squared inverse weighting, k = 1 | 85 | 85 | 85 | 84 | 72 |
5. Discussion
Machine learning algorithms were first developed decades ago, but they became highly useful in biomedical engineering only recently with their integration in studies with human iPS cells-derived cardiomyocytes. Tissue engineering studies generate multidimensional datasets which require automated, unbiased, and comprehensive analysis. Machine learning enables complete utilization of all relevant information while handling datasets of considerable size. A recent study has generated a multiclass drug model that accurately classified a set of new compounds, while another group has shown the possibility of classifying genetic cardiac diseases by calcium transient signals recorded from cardiomyocytes using supervised machine learning algorithms.16, 22–24 These studies used fluorescent calcium dyes which can interfere with the functionality of cardiomyocytes, are toxic, require UV light which is also harmful to cells, and do not permit long-term recordings because of their low temporal resolution.42 The fluorescent dyes have a high affinity for Ca2+ and can artificially prolong calcium transients and confuse interpretation of measured data.43 These potential interferences should be considered when calcium signaling is used to evaluate cell functionality and phenotype. Genetically encoded indicators of calcium signaling developed in recent years can circumvent some of the issues with calcium dyes, while they still can affect the folding and functioning of cellular proteins.44, 45
In the present study, the contractility profiles were obtained using label-free brightfield videos. We report the use of supervised machine learning to analyze multidimensional data for cell contractility in an automated manner. The input data consisted of more than 450 total samples from three different cell lines (two healthy and one diseased). According to TPR, we observed TS samples were more difficult to classify than both healthy samples. A probable cause is that the healthy groups had more datapoints than the TS group. Performance results were exceptionally good for decision trees, quadratic discriminant analysis and SVM algorithms, in both classification scenarios. We also observed good performance by the k-NN algorithm with Mahalanobis distance metric when classifying WTC-11 and TS. These results indicate the possibility of discriminating between genetic cardiac diseases using contractility profiles obtained from brightfield contractility videos and supervised learning algorithms. We demonstrate a proof of principle that cardiomyocytes can be properly classified based on noninvasive measurements of their contractile profiles.
Even though the models had already demonstrated good predictability for analyzing the long QT syndrome, their predictive power should be tested for other cardiac diseases. Future work will need to focus on improving the predictive and discovery power of the trained algorithms to classify cardiac pathologies. In addition, datasets from more healthy donors should be used to further optimize the algorithms and classification. For this reason, we tested if the same algorithms used to distinguish healthy and diseased groups could also distinguish the two healthy groups. According to TPR, we observed WTC-11 samples were more easily correctly classified than BS2 samples. The algorithms with the best performance when classifying WTC-11 and BS2 were decision trees, support vector machines, k-NN, and Naïve Bayes with different Kernels. Adding larger numbers of diverse groups of cells from healthy donors with diverse backgrounds (sex, ethnicity, race) in future studies will probe the ability of machine learning algorithms to properly classify different cell phenotypes without misclassifications or assuming diverse healthy variations to be caused by a specific disease or drug.
While the performance parameters indicate that these models provide proper classification, they also point at opportunities for reducing errors and obtaining performance scores closer to 100%. These classification models could be further improved by the addition of brightfield videos from studies in which healthy cardiomyocytes are exposed to drugs with known side effects. These studies would join work from other groups in the identification of a drug’s arrhythmic risk, and the models would help classify new therapeutic agents with higher arrhythmic risk in preclinical models.16–20 Machine learning can also be readily applied with other non-invasive techniques (supernatant analysis) to glean more information about a disease, improve classification of different groups, or to test the efficacy and safety of different drugs. These measurements could help the development of new therapeutic agents, as they would indicate cardiac toxicity prior to other preclinical and clinical testing.
Another way to extend the power of machine learning is to pursue more varied approaches. In this study, we only tested supervised learning methods. Deep learning methods have received a lot of attention and can be used for similar applications, but these methods require large training sets to form a reliable and predictive model. Contractility videos, frozen frames, and electrophysiological parameters obtained with microelectrode array or patch clamp could also be added to the training sets to increase the predictability of the algorithms. Future studies should also explore the optimal duration of brightfield videos for cell classification, analyze if shorter or longer recordings can alter the algorithms’ performance, and determine the optimal duration.
As different types of data are obtained, it might be critical to include the weight of the different variables into the training of the models. Feature selection is a method for selecting a subset of variables that increases the predictive power in the trained models. With this selection, models could be trained with an optimal subset of variables improving their performance, and providing faster predictions and a better understanding of the entire process. This selection can prevent overfitting, reduce the model size, and improve interpretability.
An important factor in training machine learning algorithms is the size of the dataset. In our study, we were limited by the size of the TS group. With limited datasets, it is difficult to generate different and sufficient large subsets for training and testing. Cross-validation, as we did in our study, allows the training and testing of algorithms with confidence using smaller datasets. As we collect more samples and increase the size of our dataset in future experiments, we should be able to use fully separate samples for training and testing of the algorithms. On the other end, training models on datasets larger than the one used in this study are computationally demanding so it is desirable to develop efficient methodology to estimate the dataset size requirement when developing a model for a given task. Some groups have developed statistical methodology based on fitting inverse power law models to construct empirical learning curves, estimating dataset size requirements for different classification algorithms.46,47 Studies with 2D cultures on how algorithm performance scales with dataset size could inform what is the minimal sample size for using a specific algorithm for a specific application, assigning resources to the most promising options and freeing them to explore other options. Future studies of 2D samples would inform how to develop robust models by estimating through efficient progressive sampling the amount of data required to develop an accurate model.
This study demonstrates the potential of machine learning for the classification of diseased human iPS cells-derived cardiomyocytes. We believe that our approach can be readily applied to other cardiac diseases to more fully utilize datasets for enhancing the evidence-based decision-making in disease modeling and drug development, by allowing analysis of multidimensional datasets in an objective, sensitive, automated, and user-independent fashion. This method could be used in diagnosing genetic cardiac diseases and evaluating risks of arrhythmia. Application of machine learning to organs-on-chip preclinical models could accelerate and improve disease modeling and drug development, as data collected in complex systems like 3D tissues or multi-organ systems under various experimental conditions could also be analyzed with machine learning algorithms.
6. Conclusion
In summary, we present the implementation of supervised machine learning on contractility profiles from human iPS cells-derived cardiomyocytes. In an automated fashion, we were able to classify iPS cardiomyocytes differentiated from two healthy and one diseased iPS cell lines. This approach could be adapted to adult-like tissue-engineered cardiac models to interpret diverse output data of in vitro complex systems.
An advantage of this approach is that it is using brightfield videos of unlabeled cardiomyocytes derived from iPS cells from healthy donors and from patients with TS, a long QT syndrome. Using parameters obtained from contractility traces as input data, we showed that several supervised machine learning algorithms successfully classified the healthy and diseased cardiomyocytes. These algorithms also successfully classified the healthy cardiomyocytes from two different donors. In ongoing studies, we aim to further test and improve these recognition and classification capabilities and extend them to analysis of contractility profiles for other cardiac diseases and cardioactive drugs. Computational machine learning algorithms could become an automated, high-throughput and high complexity screening tool in studies of cardiac contractility.
Supplementary Material
Funding sources
This study was supported by the NIH (grants UH3 EB025765, P41 EB027062, and R01 HL076485 to G.V.N.), NSF (grant 16478 to G.V.N.), and FCT (grant PD/BD/105819/2014 to D.T.). The content is solely the responsibility of the authors and does not necessarily represent the official views of the funding sources.
Abbreviations
- AUC
area under the ROC curve
- C
box constraint
- Ca2+
calcium
- CDM3
chemically defined medium with 3 components
- FN
false negative
- FP
false positive
- iPS
induced pluripotent stem
- k-NN
k-nearest neighbor
- MCC
Matthew correlation coefficient
- RBF
radial basis function
- ROC
receiver operating characteristic
- SVM
support vector machine
- TN
true negative
- TP
true positive
- TPR
true positive rate
- TS
Timothy Syndrome
- t-SNE
t-distributed stochastic neighbor embedding
Footnotes
Supporting Information
Dataset visualization by t-SNE algorithm, and classification algorithms of WTC-11, BS2, and TS cardiomyocytes.
Competing interests
The authors declare no competing interests.
References
- 1.Yoshida Y; Yamanaka S Induced pluripotent stem cells 10 years later: for cardiac applications. Circ Res 2017, 120, 1958–1968, DOI: 10.1161/CIRCRESAHA.117.311080. [DOI] [PubMed] [Google Scholar]
- 2.Judge LM; Perez-Bermejo JA; Truong A; Ribeiro AJ; Yoo JC; Jensen CL; Mandegar MA; Huebsch N; Kaake RM, So PL; Srivastava D; Pruitt BL; Krogan NJ; Conklin BR A BAG3 chaperone complex maintains cardiomyocyte function during proteotoxic stress. JCI Insight 2017, 2, e94623. DOI: 10.1172/jci.insight.94623. [DOI] [PMC free article] [PubMed] [Google Scholar]
- 3.Perez-Bermejo JA; Kang S; Rockwood SJ; Simoneau CR; Joy DA; Silva AC; Ramadoss GN; Flanigan WR; Fozouni P; Li H; Chen PY; Nakamura K; Whitman JD; Hanson PJ; McManus BM; Ott M; Conklin BR; McDevitt TC SARS-CoV-2 infection of human iPSC-derived cardiac cells reflects cytopathic features in hearts of patients with COVID-19. Sci. Transl. Med 2021, eabf7872. DOI: 10.1126/scitranslmed.abf7872. [DOI] [PMC free article] [PubMed] [Google Scholar]
- 4.Rhee JW; Yi H; Thomas D; Lam CK; Belbachir N; Tian L; Qin X; Malisa J; Lau E; Paik DT; Kim Y; Choi BS; Sayed N; Sallam K; Liao R; Wu JC Modeling secondary iron overload cardiomyopathy with human induced pluripotent stem cell-derived cardiomyocytes. Cell. Rep 2020, 32, 107886. DOI: 10.1016/j.celrep.2020.107886. [DOI] [PMC free article] [PubMed] [Google Scholar]
- 5.Burridge PW; Li YF; Matsa E; Wu H; Ong SG; Sharma A; Holmström A; Chang AC; Coronado MJ; Ebert AD; Knowles JW; Telli ML; Witteles RM; Blau HM; Bernstein D; Altman RB; Wu JC Human induced pluripotent stem cell-derived cardiomyocytes recapitulate the predilection of breast cancer patients to doxorubicin-induced cardiotoxicity. Nat. Med 2016, 22, 547–56. DOI: 10.1038/nm.4087. [DOI] [PMC free article] [PubMed] [Google Scholar]
- 6.Spencer CI; Baba S; Nakamura K; Hua EA; Sears MA; Fu CC; Zhang J; Balijepalli S; Tomoda K; Hayashi Y; Lizarraga P; Wojciak J; Scheinman MM; Aalto-Setälä K; Makielski JC; January CT; Healy KE; Kamp TJ; Yamanaka S; Conklin BR Calcium transients closely reflect prolonged action potentials in iPSC models of inherited cardiac arrhythmia. Stem Cell Reports 2014, 3, 269–81. DOI: 10.1016/j.stemcr.2014.06.003. [DOI] [PMC free article] [PubMed] [Google Scholar]
- 7.Wong AO; Wong G; Shen M; Chow MZ; Tse WW; Gurung B; Mak SY; Lieu DK; Costa KD; Chan CW; Martelli A; Nabhan JF; Li RA Correlation between frataxin expression and contractility revealed by in vitro Friedreich’s ataxia cardiac tissue models engineered from human pluripotent stem cells. Stem Cell Res. Ther 2019, 10, 203. DOI: 10.1186/s13287-019-1305-y. [DOI] [PMC free article] [PubMed] [Google Scholar]
- 8.Birket MJ; Ribeiro MC; Kosmidis G; Ward D; Leitoguinho AR; van de Pol V; Dambrot C; Devalla HD; Davis RP; Mastroberardino PG; Atsma DE; Passier R; Mummery CL Contractile defect caused by mutation in MYBPC3 revealed under conditions optimized for human PSC-cardiomyocyte function. Cell Rep 2015, 13, 733–745. DOI: 10.1016/j.celrep.2015.09.025. [DOI] [PMC free article] [PubMed] [Google Scholar]
- 9.Sharma A; Burridge PW; McKeithan WL; Serrano R; Shukla P; Sayed N; Churko JM; Kitani T; Wu H; Holmström A; Matsa E; Zhang Y; Kumar A; Fan AC; Del Álamo JC; Wu SM; Moslehi JJ; Mercola M; Wu JC High-throughput screening of tyrosine kinase inhibitor cardiotoxicity with human induced pluripotent stem cells. Sci. Transl. Med 2017, 9, eaaf2584. DOI: 10.1126/scitranslmed.aaf2584. [DOI] [PMC free article] [PubMed] [Google Scholar]
- 10.Yazawa M; Hsueh B; Jia X; Pasca AM; Bernstein JA; Hallmayer J; Dolmetsch RE Using induced pluripotent stem cells to investigate cardiac phenotypes in Timothy syndrome. Nature, 2011, 471, 230–234, DOI: 10.1038/nature09855. [DOI] [PMC free article] [PubMed] [Google Scholar]
- 11.Splawski I; Timothy KW; Sharpe LM; Decher N; Kumar P; Bloise R; Napolitano C; Schwartz PJ; Joseph RM; Condouris K; Tager-Flusberg H; Priori SG; Sanguinetti MC; Keating MT Ca(V)1.2 calcium channel dysfunction causes a multisystem disorder including arrhythmia and autism. Cell 2004, 119, 19–31. DOI: 10.1016/j.cell.2004.09.011. [DOI] [PubMed] [Google Scholar]
- 12.Machine Learning, 1st ed.; Mitchell TT; McGraw-Hill Education, 1997. [Google Scholar]
- 13.Williams B; Löbel W; Finklea F; Halloin C; Ritzenhoff K; Manstein F; Mohammadi S; Hashemi M; Zweigerdt R; Lipke E; Cremaschi S Prediction of human induced pluripotent stem cell cardiac differentiation outcome by multifactorial process modeling. Front. Bioeng. Biotechnol 2020, 8, 851. DOI: 10.3389/fbioe.2020.00851. [DOI] [PMC free article] [PubMed] [Google Scholar]
- 14.Orita K; Sawada K; Koyama R; Ikegaya Y Deep learning-based quality control of cultured human-induced pluripotent stem cell-derived cardiomyocytes. J. Pharmacol. Sci 2019, 140, 313–316. DOI: 10.1016/j.jphs.2019.04.008. [DOI] [PubMed] [Google Scholar]
- 15.Orita K; Sawada K; Matsumoto N; Ikegaya Y Machine-learning-based quality control of contractility of cultured human-induced pluripotent stem-cell-derived cardiomyocytes. Biochem. Biophys. Res. Commun 2020, 526, 751–755. DOI: 10.1016/j.bbrc.2020.03.141. [DOI] [PubMed] [Google Scholar]
- 16.Lee EK; Tran DD; Keung W; Chan P; Wong G; Chan CW; Costa KD; Li RA; Khine M Machine learning of human pluripotent stem cell-derived engineered cardiac tissue contractility for automated drug classification. Stem Cell Reports 2017, 9, 1560–1572. DOI: 10.1016/j.stemcr.2017.09.008. [DOI] [PMC free article] [PubMed] [Google Scholar]
- 17.Zhu R; Millrod MA; Zambidis ET; Tung L Variability of action potentials within and among cardiac cell clusters derived from human embryonic stem cells. Sci. Rep 2016, 6, 18544. DOI: 10.1038/srep18544. [DOI] [PMC free article] [PubMed] [Google Scholar]
- 18.Juhola M; Penttinen K; Joutsijoki H; Aalto-Setälä K Analysis of drug effects on iPSC cardiomyocytes with machine learning. Ann. Biomed. Eng 2021, 49, 129–138. DOI: 10.1007/s10439-020-02521-0. [DOI] [PMC free article] [PubMed] [Google Scholar]
- 19.Heylman C; Datta R; Sobrino A; George S; Gratton E Supervised machine learning for classification of the electrophysiological effects of chronotropic drugs on human induced pluripotent stem cell-derived cardiomyocytes. PLoS One 2015, 10, e0144572. DOI: 10.1371/journal.pone.0144572. [DOI] [PMC free article] [PubMed] [Google Scholar]
- 20.Golgooni Z; Mirsadegho S; Baghshah MS; Ataee P; Baharvand H; Pahlavan S; Rabiee HR Deep learning-based proaarhythmia analysis using field potentials recorded from human pluripotent stem cells derived cardiomyocytes. IEEE J. Transl. Eng. Health Med 2019, 7, 1900203. DOI: 10.1109/JTEHM.2019.2907945. [DOI] [Google Scholar]
- 21.Lee EK; Kurokawa YK; Tu R; Geroge SC; Khine M Machine learning plus optical flow: a simple and sensitive method to detect cardioactive drugs. Sci. Rep 2015, 5, 11817. DOI: 10.1038/srep11817. [DOI] [PMC free article] [PubMed] [Google Scholar]
- 22.Juhola M, Joutsijoki H, Penttinen K, Aalto-Setälä K. Detection of genetic cardiac diseases by Ca2+ transient profiles using machine learning methods. Sci. Rep 2018, 8, 9355. DOI: 10.1038/s41598-018-27695-5. [DOI] [PMC free article] [PubMed] [Google Scholar]
- 23.Joutsijoki H; Penttinen K; Juhola M; Aalto-Setälä K Separation of HCM and LQT cardiac diseases with machine learning of Ca2+ transient profiles. Methods Inf. Med 2019, 58, 167–178. DOI: 10.1055/s-0040-1701484. [DOI] [PubMed] [Google Scholar]
- 24.Hwang H; Liu R; Maxwell JT; Yang J; Xu C Machine learning identifies abnormal Ca2+ transients in human induced pluripotent stem cell-derived cardiomyocytes. Sci. Rep 2020, 10, 16977. DOI: 10.1038/s41598-020-73801-x. [DOI] [PMC free article] [PubMed] [Google Scholar]
- 25.Ronaldson-Bouchard K; Ma SP; Yeager K; Chen T; Song L; Sirabella D; Morikawa K; Teles D; Yazawa M; Vunjak-Novakovic G Advanced maturation of human cardiac tissue grown from pluripotent stem cells. Nature 2018, 556, 239–243. DOI: 10.1038/s41586-018-0016-3. [DOI] [PMC free article] [PubMed] [Google Scholar]
- 26.Ronaldson-Bouchard K; Yeager K; Teles D; Chen T; Ma S; Song L; Morikawa K; Wobma HM; Vasciaveo A; Ruiz EC; Yazawa M; Vunjak-Novakovic G Engineering of human cardiac muscle electromechanically matured to an adult-like phenotype. Nat. Protoc 2019, 14, 2781–2817. DOI: 10.1038/s41596-019-0189-8. [DOI] [PMC free article] [PubMed] [Google Scholar]
- 27.Burridge PW; Matsa E; Shukla P; Lin ZC; Churko JM; Ebert AD; Lan F; Diecke S; Huber B; Mordwinkin NM; Plews JR; Abilez OJ; Cui B; Gold JD; Wu JC Chemically defined generation of human cardiomyocytes. Nat. Methods 2014, 11, 855–860. DOI: 10.1038/nmeth.2999. [DOI] [PMC free article] [PubMed] [Google Scholar]
- 28.Sala L; van Meer BJ; Tertoolen LGJ; Bakkers J; Bellin M; Davis RP; Denning C; Dieben MAE; Eschenhagen T; Giacomelli E; Grandela C; Hansen A; Holman ER; Jongbloed MRM; Kamel SM; Koopman CD; Lachaud Q; Mannhardt I; Mol MPH; Mosqueira D; Orlova VV; Passier R; Ribeiro MC; Saleem U; Smith GL; Burton FL; Mummery CL MUSCLEMOTION: a versatile open software tool to quantify cardiomyocyte and cardiac muscle contraction in vitro and in vivo. Circ Res 2018, 122, e5–e16. DOI: 10.1161/CIRCRESAHA.117.312067. [DOI] [PMC free article] [PubMed] [Google Scholar]
- 29.Huebsch N; Loskill P; Mandegar MA; Marks NC; Sheehan AS; Ma Z; Mathur A; Nguyen TN; Yoo JC; Judge LM; Spencer CI; Chukka AC; Russell CR; So PL; Conklin BR; Healy KE Automated video-based analysis of contractility and calcium flux in human-induced pluripotent stem cell-derived cardiomyocytes cultured over different spatial scales. Tissue Eng. Part C Methods 2015, 21, 467–479. DOI: 10.1089/ten.TEC.2014.0283. [DOI] [PMC free article] [PubMed] [Google Scholar]
- 30.Hayakawa T; Kunihiro T; Dowaki S; Uno H; Matsui E; Uchida M; Kobayashi S; Yasuda A; Shimizu T; Okano T Noninvasive evaluation of contractile behavior of cardiomyocyte monolayers based on motion vector analysis. Tissue Eng. Part C Methods 2012, 18, 21–32. DOI: 10.1089/ten.TEC.2011.0273. [DOI] [PubMed] [Google Scholar]
- 31.van der Maaten L; Hinton G Visualizing data using t-SNE. J. Mach. Lear. Res 2008, 9, 2579–2605. [Google Scholar]
- 32.van der Maater L Accelerating t-SNE using tree-based algorithms. J. Mach. Lear. Res 2014, 15, 3221–3245. [Google Scholar]
- 33.Wu X; Kumar V; Quinlan JR; Ghosh J; Yang Q; Motoda H; McLachlan GJ; Ng A; Liu B; Yu PS; Zhou Z; Steinbach M; Hand DJ; Steinberg D Top 10 algorithms in data mining. Knowl. Inf. Syst 2008, 14, 1–37. DOI: 10.1007/s10115-007-0114-2. [DOI] [Google Scholar]
- 34.Data mining: concepts and techniques, 3rd ed.; Han J, Kamber M, Pei J; Morgan Kaufmann, 2011. [Google Scholar]
- 35.Pattern classification, 2nd ed.; Duda RO, Hart PE, Stork DG; John Wiley & Sons, 2000. [Google Scholar]
- 36.Geurts P; Irrthum A; Wehenkel L Supervised learning with decision tree-based methods in computational and systems biology. Mol. Biosyst 2009, 5, 1593–1605. DOI: 10.1039/b907946g. [DOI] [PubMed] [Google Scholar]
- 37.Data mining: a knowledge discovery approach, 1st ed.; Cios KJ, Pedrycz W, Swiniarski RW, Kurgan LA; Springer, 2007. [Google Scholar]
- 38.Wu W; Mallet Y; Walczak B; Penninckx W; Massart DL; Heuerding S; Erni F Comparison of regularized discriminant analysis linear discriminant analysis and quadratic discriminant analysis applied to NIR data. Anal. Chim. Acta 1996, 329, 257–265. DOI: 10.1016/0003-2670(96)00142-0. [DOI] [Google Scholar]
- 39.The elements of statistical learning: data mining, inference, and prediction, 2nd ed.; Hastle T, Tibshirani R, Friedmann J; Springer, 2009. [Google Scholar]
- 40.Cortes C; Vapnik V Support-vector networks. Mach. Learn 1995, 20, 273–297. DOI: 10.1007/BF00994018. [DOI] [Google Scholar]
- 41.Encyclopedia of Machine Learning, 2010th ed.; Sammut C, Webb GI; Springer, 2011. [Google Scholar]
- 42.Laurila E; Ahola A; Hyttinen J; Aalto-Setälä K Methods for in vitro functional analysis of iPSC derived cardiomyocytes - Special focus on analyzing the mechanical beating behavior. Biochim. Biophys. Acta 2016, 1863, 1864–1872. DOI: 10.1016/j.bbamcr.2015.12.013. [DOI] [PubMed] [Google Scholar]
- 43.Peters MF; Lamore SD; Guo L; Scott CW; Kolaja KL Human stem cell-derived cardiomyocytes in cellular impedance assays: bringing cardiotoxicity screening to the front line. Cardiovasc. Toxicol 2015, 15, 127–139. DOI: 10.1007/s12012-014-9268-9. [DOI] [PubMed] [Google Scholar]
- 44.Shinnawi R; Huber I; Maizels L; Shaheen N; Gepstein A; Arbel G; Tijsen AJ; Gepstein L Monitoring human-induced pluripotent stem cell-derived cardiomyocytes with genetically encoded calcium and voltage fluorescent reporters. Stem Cell Reports 2015, 5, 582–596. DOI: 10.1016/j.stemcr.2015.08.009. [DOI] [PMC free article] [PubMed] [Google Scholar]
- 45.Herron TJ; Lee P; Jalife J Optical imaging of voltage and calcium in cardiac cells & tissues. Circ. Res 2012, 110, 609–623. DOI: 10.1161/CIRCRESAHA.111.247494. [DOI] [PMC free article] [PubMed] [Google Scholar]
- 46.Mukherjee S; Tamayo P; Rogers S; Rifkin R; Engle A; Campbell C; Golub TR; Mesirov JP Estimating dataset size requirements for classifying DNA microarray data. J. Comput. Biol 2003, 10, 119–142. DOI: 10.1089/106652703321825928. [DOI] [PubMed] [Google Scholar]
- 47.Figueroa RL; Zeng-Treitler Q; Kandula S; Ngo LH Predicting sample size required for classification performance. BMC Med. Inform. Decis. Mak 2012, 12, 8. DOI: 10.1186/1472-6947-12-8. [DOI] [PMC free article] [PubMed] [Google Scholar]
Associated Data
This section collects any data citations, data availability statements, or supplementary materials included in this article.